In the world of finance, numbers are the language of progress. Whether you are tracking the growth of a stock portfolio, analyzing the quarterly revenue of a startup, or evaluating the impact of inflation on your purchasing power, the ability to quantify change is essential. At the heart of this analysis lies a fundamental mathematical tool: the percentage change increase.
Understanding how to calculate percentage change is more than just a classroom exercise; it is a vital skill for personal finance management and corporate strategy. It allows investors and business owners to strip away the distractions of absolute values and focus on the relative velocity of growth. In this guide, we will explore the mechanics of calculating percentage increases, their applications in various financial sectors, and how to interpret these figures to make informed wealth-building decisions.

The Mathematical Foundation of Financial Growth
Before diving into complex balance sheets or market trends, one must master the core formula. Percentage change measures the relationship between an old value and a new value, expressed as a fraction of the original amount.
The Standard Percentage Increase Formula
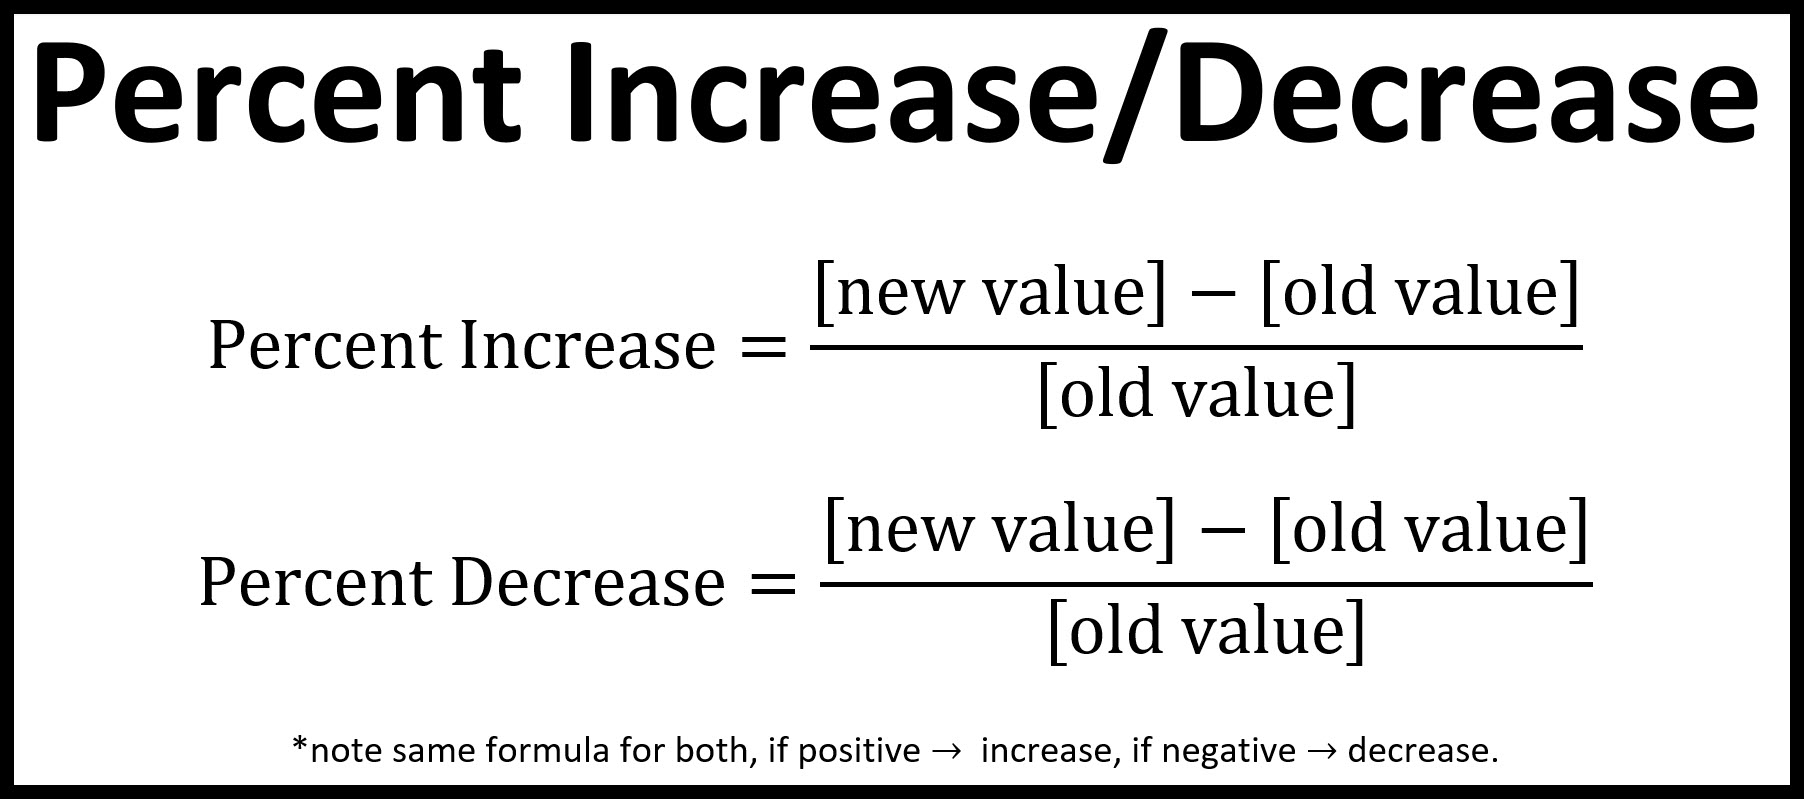
To calculate the percentage increase, you follow a simple three-step process:
- Subtract the original value (the “old” number) from the new value (the “new” number).
- Divide that difference by the original value.
- Multiply the result by 100 to convert the decimal into a percentage.
The formula looks like this:
((New Value – Old Value) / Old Value) × 100 = Percentage Increase
Why the Denominator Matters
In financial analysis, the “Old Value” (the denominator) is the most critical part of the equation. It represents your baseline. For instance, a $100 profit increase means something very different to a small lemonade stand than it does to a multinational corporation. By dividing the increase by the original value, you gain perspective on the scale of the growth relative to the size of the initial investment.
Distinguishing Between Absolute and Relative Change
New investors often confuse absolute change with percentage change. If Stock A grows by $10 and Stock B grows by $10, their absolute change is identical. However, if Stock A started at $50 and Stock B started at $500, Stock A has seen a 20% increase, while Stock B has only seen a 2% increase. In the realm of money, the percentage—the relative change—is usually the more significant indicator of performance.
Applying Percentage Change to Investment Portfolios
For the individual investor, calculating percentage change is the primary method for determining Return on Investment (ROI). Without this calculation, it is impossible to accurately compare the performance of different asset classes, such as stocks, bonds, or real estate.
Evaluating Stock Market Gains
When you buy a share of a company, your primary goal is capital appreciation. Suppose you purchased shares of a fintech company at $120 per share, and a year later, the price sits at $150. Using our formula:
- ($150 – $120) / $120 = 0.25
- 0.25 × 100 = 25%
A 25% increase indicates a strong performance. However, savvy investors also use this formula to account for total returns, adding dividends received during the holding period to the “New Value” to get a comprehensive view of their money’s growth.
Comparing Asset Class Performance
One of the greatest benefits of calculating percentage change is the ability to compare “apples to oranges.” If your real estate holdings increased in value by 8% this year while your crypto-currency portfolio increased by 50%, the percentage change formula allows you to see exactly where your capital is most productive. This data is essential for rebalancing a portfolio—the process of selling high-performing assets to maintain a desired risk profile.
The Role of Compound Growth
While simple percentage change measures growth over a single period, investors often look at the Compound Annual Growth Rate (CAGR). This is an evolution of the percentage change formula that accounts for growth over multiple years, providing a “smoothed” annual return. Understanding the basic percentage increase is the first step toward mastering these more complex financial metrics.

Strategic Business Finance and Revenue Analysis
In a corporate or small business setting, percentage change calculations are used to monitor the health of the company. These metrics are often referred to as “Growth Metrics” and are a staple of quarterly earnings reports.
Analyzing Year-over-Year (YoY) Growth
Businesses rarely look at revenue in isolation. Instead, they look at Year-over-Year (YoY) growth. By comparing the revenue of Q3 2023 to Q3 2024, a business can eliminate seasonal fluctuations. If a retail store made $200,000 last December and $220,000 this December, they have achieved a 10% YoY increase. This percentage is a key indicator for stakeholders and potential lenders regarding the business’s trajectory.
Monitoring Profit Margin Expansion
It isn’t just about how much money is coming in (revenue); it’s about how much you keep (profit). Business owners use percentage change to track “margin expansion.” If your cost of goods sold (COGS) increases by 5% but your sale price increases by 10%, your profit margin is expanding. Conversely, if your expenses are increasing at a higher percentage than your income, the business is becoming less efficient, even if the total revenue numbers look positive.
Budgeting and Expense Control
On the flip side of income is expenditure. Percentage change is a powerful tool for departmental budgeting. If the marketing department’s spending increased by 15% but lead generation only increased by 2%, the “percentage change increase” in costs is outstripping the “percentage change increase” in results. This signals a need for strategic adjustment or a pivot in resource allocation.
Financial Tools and Automation for Calculation
While the manual formula is vital for understanding the logic, the modern financial landscape offers various tools to automate these calculations, ensuring accuracy and saving time.
Utilizing Excel and Google Sheets
For most finance professionals, spreadsheets are the go-to tool. In Excel, if your old value is in cell A1 and your new value is in cell B1, the formula is =(B1-A1)/A1. By formatting the cell as a “Percentage,” the software automatically multiplies by 100 and adds the “%” symbol. This allows for the rapid analysis of massive datasets, such as tracking the daily price changes of hundreds of stocks simultaneously.
Financial Calculators and Apps
There are countless specialized financial calculators available online and as mobile apps designed specifically for “Percentage Increase” and “Margin/Markup” calculations. These are particularly useful for real estate agents calculating commission increases or retail buyers determining price hikes based on wholesale cost changes.
Integrating Calculations into Accounting Software
Modern accounting software like QuickBooks or Xero automatically generates “Horizontal Analysis” reports. These reports take the percentage change formula and apply it across every line item on a balance sheet or income statement. This automation allows business owners to identify “red flag” categories where expenses might be creeping up by a significant percentage unnoticed.
Interpreting the Data: Contextualizing Financial Increases
A percentage increase does not exist in a vacuum. To be an effective manager of money, one must interpret these percentages through the lens of the broader economic environment.
The Impact of Inflation
Inflation is the “hidden” percentage change that affects every other financial metric. If your salary increased by 3% this year, but the national inflation rate (the percentage increase in the Consumer Price Index) was 5%, your “real” income actually decreased by 2%. In personal finance, always subtract the inflation percentage from your nominal gains to find your real rate of growth.
Risk vs. Reward Ratios
In investing, a high percentage increase often comes with high volatility. A stock that increases by 80% in one month is statistically more likely to experience a significant percentage decrease shortly after. Financial literacy involves looking at the percentage change in conjunction with “Drawdown”—the percentage a value falls from its peak. A balanced financial strategy seeks consistent, sustainable percentage increases rather than volatile spikes.
The Importance of Base Effects
When interpreting financial news, be wary of the “Small Base Effect.” If a brand new company grows its revenue from $1 to $10, it boasts a staggering 900% increase. While mathematically accurate, it is not as impressive as an established company growing from $1 billion to $1.1 billion (a 10% increase). Always look at the absolute numbers alongside the percentage change to get the full story of financial health.
By mastering the calculation of percentage change increases, you equip yourself with the analytical lens necessary to navigate the complexities of the financial world. Whether you are optimizing a personal savings plan or steering a corporate ship, this simple yet profound calculation remains the gold standard for measuring success and planning for future wealth.
aViewFromTheCave is a participant in the Amazon Services LLC Associates Program, an affiliate advertising program designed to provide a means for sites to earn advertising fees by advertising and linking to Amazon.com. Amazon, the Amazon logo, AmazonSupply, and the AmazonSupply logo are trademarks of Amazon.com, Inc. or its affiliates. As an Amazon Associate we earn affiliate commissions from qualifying purchases.