
In the realm of personal finance and business management, numbers are the language of progress. However, while most investors and entrepreneurs focus heavily on growth and percentage increases, understanding the inverse—percent decrease—is arguably more critical for risk management and long-term sustainability. Whether you are tracking a dip in your investment portfolio, analyzing a reduction in operational costs, or evaluating the impact of a market correction, knowing how to calculate and interpret percent decrease is a fundamental skill.
This guide explores the mathematical mechanics of percent decrease through the lens of business finance and wealth management, providing the insights necessary to turn raw data into strategic financial decisions.
The Fundamental Formula for Percent Decrease in Finance
At its core, calculating a percentage decrease is a method of quantifying the relative change between an initial value and a lower subsequent value. In financial terms, this allows us to move beyond “how many dollars were lost” to “what portion of the value has vanished,” which provides essential context for comparison.
Breaking Down the Components: New vs. Old Value
To perform the calculation, you must identify two primary data points: the Original Value (the starting point) and the New Value (the ending point). In a percent decrease scenario, the New Value must be lower than the Original Value.
For an investor, the Original Value might be the purchase price of a stock ($150), while the New Value is the current market price after a bearish week ($120). For a business owner, the Original Value could be last quarter’s overhead expenses ($50,000), and the New Value represents the reduced expenses after a successful efficiency drive ($42,000).
Step-by-Step Calculation Guide
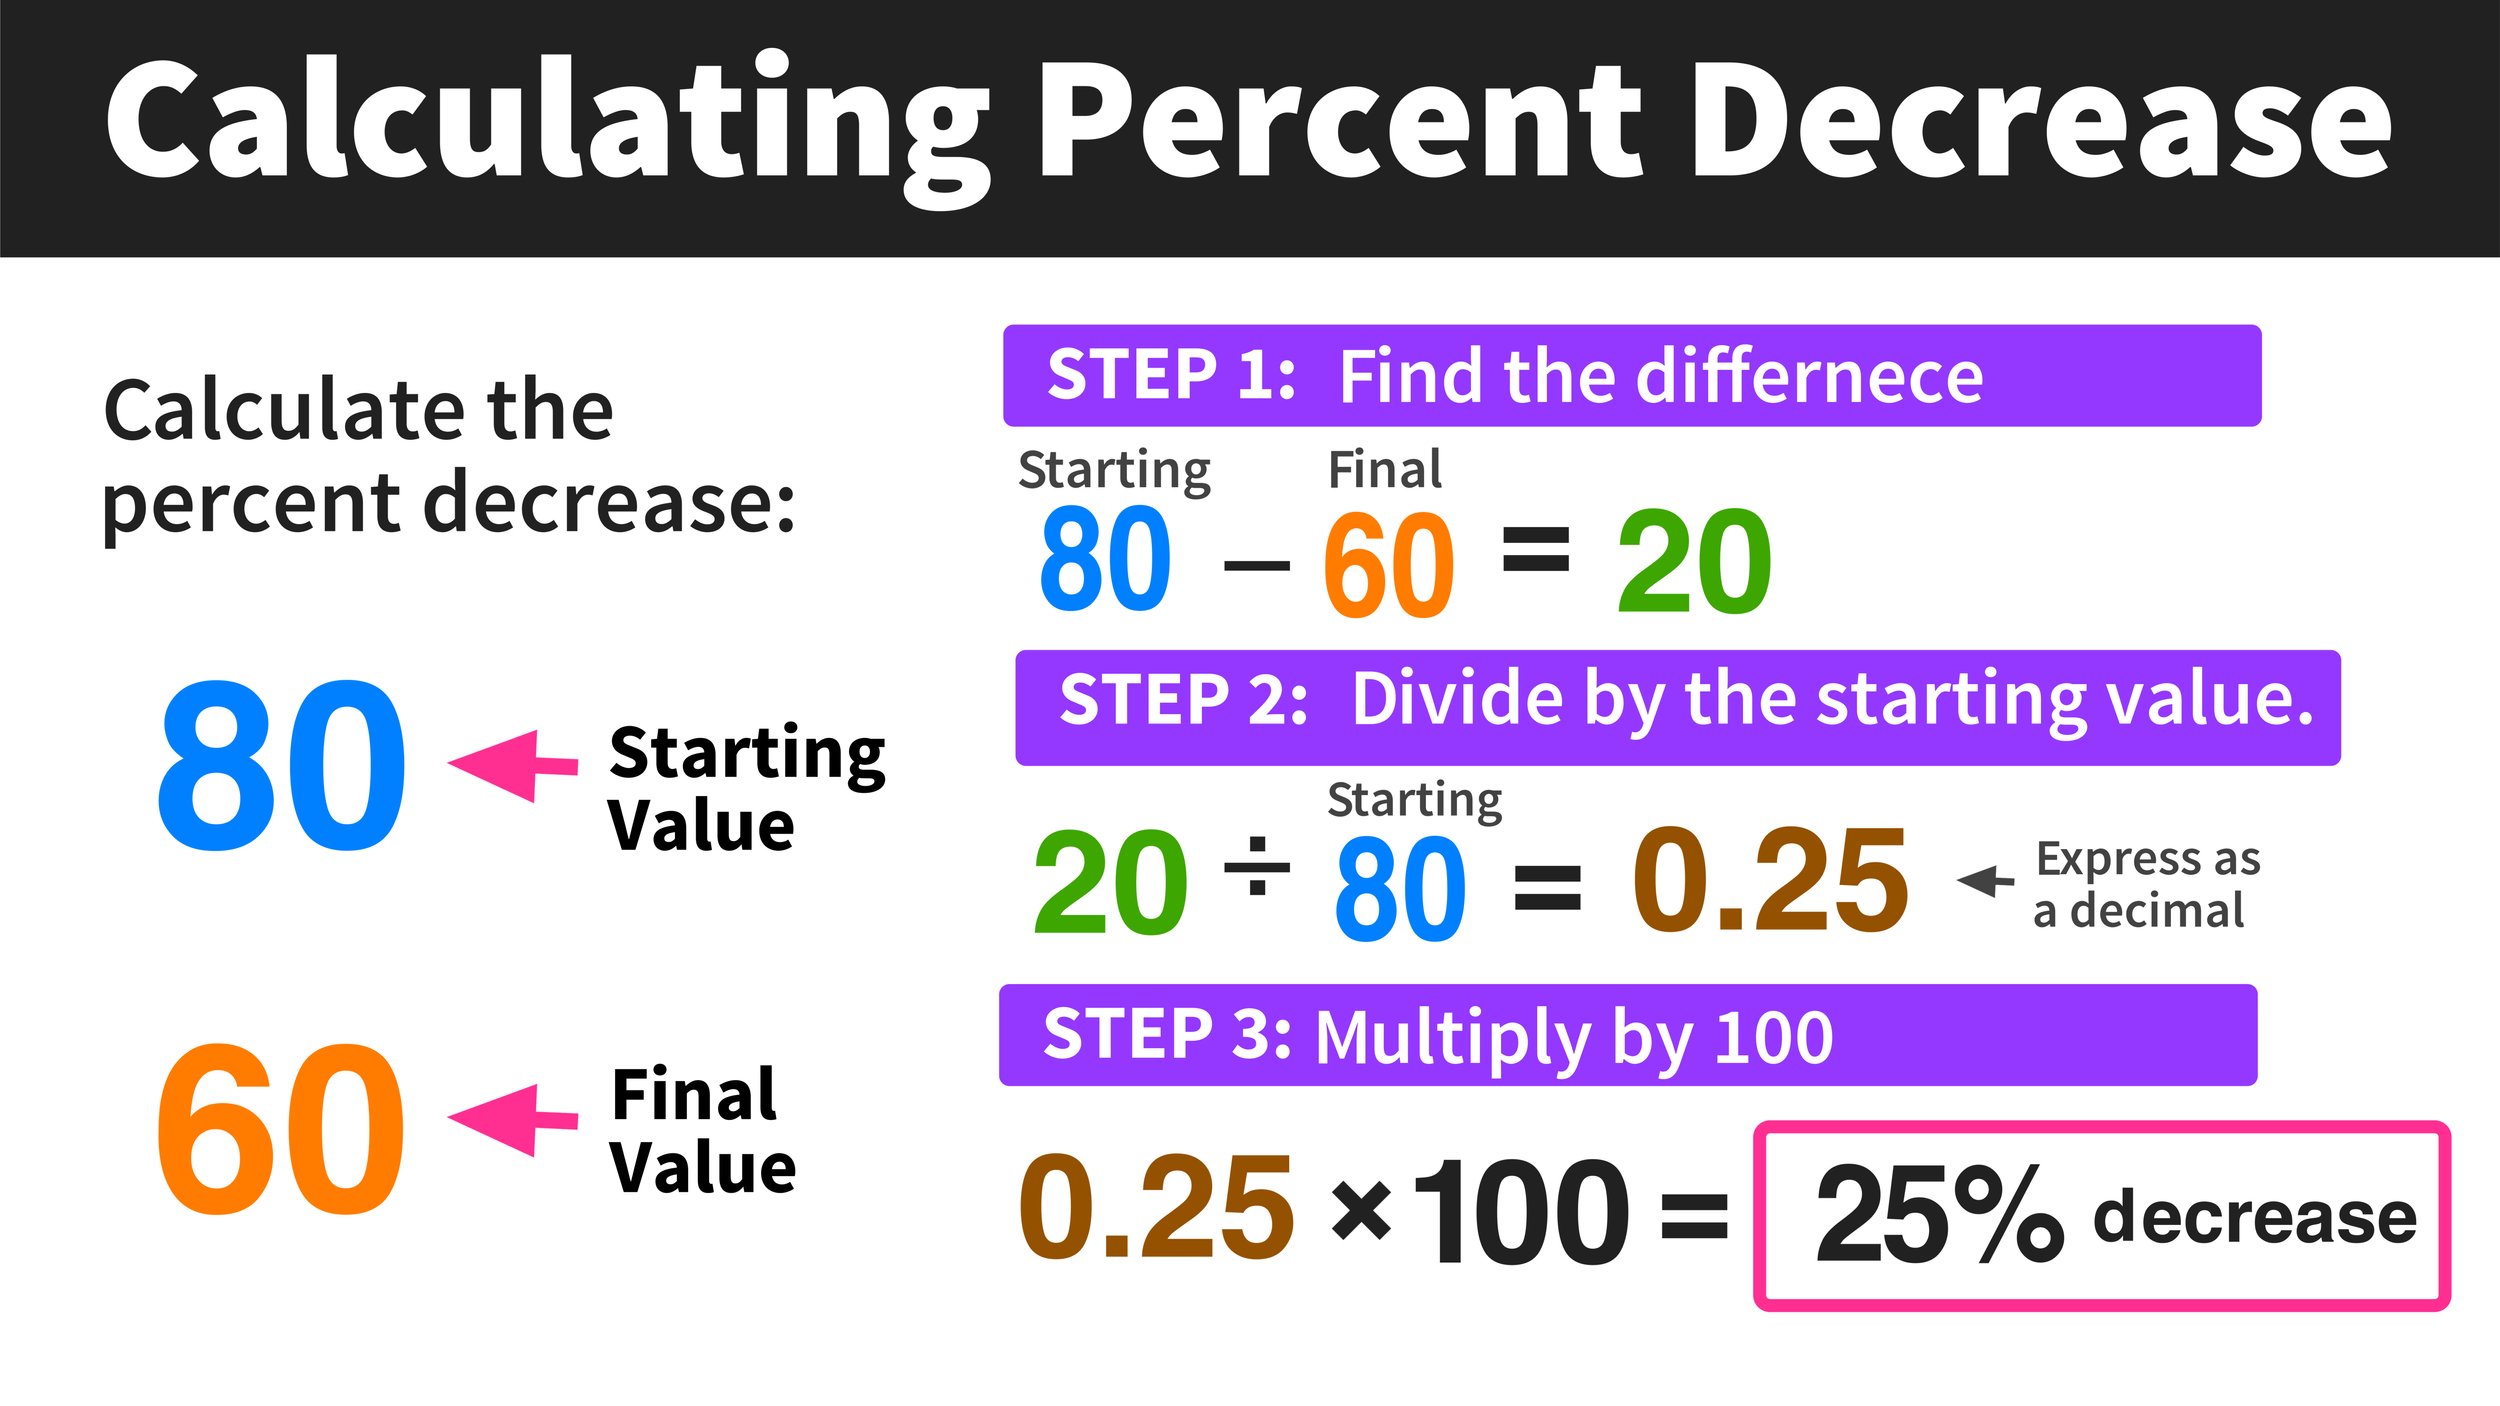
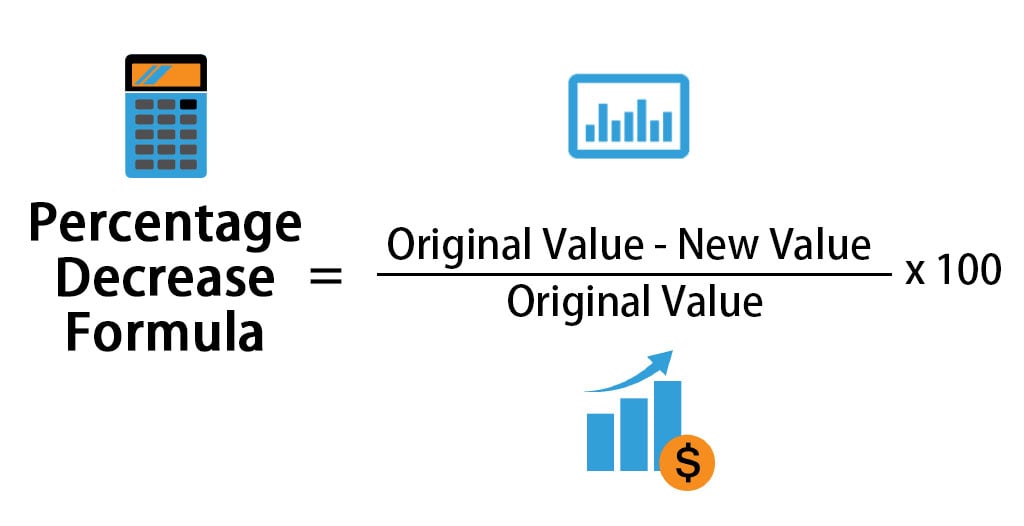
The formula for percent decrease is standardized across all financial sectors:
Percent Decrease = [(Original Value – New Value) / Original Value] × 100
To arrive at the result, follow these three steps:
- Find the Absolute Difference: Subtract the New Value from the Original Value. (e.g., $150 – $120 = $30).
- Divide by the Original: Divide that difference by the Original Value. (e.g., $30 / $150 = 0.2).
- Convert to Percentage: Multiply the decimal by 100 to find the percentage. (e.g., 0.2 × 100 = 20%).
Avoiding Common Mathematical Pitfalls
One of the most frequent errors in financial reporting is “denominator confusion.” Users often mistakenly divide the difference by the New Value instead of the Original Value. In our example above, dividing $30 by $120 would yield 25%, which is an incorrect representation of the decrease from the starting point. Always remember that the “base” of your calculation must be the value from which the decline originated.
Analyzing Market Volatility and Portfolio Performance
In wealth management, the percent decrease is most commonly used to measure “drawdowns”—the peak-to-trough decline during a specific record period of an investment or fund. Understanding these percentages is vital for maintaining a balanced risk profile.
Evaluating Stock Price Corrections
Market “corrections” are formally defined by percent decreases. Traditionally, a dip of 10% from recent highs is considered a correction, while a decrease of 20% or more signals a bear market. For an individual investor, calculating these decreases helps in identifying entry points or determining if a stop-loss order should be triggered. If your portfolio value drops from $1,000,000 to $850,000, you are experiencing a 15% decrease. Recognizing this enables you to compare your performance against benchmarks like the S&P 500 to see if your assets are underperforming the broader market.
The Asymmetry of Loss: Why Percent Decrease Matters
A crucial concept for every investor to master is the “Asymmetry of Loss.” This refers to the fact that it takes a larger percentage increase to recover from a percentage decrease.
For example, if an asset suffers a 10% decrease, you only need an 11.1% increase to return to the original value. However, if an asset suffers a 50% decrease (cutting your money in half), you require a 100% increase (doubling your money) just to break even. This mathematical reality is why sophisticated investors prioritize “downside protection.” By calculating and limiting percent decreases, you preserve the capital necessary to participate in future growth without needing astronomical returns to recover.
Comparing Nominal vs. Real Decreases
In an inflationary environment, a “nominal” decrease (the raw number) may not tell the whole story. If your savings account balance stays the same but inflation rises by 5%, your “real” purchasing power has experienced a percent decrease. Financial planners use these calculations to ensure that a client’s “real rate of return” remains positive after accounting for the decreasing value of currency.
Business Finance: Managing Margin Contraction and Cost Reductions
For corporate CFOs and small business owners, percent decrease is a key performance indicator (KPI) used to track efficiency and fiscal health. While a decrease in revenue is usually a negative signal, a percent decrease in expenses is a celebrated achievement.
Measuring Revenue Decline and Seasonal Trends
Businesses often face cyclicality. A retail business might see a significant percent decrease in sales in February compared to December. By calculating this decrease annually, management can determine if the drop is a standard seasonal trend or a sign of waning brand relevance. For instance, if revenue dropped 15% last February but 25% this February, the 10-percentage-point difference indicates a deeper systemic issue that requires strategic intervention.
Calculating Operational Efficiency through Expense Reduction
Profitability isn’t just about earning more; it’s about spending less. When a company undergoes a “lean” transformation, the primary metric for success is the percent decrease in Waste or Cost of Goods Sold (COGS).
If a manufacturing plant reduces its energy consumption from 20,000 kWh per month to 16,000 kWh, they have achieved a 20% decrease in energy usage. This specific figure is much more useful for stakeholders than simply saying “we saved 4,000 kWh,” as it allows the company to set standardized goals for other facilities regardless of their size.
Impact on Net Profit Margins
Percent decrease is also used to analyze “margin compression.” If your revenue stays flat but your expenses increase, your profit margin will show a percent decrease. Monitoring this metric allows business leaders to adjust pricing strategies. If the net profit margin decreases from 15% to 12%, that represents a 20% decrease in profitability—a significant shift that demands an audit of the supply chain or an increase in customer pricing.
Strategic Financial Planning Using Percent Decrease Tools
Beyond reactive analysis, calculating percent decrease is a proactive tool used in budgeting, debt management, and financial forecasting.
Budgeting and Debt Reduction Strategies
For individuals focused on personal finance, the goal is often a percent decrease in high-interest debt. Using the “Debt Snowball” or “Debt Avalanche” methods, debtors can track their progress monthly. Seeing a 30% decrease in a credit card balance over six months provides the psychological momentum needed to continue the journey toward financial freedom.
Similarly, in household budgeting, aiming for a 10% decrease in “discretionary spending” (dining out, entertainment) can reallocate hundreds of dollars toward retirement accounts or emergency funds, showcasing how a small percentage change can lead to a large shift in long-term net worth.
Utilizing Spreadsheet Software for Financial Analysis
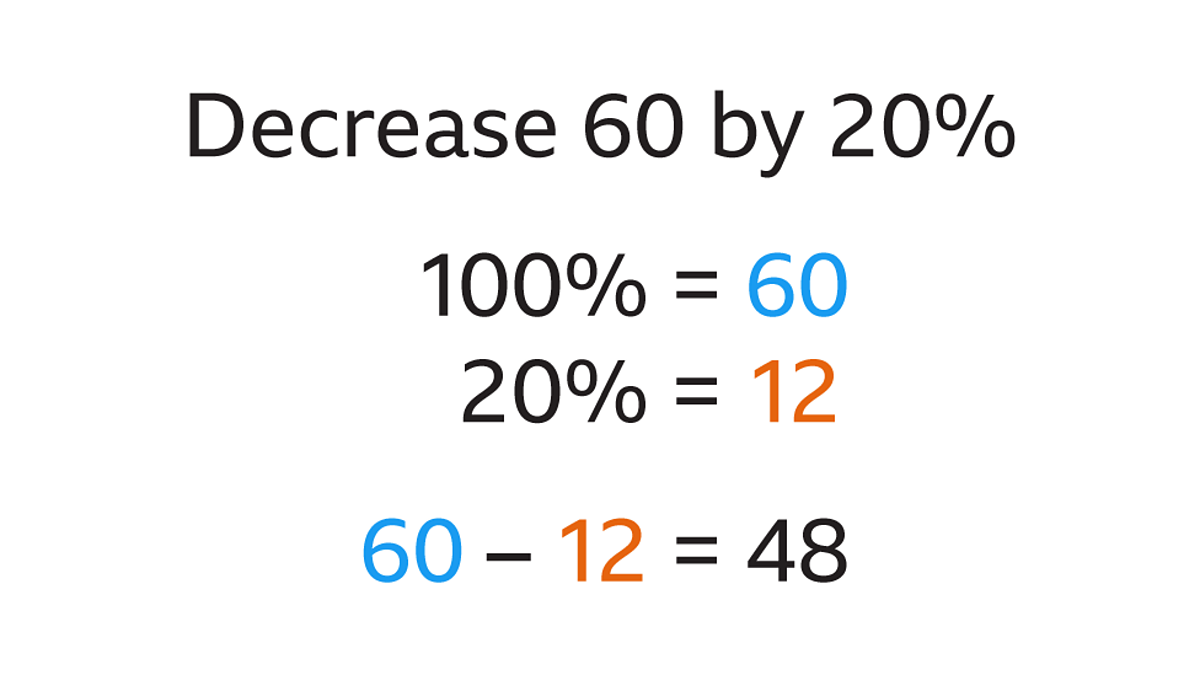
In modern finance, manual calculations are often replaced by tools like Microsoft Excel or Google Sheets. To calculate percent decrease across hundreds of data points, financial analysts use the formula: =(New_Value - Original_Value) / Original_Value.
Note that in spreadsheet software, this formula will often return a negative number (e.g., -0.20) to indicate a decrease. By formatting the cell as a “Percentage,” the software provides an instant visual cue of financial health. Professional dashboards use conditional formatting—turning cells red when a percent decrease exceeds a certain threshold—to alert managers to potential financial crises in real-time.
Setting Benchmarks for Fiscal Health
Finally, percent decrease calculations allow for effective benchmarking. How does your company’s 5% decrease in quarterly earnings compare to the industry average? If the industry average decrease was 15%, your company is actually outperforming its peers despite the nominal loss.
In personal finance, comparing your percent decrease in spending to your previous year’s performance helps in creating a “baseline.” Financial success is rarely about absolute numbers; it is about the relative movement of those numbers in a direction that supports your long-term goals. By mastering the calculation of percent decrease, you gain the clarity needed to navigate the complexities of the financial world with precision and confidence.
aViewFromTheCave is a participant in the Amazon Services LLC Associates Program, an affiliate advertising program designed to provide a means for sites to earn advertising fees by advertising and linking to Amazon.com. Amazon, the Amazon logo, AmazonSupply, and the AmazonSupply logo are trademarks of Amazon.com, Inc. or its affiliates. As an Amazon Associate we earn affiliate commissions from qualifying purchases.