
Understanding how to calculate percentage increases and decreases is not just a mathematical exercise; it’s a fundamental skill essential for navigating the complexities of personal finance, investment strategies, and business analysis. In the world of money, numbers rarely stand alone; their value often lies in their change relative to a previous state. Whether you’re tracking your investment portfolio’s growth, evaluating salary adjustments, optimizing a budget, or analyzing a company’s financial performance, the ability to accurately quantify these changes in percentage terms provides invaluable insight.
This guide will demystify the process, breaking down the core formulas and illustrating their application across various financial scenarios. By mastering these calculations, you’ll gain a clearer perspective on your financial trajectory, enabling more informed decision-making and a deeper understanding of the financial landscape around you.

The Fundamentals of Percentage Change
At its core, a percentage change measures the relative difference between an old value and a new value, expressed as a fraction of the old value, multiplied by 100. It provides a standardized way to compare changes, regardless of the absolute size of the numbers involved.
Defining Percentage Change
A percentage change is a way to express a change in a variable in relation to its previous value. It tells us how much something has grown or shrunk proportionally. For instance, a $100 increase in a $1,000 investment is a 10% increase, while a $100 increase in a $10,000 investment is only a 1% increase. Without percentages, simply looking at the absolute dollar amount ($100) wouldn’t convey the true significance of the change in context.
The calculation allows for easy comparison across different data sets and scales. It helps answer questions like:
-
How much did my salary increase this year?
-
What was the return on my investment?
-
By what percentage did our company’s sales decline?
-
How much more expensive are groceries compared to last year?
The Basic Formula Explained
The universal formula for calculating percentage change is straightforward:
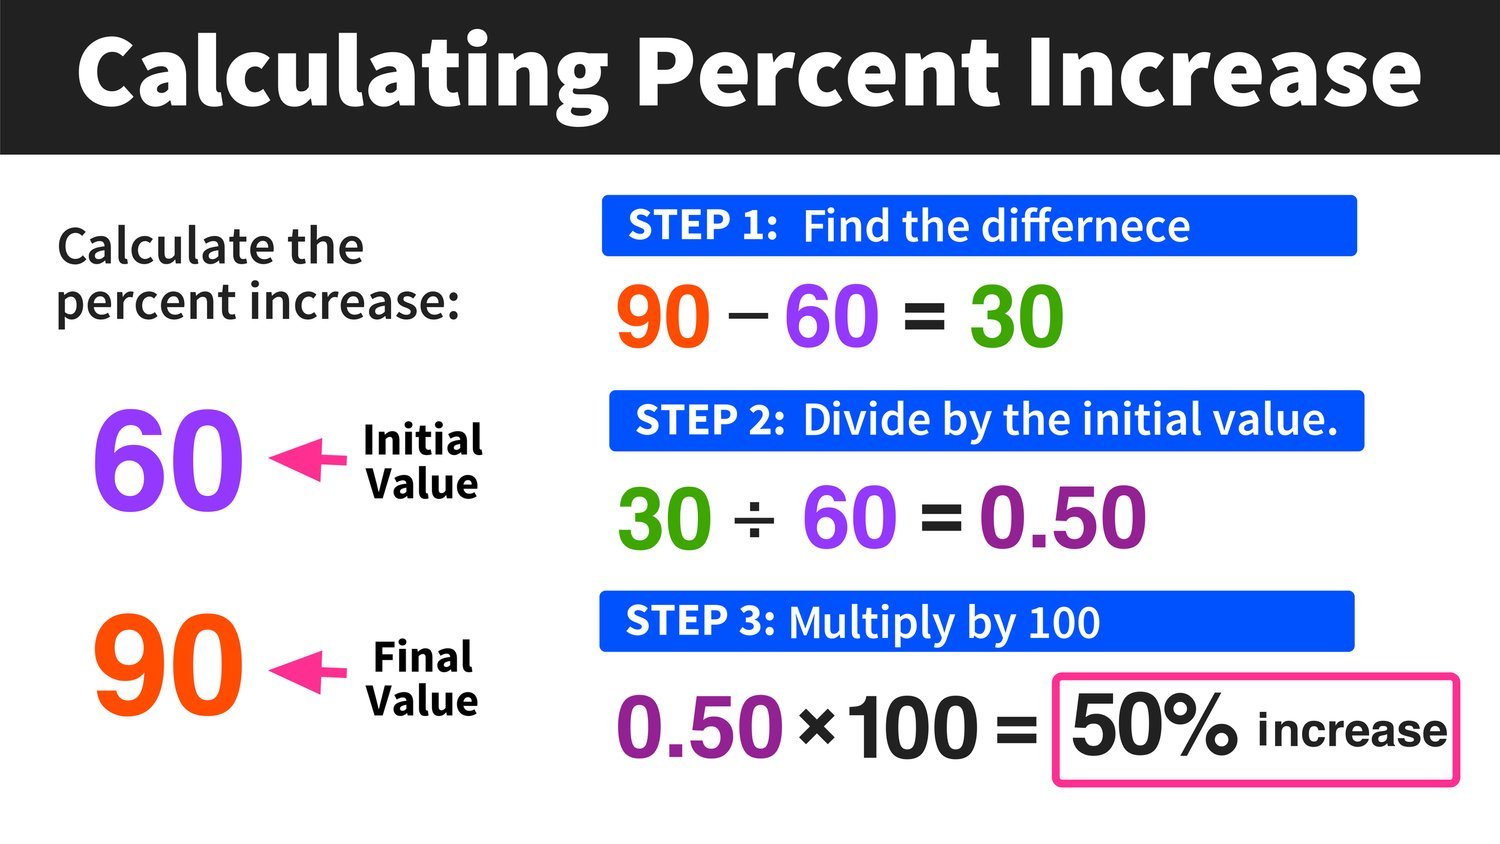
Percentage Change = [ (New Value – Old Value) / Old Value ] * 100
Let’s break down each component:
-
New Value (or Current Value): This is the most recent or final figure you are comparing.
-
Old Value (or Original Value/Starting Value): This is the initial or baseline figure from which the change occurred.
-
Difference (New Value – Old Value): This calculates the absolute change between the two values.
-
If the New Value is greater than the Old Value, the difference will be positive, indicating an increase.
-
If the New Value is less than the Old Value, the difference will be negative, indicating a decrease.
-
-
Divided by Old Value: This step normalizes the absolute change, expressing it as a proportion of the original amount. This is crucial because it contextualizes the change.
-
Multiplied by 100: This converts the decimal proportion into a percentage, making it easier to read and understand.
Example: If your investment portfolio grew from $10,000 (Old Value) to $12,000 (New Value):
Percentage Change = [ ($12,000 – $10,000) / $10,000 ] * 100
Percentage Change = [ $2,000 / $10,000 ] * 100
Percentage Change = 0.20 * 100
Percentage Change = 20%
A positive result signifies a percentage increase, while a negative result indicates a percentage decrease.
Calculating Percentage Increase: Growing Your Wealth
Understanding percentage increase is vital for recognizing and capitalizing on financial growth, whether it’s in your personal income, investments, or business ventures.
Personal Finance Growth
Tracking percentage increases in your personal finances allows you to gauge progress towards financial goals and understand changes in your cost of living.
-
Salary Increase: Suppose your annual salary increased from $60,000 to $63,000.
Percentage Increase = [ ($63,000 – $60,000) / $60,000 ] * 100
Percentage Increase = [ $3,000 / $60,000 ] * 100
Percentage Increase = 0.05 * 100 = 5%
This tells you your purchasing power from your salary has effectively increased by 5%.
-
Savings Account Interest Growth: If you deposited $5,000 into a savings account, and after a year it became $5,050 due to interest.
Percentage Increase = [ ($5,050 – $5,000) / $5,000 ] * 100
Percentage Increase = [ $50 / $5,000 ] * 100
Percentage Increase = 0.01 * 100 = 1%
This is your annual percentage yield (APY) for that year.
-
Budget Category Increase: If your monthly grocery spending went from $400 last year to $450 this year.
Percentage Increase = [ ($450 – $400) / $400 ] * 100
Percentage Increase = [ $50 / $400 ] * 100
Percentage Increase = 0.125 * 100 = 12.5%
This significant increase might prompt you to review your spending habits or account for inflation.
Investment Gains
For investors, calculating percentage increase is fundamental to assessing the performance of assets and portfolios.
-
Stock Price Appreciation: You bought a stock for $50 per share, and it is now trading at $58 per share.
Percentage Increase = [ ($58 – $50) / $50 ] * 100
Percentage Increase = [ $8 / $50 ] * 100
Percentage Increase = 0.16 * 100 = 16%
This 16% gain represents a solid return on your initial investment.
-
Portfolio Growth Over Time (ROI): Your investment portfolio started the year at $100,000 and ended at $115,000.
Percentage Increase = [ ($115,000 – $100,000) / $100,000 ] * 100
Percentage Increase = [ $15,000 / $100,000 ] * 100
Percentage Increase = 0.15 * 100 = 15%
This 15% return on investment (ROI) is a key metric for evaluating your portfolio’s performance against benchmarks.
Business Revenue Growth
Businesses constantly monitor percentage increases to measure success, identify growth trends, and make strategic decisions.
-
Quarter-over-Quarter Sales Increase: A company’s sales revenue in Q1 was $500,000 and increased to $625,000 in Q2.
Percentage Increase = [ ($625,000 – $500,000) / $500,000 ] * 100
Percentage Increase = [ $125,000 / $500,000 ] * 100
Percentage Increase = 0.25 * 100 = 25%
A 25% growth in sales is a strong indicator of market traction and operational efficiency.
-
Profit Margin Improvement: If a product’s profit margin improved from 20% to 25% (note: this is a percentage point increase, but to calculate the percentage increase in the margin itself):
Old Margin = 20% = 0.20
New Margin = 25% = 0.25
Percentage Increase = [ (0.25 – 0.20) / 0.20 ] * 100
Percentage Increase = [ 0.05 / 0.20 ] * 100
Percentage Increase = 0.25 * 100 = 25%
This means the profit margin itself increased by 25% relative to its original value.
Calculating Percentage Decrease: Managing Losses and Optimizing Costs
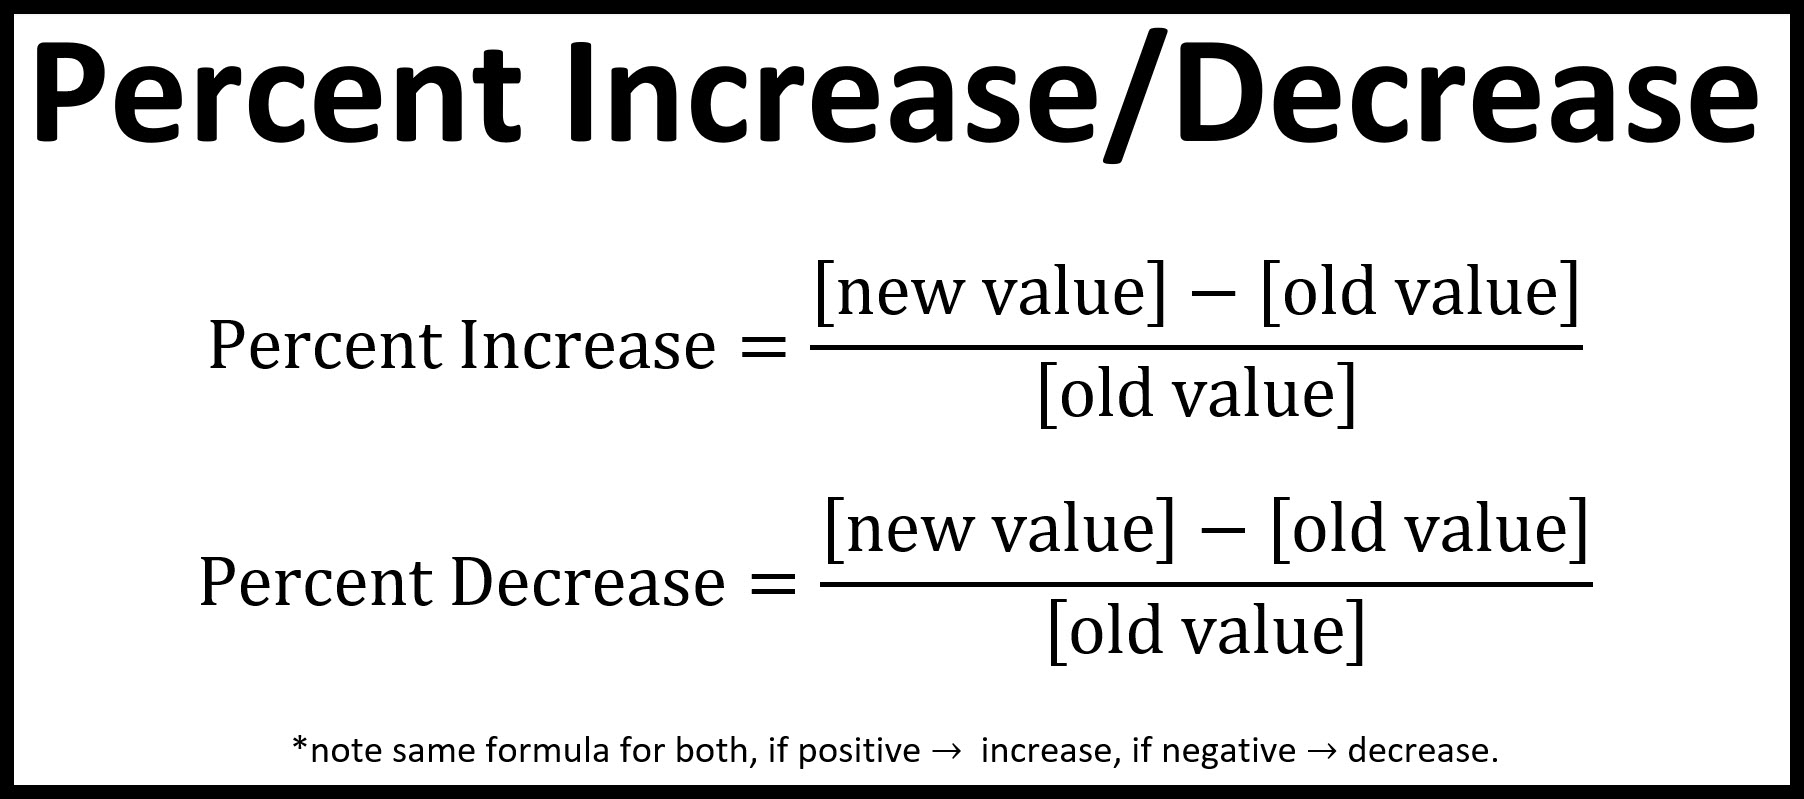
Just as increases signify growth, decreases are crucial for identifying areas of concern, optimizing spending, and understanding reductions in value. The same formula applies, but the result will be a negative percentage, indicating a decrease.
Personal Finance Reductions
Monitoring percentage decreases can highlight areas for budget adjustments and improved financial health.
-
Budget Optimization (Spending Decrease): You managed to reduce your monthly entertainment spending from $200 to $150.
Percentage Decrease = [ ($150 – $200) / $200 ] * 100
Percentage Decrease = [ -$50 / $200 ] * 100
Percentage Decrease = -0.25 * 100 = -25%
A 25% reduction in entertainment spending frees up funds for savings or other priorities.
-
Debt Reduction: If your credit card debt went from $5,000 to $4,000 in a quarter.
Percentage Decrease = [ ($4,000 – $5,000) / $5,000 ] * 100
Percentage Decrease = [ -$1,000 / $5,000 ] * 100
Percentage Decrease = -0.20 * 100 = -20%
This signifies significant progress in debt repayment.
Investment Losses
Understanding percentage decreases is critical for managing risk and evaluating underperforming investments.
-
Stock Price Depreciation: You bought a stock for $100, and it has fallen to $85.
Percentage Decrease = [ ($85 – $100) / $100 ] * 100
Percentage Decrease = [ -$15 / $100 ] * 100
Percentage Decrease = -0.15 * 100 = -15%
This 15% drop represents a capital loss on your investment.
-
Portfolio Drawdown: Your portfolio, which was worth $200,000 at its peak, has dropped to $180,000.
Percentage Decrease = [ ($180,000 – $200,000) / $200,000 ] * 100
Percentage Decrease = [ -$20,000 / $200,000 ] * 100
Percentage Decrease = -0.10 * 100 = -10%
A 10% drawdown indicates a significant dip in your investment’s value.
Business Cost Reduction
Businesses frequently calculate percentage decreases to identify efficiencies and improve profitability.
-
Operational Cost Savings: A company reduced its monthly utility bill from $1,500 to $1,200 after implementing energy-saving measures.
Percentage Decrease = [ ($1,200 – $1,500) / $1,500 ] * 100
Percentage Decrease = [ -$300 / $1,500 ] * 100
Percentage Decrease = -0.20 * 100 = -20%
A 20% reduction in a recurring cost directly boosts the bottom line.
-
Inventory Shrinkage: If inventory value decreased from $100,000 to $95,000 due to theft or damage.
Percentage Decrease = [ ($95,000 – $100,000) / $100,000 ] * 100
Percentage Decrease = [ -$5,000 / $100,000 ] * 100
Percentage Decrease = -0.05 * 100 = -5%
This 5% shrinkage highlights a potential problem in inventory management or security.
Inflation and Purchasing Power
While not a direct “decrease” of your money, inflation represents a percentage decrease in the purchasing power of money over time. If inflation is 3% annually, your dollar buys 3% less than it did the previous year, effectively a decrease in its real value. This demonstrates the broader application of understanding percentage changes in economic contexts.
Advanced Applications and Common Pitfalls
While the basic formula is simple, real-world financial analysis often involves nuances and potential misinterpretations that require careful attention.
Cumulative Percentage Changes
One of the most common pitfalls is simply adding or subtracting sequential percentage changes. This is incorrect. A 10% increase followed by a 10% decrease does not result in no change.
-
Example: You have $100.
-
10% increase: $100 * (1 + 0.10) = $110
-
Then, a 10% decrease on the new value: $110 * (1 – 0.10) = $110 * 0.90 = $99
Your initial $100 is now $99, a 1% decrease.
To calculate a cumulative change, you must apply each percentage change sequentially to the new base amount, or multiply the decimal equivalents of the changes.
-
Basis Points
For very small percentage changes, particularly in finance (e.g., interest rates, bond yields), “basis points” (bps) are often used. One basis point is equal to 0.01 percentage points, or 1/100th of 1%.
- Example: An interest rate moving from 4.50% to 4.75% is an increase of 0.25 percentage points, or 25 basis points (0.25 * 100 = 25).
Using basis points helps avoid ambiguity when discussing small fractions of percentages.
Year-over-Year vs. Quarter-over-Quarter
When analyzing financial data, it’s crucial to compare consistent periods to draw meaningful conclusions.
-
Year-over-Year (YoY): Compares a period (e.g., current quarter) to the same period in the previous year. This helps smooth out seasonal variations. (e.g., Q1 2024 vs. Q1 2023).
-
Quarter-over-Quarter (QoQ): Compares a quarter to the immediately preceding quarter. This shows more immediate trends but can be heavily influenced by seasonality. (e.g., Q2 2024 vs. Q1 2024).
Always be clear about the comparative periods to avoid misinterpreting trends.
Avoiding Common Mistakes
-
Using the Wrong ‘Old Value’: Always ensure the denominator in your formula is the original or starting value.
-
Confusing Nominal vs. Real Percentage Changes: Nominal changes reflect the raw numbers, while real changes are adjusted for inflation, providing a more accurate picture of purchasing power.
-
Misinterpreting Negative Signs: A negative result from the formula inherently means a decrease. Explicitly stating “a 15% decrease” is often clearer than “negative 15% change.”
Tools and Resources for Calculation
While manual calculation is possible, especially for simpler figures, various tools can streamline the process, reduce errors, and handle more complex datasets.
Spreadsheet Software (Excel/Google Sheets)
Spreadsheets are indispensable for financial calculations. You can easily set up columns for ‘Old Value’ and ‘New Value’ and then apply the percentage change formula using cell references.
- Example Excel formula for percentage change if Old Value is in A2 and New Value is in B2:
=(B2-A2)/A2(then format as percentage).
Financial Calculators
Many online financial calculators and dedicated apps offer percentage change functionality, often simplifying the input process for quick calculations. These are particularly useful for on-the-go analysis.
Business Intelligence Tools
For businesses, sophisticated Business Intelligence (BI) platforms and accounting software often automate percentage change calculations within dashboards and reports. These tools can track key performance indicators (KPIs) over time, providing immediate percentage changes for metrics like revenue growth, expense reduction, and profit shifts.
Conclusion
The ability to calculate increase and decrease percentages is more than just a mathematical trick; it’s a cornerstone of financial literacy and analytical thinking in the realm of money. From managing your personal budget and evaluating investment returns to scrutinizing business performance and understanding broader economic trends like inflation, these calculations provide the essential context needed to transform raw numbers into actionable insights.
By consistently applying the fundamental formula and understanding its nuances, you empower yourself to make more informed decisions, identify opportunities for growth, and strategically navigate challenges. Embrace these calculations as a vital tool in your financial toolkit, and you’ll find yourself better equipped to understand, manage, and ultimately grow your financial well-being.
aViewFromTheCave is a participant in the Amazon Services LLC Associates Program, an affiliate advertising program designed to provide a means for sites to earn advertising fees by advertising and linking to Amazon.com. Amazon, the Amazon logo, AmazonSupply, and the AmazonSupply logo are trademarks of Amazon.com, Inc. or its affiliates. As an Amazon Associate we earn affiliate commissions from qualifying purchases.