
Understanding the pulse of the economy is paramount for sound financial decision-making, whether you’re managing personal finances, steering a business, or making investment choices. At the heart of this understanding lie two critical economic indicators: the Consumer Price Index (CPI) and the inflation rate. These metrics provide a vital snapshot of the cost of living and the purchasing power of money, directly influencing everything from your daily budget to long-term financial planning.
The CPI acts as a barometer for price changes, tracking the average shifts in what urban consumers pay for a typical basket of goods and services. The inflation rate, derived from the CPI, then quantifies how quickly those prices are rising, signaling the erosion of money’s value over time. For individuals, these figures dictate how far their paycheck stretches; for businesses, they inform pricing strategies and wage adjustments; and for investors, they guide portfolio protection strategies. This comprehensive guide will demystify the CPI and inflation rate, explaining their components, calculation methods, and profound implications for your financial life.

Demystifying the Consumer Price Index (CPI)
The Consumer Price Index (CPI) is not just another acronym; it’s a foundational economic indicator that gauges the average change over time in the prices paid by urban consumers for a market basket of consumer goods and services. It serves as a critical measure of the cost of living, providing insight into the economic pressure faced by households and businesses alike.
What is CPI?
At its core, the CPI is a statistical estimate constructed by taking price surveys of thousands of items across various categories. It’s designed to measure the impact of price changes on the average urban household, reflecting how much more or less money consumers need to maintain the same standard of living. Governments and central banks closely monitor the CPI as it informs monetary policy, social security adjustments, wage negotiations, and various contractual agreements. A rising CPI generally signifies an increase in the cost of living, while a falling CPI (deflation) indicates declining prices.
Components of the CPI Basket
To accurately represent the spending habits of consumers, the CPI is constructed around a “market basket” of goods and services. This basket is meticulously curated and weighted to reflect the typical expenditures of urban households. Key categories within this basket include:
- Food and Beverages: Groceries, restaurant meals, and non-alcoholic beverages.
- Housing: Rent of primary residence, owners’ equivalent rent, fuels and utilities, and household furnishings. This is often the largest component.
- Apparel: Clothing and footwear.
- Transportation: New and used vehicles, motor fuel, public transportation.
- Medical Care: Professional services, hospital services, and prescription drugs.
- Recreation: Entertainment, hobbies, and reading materials.
- Education and Communication: Tuition, school books, and communication services (e.g., telephone, internet).
- Other Goods and Services: Personal care products, tobacco, and miscellaneous services.
The relative importance or “weight” of each category within the CPI basket is determined by extensive consumer expenditure surveys. For instance, if housing constitutes 40% of an average household’s budget, price changes in housing will have a much greater impact on the overall CPI than changes in the price of apparel, which might constitute only 3%. These weights are periodically updated to reflect evolving consumer spending patterns, ensuring the CPI remains relevant.
Who Calculates CPI and How Often?
In the United States, the Consumer Price Index is calculated and published by the Bureau of Labor Statistics (BLS), an agency within the U.S. Department of Labor. The BLS collects price data every month from various retail and service establishments across 75 urban areas throughout the country. Prices are typically collected by personal visits of BLS representatives, telephone calls, and website data collection.
The CPI is typically released on a monthly basis, usually around the middle of the month following the reference period. This frequent release schedule allows policymakers, businesses, and individuals to stay abreast of current price trends and react accordingly. While the headline CPI (all urban consumers) is the most commonly cited figure, the BLS also publishes numerous detailed indexes for specific goods and services, different regions, and various demographic groups, offering a granular view of price dynamics.
Understanding the Inflation Rate
While the CPI provides the raw data on price levels, the inflation rate is the dynamic measure that quantifies the speed at which these prices are changing. It’s a fundamental concept in economics and personal finance, directly impacting the purchasing power of your money and the overall economic landscape.
What is Inflation?
Inflation is defined as the rate at which the general level of prices for goods and services is rising, and, consequently, the purchasing power of currency is falling. When inflation occurs, a unit of currency buys fewer goods and services than it did before. This means that over time, your money becomes less valuable. For example, if the inflation rate is 3% annually, an item that cost $100 today will cost approximately $103 next year, assuming its price rises in line with inflation.
The effects of inflation are pervasive. It erodes the real value of savings, making it more challenging for individuals to accumulate wealth. For businesses, it increases operational costs and complicates long-term planning. For the broader economy, high or unpredictable inflation can destabilize markets, discourage investment, and lead to economic uncertainty.
Types of Inflation
Inflation isn’t a monolithic phenomenon; it can arise from different economic pressures, leading to various classifications:
- Demand-Pull Inflation: This occurs when aggregate demand in an economy outpaces aggregate supply. Essentially, “too much money is chasing too few goods.” This typically happens in a strong economy with high employment and disposable income, where consumers are willing to pay more for goods and services.
- Cost-Push Inflation: This type of inflation results from an increase in the cost of production. When the cost of raw materials, labor, or other inputs rises, businesses pass these increased costs on to consumers in the form of higher prices. Examples include a sharp increase in oil prices or a significant rise in wages across an industry.
- Built-In Inflation: Also known as wage-price spiral inflation, this type is often a consequence of past inflation. As workers and businesses expect prices to rise, workers demand higher wages to maintain their purchasing power, and businesses raise prices to cover increased labor costs. This creates a self-fulfilling prophecy, where expectations of inflation feed into actual inflation.
Why Monitor Inflation?
Monitoring inflation is not merely an academic exercise; it’s a critical aspect of effective financial management and economic governance:
- Central Bank Policy: Central banks (like the Federal Reserve in the U.S.) use inflation data as a primary input for setting monetary policy, particularly interest rates. Raising interest rates can curb inflation by slowing down economic activity, while lowering them can stimulate a sluggish economy.
- Wage Negotiations: Unions and employees use inflation rates to negotiate wage increases, aiming to ensure their real wages (purchasing power) keep pace with the rising cost of living.
- Investment Strategies: Investors closely watch inflation to protect the real value of their portfolios. Certain assets (like real estate, commodities, or inflation-indexed bonds) are considered better hedges against inflation than others (like long-term bonds with fixed interest rates).
- Personal Financial Planning: Understanding inflation helps individuals adjust their budgets, plan for retirement, and determine how much they need to save to maintain their desired lifestyle in the future. It’s crucial for setting realistic financial goals.
The Core Calculation: From CPI to Inflation Rate
The relationship between CPI and the inflation rate is direct and fundamental. The CPI provides the raw material, and the inflation rate is the calculation that reveals the pace of price changes over time. Mastering these calculations is key to deciphering economic reports and making informed financial decisions.
The CPI Formula
Calculating the Consumer Price Index for a given period involves comparing the cost of the standard market basket of goods and services in that period to its cost in a designated “base year.” The base year serves as a benchmark, with its CPI typically set to 100.
The formula for CPI is:
CPI = (Cost of Market Basket in Current Year / Cost of Market Basket in Base Year) * 100
Let’s break down the components:
- Cost of Market Basket in Current Year: This is the total cost of all the goods and services in the standardized basket at current prices.
- Cost of Market Basket in Base Year: This is the total cost of the exact same market basket of goods and services, but priced at the base year’s prices.
- Base Year: The base year is an arbitrarily chosen reference year whose CPI is set to 100. All subsequent CPI calculations are indexed against this base. For example, if the base year is 1982-84, a CPI of 120 in a later year means that prices have risen 20% since 1982-84.
Example:
Imagine a simplified market basket consisting of only bread and milk.
- Base Year (Year 1): Bread costs $2, Milk costs $3. Total basket cost = $2 + $3 = $5. CPI for Year 1 = ($5 / $5) * 100 = 100.
- Current Year (Year 2): Bread costs $2.50, Milk costs $3.50. Total basket cost = $2.50 + $3.50 = $6. CPI for Year 2 = ($6 / $5) * 100 = 120.
This CPI of 120 for Year 2 indicates that the cost of the market basket has increased by 20% since the base year (Year 1).

Calculating the Inflation Rate Using CPI
Once you have CPI figures for two different periods, you can calculate the inflation rate between those periods. The inflation rate is simply the percentage change in the CPI over a specified time frame, commonly calculated year-over-year or month-over-month.
The formula for the inflation rate is:
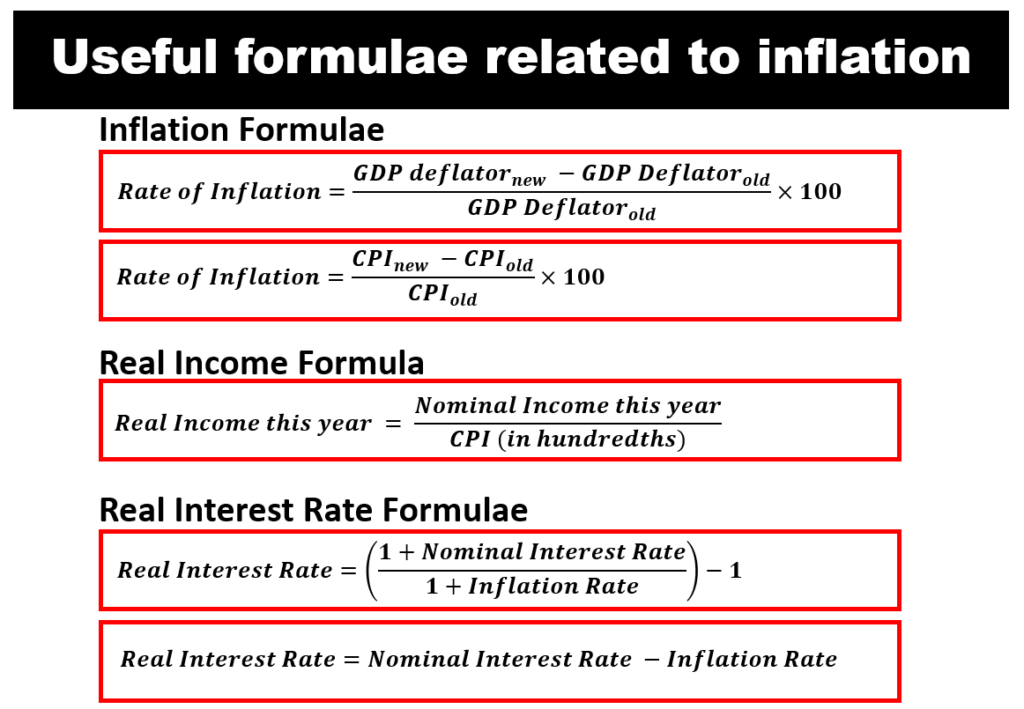
Inflation Rate = ((CPI in Current Period – CPI in Previous Period) / CPI in Previous Period) * 100
Using our previous example with Year 1 (CPI=100) and Year 2 (CPI=120):
Example (Year-over-Year Inflation):
Inflation Rate = ((CPI in Year 2 – CPI in Year 1) / CPI in Year 1) * 100
Inflation Rate = ((120 – 100) / 100) * 100
Inflation Rate = (20 / 100) * 100
Inflation Rate = 0.20 * 100 = 20%
This means that from Year 1 to Year 2, the prices for our simplified market basket increased by 20%.
For real-world calculations, you would use official CPI data released by statistical agencies. For instance, to calculate the inflation rate for October 2023 compared to October 2022, you would take the CPI for October 2023 and the CPI for October 2022, plug them into the formula, and derive the annual inflation rate.
Interpreting the Results
- Positive Inflation Rate: A positive inflation rate, as in our example, indicates that prices have increased. A 20% inflation rate is very high and would signal significant economic concerns, while a 2-3% rate is often considered healthy in developed economies.
- Negative Inflation Rate (Deflation): If the CPI in the current period is lower than in the previous period, the result will be a negative inflation rate, known as deflation. Deflation means prices are generally falling. While falling prices might seem appealing, widespread deflation can be detrimental to an economy, leading to reduced consumer spending (as people delay purchases anticipating further price drops), lower business profits, and increased real debt burdens.
- Understanding the Magnitude: The percentage figure derived is crucial. A small, positive inflation rate (e.g., 2-3%) is often a target for central banks, indicating stable economic growth. High inflation (e.g., double digits) rapidly erodes purchasing power and can destabilize an economy, leading to calls for intervention.
Practical Implications for Your Finances
The ability to calculate and understand CPI and the inflation rate is more than just an academic exercise; it’s a practical skill with profound implications for managing your personal and business finances. These indicators directly influence how you budget, save, invest, and make strategic decisions.
Personal Budgeting and Cost of Living
Inflation is a silent thief of purchasing power. A 3% inflation rate means that what $100 bought you last year will cost approximately $103 this year. This directly impacts your personal budget:
- Eroding Purchasing Power: Your income, if it doesn’t grow at least as fast as inflation, will effectively buy you less over time. This makes it harder to maintain your current lifestyle without adjusting your spending or increasing your income.
- Adjusting Budgets: Understanding inflation allows you to anticipate rising costs for essentials like groceries, housing, and fuel. You can then adjust your budget proactively, either by cutting back on discretionary spending or seeking ways to increase your income.
- Real vs. Nominal Income: It’s vital to distinguish between nominal income (the actual amount of money you earn) and real income (your nominal income adjusted for inflation). A raise might look good on paper, but if inflation outpaces it, your real income has actually decreased.
Investing and Saving Strategies
Inflation is a significant risk to your savings and investments, especially over the long term. A dollar saved today that earns 1% interest will be worth less in real terms if inflation is 3%.
- Protecting Wealth: Investors must actively seek strategies to protect their wealth against inflation. This might involve investing in assets historically known to perform well during inflationary periods, such as:
- Inflation-Indexed Bonds: Like Treasury Inflation-Protected Securities (TIPS) in the U.S., which adjust their principal value with inflation.
- Real Estate: Property values and rental income often rise with inflation.
- Commodities: Raw materials like gold, oil, and agricultural products can hedge against inflation.
- Stocks (Equities): Companies that can pass on rising costs to consumers or have strong pricing power can sometimes outperform during inflation, though overall stock market performance can be mixed.
- The “Real” Return: When evaluating investments, always consider the “real” rate of return, which is the nominal return minus the inflation rate. A bond yielding 5% with 3% inflation only provides a 2% real return.
- Retirement Planning: Inflation is particularly critical for retirement planning. The cost of living in retirement can be significantly higher than expected if inflation isn’t factored in. Financial planners use inflation assumptions to project future expenses and determine how much you need to save to ensure a comfortable retirement.
Business Decisions and Financial Planning
Businesses are profoundly affected by CPI and inflation, influencing everything from daily operations to long-term strategic planning.
- Pricing Strategies: Businesses must continually monitor inflation to adjust their pricing. Raising prices too slowly can erode profit margins, while raising them too quickly can alienate customers.
- Wage Adjustments: To retain talent and maintain employee morale, businesses often need to provide wage increases that at least keep pace with the cost of living. Inflation data informs these decisions.
- Forecasting Costs and Revenues: Inflation significantly impacts input costs (raw materials, energy, labor) and can affect consumer demand. Accurate inflation forecasts are essential for realistic budgeting and revenue projections.
- Impact on Debt and Interest Rates: Inflation can influence borrowing costs. Central banks may raise interest rates to combat inflation, making loans more expensive for businesses seeking capital for expansion or operations. Conversely, inflation can erode the real value of fixed-rate debt, benefiting debtors.
Limitations and Nuances of CPI and Inflation Data
While the CPI and inflation rate are indispensable tools, it’s crucial to acknowledge their limitations and the nuances in their construction and interpretation. These factors can sometimes lead to a perception that the official figures don’t perfectly align with an individual’s personal experience of price changes.
Substitution Bias
One of the challenges in calculating a truly representative CPI is substitution bias. When the price of a particular good or service rises significantly, consumers often substitute it with a cheaper alternative. For example, if the price of beef skyrockets, consumers might opt for chicken or pork instead. The fixed market basket used in CPI calculation, however, may not immediately reflect these substitutions. If the CPI basket assumes consumers are still buying the same quantity of beef at the higher price, it might overstate the true increase in the cost of living, as consumers are, in reality, adapting their purchasing habits to mitigate the impact of the price hike. Statistical agencies attempt to mitigate this by periodically updating the basket weights.
Quality Bias
Another significant challenge is quality bias. Over time, many goods and services improve in quality, offering more features, better performance, or enhanced durability. For instance, a smartphone today is vastly more powerful and versatile than a phone from a decade ago, even if its nominal price has remained relatively stable or increased only modestly. Simply comparing the price of a “phone” from one year to the next without accounting for these quality improvements can lead to an overstatement of inflation. If a new car costs more but comes with advanced safety features and better fuel efficiency, some of that price increase is due to improved quality, not just inflation. The BLS uses methods like “hedonic adjustments” to try and account for quality changes, but it’s an inherently complex task.
New Goods Bias
The introduction of entirely new goods into the market also poses a challenge for CPI calculation. When a new product is introduced, its price typically falls over time as production scales up and competition increases. The CPI, which relies on a fixed basket and updates it periodically, may not immediately capture these initial price declines. For example, when smartphones or flat-screen TVs first appeared, they were very expensive. Their rapid adoption and subsequent price drops provided significant value to consumers, but this might not have been fully reflected in the CPI until they became established components of the market basket. This can lead to the CPI potentially overstating the true cost of living increase by not fully incorporating the welfare gains from innovative, initially expensive, goods becoming more affordable.
Different Measures of Inflation
It’s also important to recognize that the CPI is not the only measure of inflation, and different measures serve different purposes:
- Core CPI: This measure excludes volatile food and energy prices from the calculation. Food and energy prices can fluctuate significantly due to supply shocks (e.g., weather events, geopolitical tensions), distorting the underlying trend of inflation. Core CPI is often favored by central bankers to gauge persistent, underlying inflationary pressures.
- Producer Price Index (PPI): The PPI measures the average change over time in the selling prices received by domestic producers for their output. It’s often considered a leading indicator of consumer inflation, as increases in producer prices can eventually be passed on to consumers.
- Personal Consumption Expenditures (PCE) Price Index: This is the preferred inflation measure used by the U.S. Federal Reserve for monetary policy. Unlike the CPI, the PCE index uses a dynamic weighting scheme that allows for consumer substitution among goods and services. It also has broader coverage, including purchases made by non-profit institutions on behalf of households. The PCE tends to show a slightly lower inflation rate than the CPI due to these methodological differences.
Understanding these limitations and alternative measures provides a more complete and nuanced picture of inflation, helping individuals and businesses make more robust financial decisions rather than relying solely on a single headline number.
Conclusion
The Consumer Price Index (CPI) and the inflation rate are more than just abstract economic figures; they are powerful indicators that directly impact the financial health of every individual and business. By understanding how the CPI is constructed from a basket of goods and services, and subsequently how the inflation rate is calculated as the percentage change in that index, you gain invaluable insight into the economic forces shaping your purchasing power.
From personal budgeting and safeguarding your savings against erosion to informing investment strategies and guiding critical business decisions, these metrics are indispensable. While they come with inherent limitations like substitution and quality biases, and various alternative measures exist, the core understanding of CPI and inflation empowers you to navigate the complexities of the financial world with greater confidence. Embracing this financial literacy is not merely about tracking numbers; it’s about proactively planning for a more secure and prosperous future.
aViewFromTheCave is a participant in the Amazon Services LLC Associates Program, an affiliate advertising program designed to provide a means for sites to earn advertising fees by advertising and linking to Amazon.com. Amazon, the Amazon logo, AmazonSupply, and the AmazonSupply logo are trademarks of Amazon.com, Inc. or its affiliates. As an Amazon Associate we earn affiliate commissions from qualifying purchases.