
Understanding the pulse of an economy is crucial for making informed financial decisions, whether you’re managing a household budget, planning investments, or running a business. At the heart of this understanding lie two fundamental economic indicators: the Consumer Price Index (CPI) and the inflation rate. These metrics provide invaluable insights into the purchasing power of money and the overall cost of living. Far from being abstract economic terms, they directly influence your daily expenditures, savings strategies, and future financial security.
The Consumer Price Index (CPI) measures the average change over time in the prices paid by urban consumers for a market basket of consumer goods and services. It serves as a barometer for the cost of living. Building upon the CPI, the inflation rate quantifies the percentage increase in the price level of goods and services over a period, signaling the rate at which purchasing power is eroding. Mastering the calculation and interpretation of these indicators empowers individuals and businesses to navigate economic shifts more effectively, adjust strategies, and protect their financial well-being. This guide will demystify these powerful financial tools, providing a clear, step-by-step approach to their calculation and explaining their profound implications.

Understanding the Consumer Price Index (CPI)
The Consumer Price Index (CPI) is more than just a number; it’s a critical gauge that reflects the economic health and stability affecting every consumer. Compiled and reported by governmental agencies, such as the Bureau of Labor Statistics (BLS) in the United States, the CPI is foundational for tracking changes in the cost of living.
What is CPI? Definition and Purpose
At its core, the CPI is a weighted average of prices of a “basket” of goods and services typically purchased by households. It compares the current cost of this basket to its cost in a predetermined base period. The primary purpose of the CPI is to measure price changes experienced by consumers over time, providing a clear indication of how much more or less money it takes to maintain the same standard of living. For financial planning, it helps individuals understand how their savings’ value might change, and for businesses, it informs pricing strategies and wage adjustments.
Components of the CPI Basket
The “basket” of goods and services used to calculate CPI is incredibly diverse and aims to represent the spending patterns of the average urban consumer. It includes a broad spectrum of categories, each weighted according to its share of typical household spending. Major categories often include:
- Food and Beverages: Groceries, restaurant meals.
- Housing: Rent, owner’s equivalent rent, utilities (electricity, gas, water, refuse services).
- Apparel: Clothing, footwear.
- Transportation: New and used vehicles, gasoline, public transportation fares, car insurance.
- Medical Care: Prescription drugs, medical services, hospital services.
- Recreation: Televisions, sports equipment, pet products, club memberships, admissions.
- Education and Communication: Tuition, school books, computer software, internet services, telephone services.
- Other Goods and Services: Tobacco, personal care products, funeral expenses.
These categories are meticulously tracked, with data collected from thousands of retail stores, service establishments, and rental units across various metropolitan areas. The weights assigned to each category are periodically updated to reflect changes in consumer spending habits, ensuring the CPI remains relevant and accurate.
Why CPI Matters to Your Personal and Business Finances
For individuals, CPI directly impacts purchasing power. A rising CPI means that your money buys less than it did before, eroding the value of savings and potentially necessitating adjustments to budgets and financial goals. It’s a key factor in cost-of-living adjustments (COLAs) for social security benefits and some wages. For investors, understanding CPI helps evaluate real returns on investments (nominal return minus inflation) and informs decisions about asset allocation to protect against inflation.
For businesses, CPI is a vital indicator for strategic planning. It influences pricing decisions, wage negotiations, and budgeting. Businesses must monitor CPI to ensure their pricing remains competitive while covering rising input costs. It can also impact lease agreements and other contracts that are indexed to inflation. Ignoring CPI trends can lead to decreased profitability or a loss of market share.
The Step-by-Step Calculation of CPI
While government agencies employ complex methodologies, the fundamental principles of CPI calculation can be understood and even applied to a personal level to track your own “cost of living.” The process involves selecting a base period, tracking prices, and applying a simple formula.
Step 1: Define Your Basket of Goods and Services
To calculate CPI, you first need to identify a representative set of goods and services that a typical consumer purchases. For a simplified personal CPI, you might list your most significant monthly expenditures.
- Example Basket (Monthly):
- Milk (1 gallon)
- Bread (1 loaf)
- Gasoline (20 gallons)
- Coffee (1 lb)
- Haircut (1)
- Movie Ticket (1)
Step 2: Determine Prices for Each Item in Base Year and Current Year
Next, gather the prices for each item in your basket for a chosen “base year” (an earlier period you want to compare against) and the “current year” (the period you’re calculating the CPI for).
- Example Prices:
- Base Year (e.g., 2020):
- Milk: $3.00
- Bread: $2.50
- Gasoline: $2.50/gallon
- Coffee: $8.00
- Haircut: $20.00
- Movie Ticket: $10.00
- Current Year (e.g., 2023):
- Milk: $3.50
- Bread: $3.00
- Gasoline: $3.50/gallon
- Coffee: $10.00
- Haircut: $25.00
- Movie Ticket: $12.00
- Base Year (e.g., 2020):
Step 3: Calculate the Cost of the Basket in Each Year
Multiply the quantity of each item by its price for both the base year and the current year, then sum these costs to find the total cost of the basket for each year.
-
Cost of Basket in Base Year (2020):
- Milk: 1 * $3.00 = $3.00
- Bread: 1 * $2.50 = $2.50
- Gasoline: 20 * $2.50 = $50.00
- Coffee: 1 * $8.00 = $8.00
- Haircut: 1 * $20.00 = $20.00
- Movie Ticket: 1 * $10.00 = $10.00
- Total Base Year Cost = $93.50
-
Cost of Basket in Current Year (2023):
- Milk: 1 * $3.50 = $3.50
- Bread: 1 * $3.00 = $3.00
- Gasoline: 20 * $3.50 = $70.00
- Coffee: 1 * $10.00 = $10.00
- Haircut: 1 * $25.00 = $25.00
- Movie Ticket: 1 * $12.00 = $12.00
- Total Current Year Cost = $123.50
Step 4: Choose a Base Year and Calculate the Index
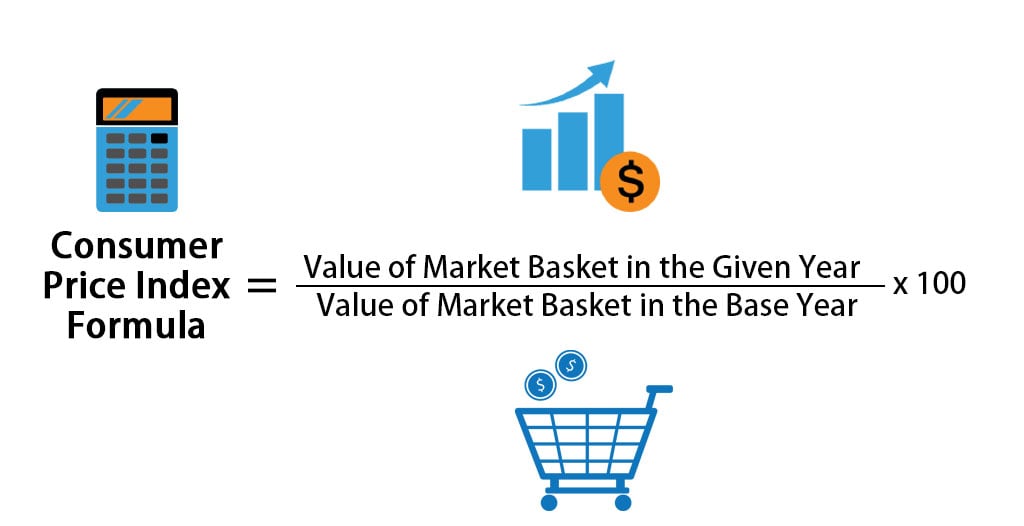
The CPI for the base year is always set to 100. For any other year, the CPI is calculated using the following formula:
CPI = (Cost of Basket in Current Year / Cost of Basket in Base Year) * 100
- CPI for Base Year (2020): ($93.50 / $93.50) * 100 = 100
- CPI for Current Year (2023): ($123.50 / $93.50) * 100 ≈ 132.09
This means that what cost $100 in 2020 now costs approximately $132.09 in 2023.
Unraveling the Inflation Rate
Once you have calculated the CPI for multiple periods, you can then determine the inflation rate, which quantifies the rate at which the general level of prices for goods and services is rising, and consequently, the purchasing power of currency is falling.
What is Inflation? Definition and Effects
Inflation is the sustained increase in the general price level of goods and services in an economy over a period of time. When the price level rises, each unit of currency buys fewer goods and services; consequently, inflation reflects a reduction in the purchasing power per unit of money – a loss of real value in the medium of exchange and unit of account within the economy. Its effects range from eroding the value of savings and fixed incomes to influencing interest rates and investment decisions.
The Inflation Rate Formula
The most common way to calculate the inflation rate is to use the CPI from two different periods, typically consecutive years or months.
Inflation Rate = ((CPI in Current Period – CPI in Previous Period) / CPI in Previous Period) * 100
Calculating Annual Inflation
Using our example CPI figures:
- CPI in Previous Period (2020) = 100
- CPI in Current Period (2023) = 132.09
Inflation Rate (2020 to 2023) = ((132.09 – 100) / 100) * 100 = (32.09 / 100) * 100 = 32.09%
This indicates an average annual inflation rate of approximately 10.7% over the three years (32.09% / 3 years), although it’s usually calculated year-over-year. If we had the CPI for 2022, we could calculate the exact annual rate for 2023. For instance, if CPI in 2022 was 120:
Annual Inflation Rate (2022 to 2023) = ((132.09 – 120) / 120) * 100 = (12.09 / 120) * 100 ≈ 10.08%
This percentage tells you how much more expensive the basket of goods and services has become compared to the previous period.
Broader Implications and Limitations of CPI & Inflation
While CPI and inflation rate are indispensable financial tools, it’s crucial to understand their wider implications for your finances and the economy, as well as their inherent limitations.
Impact on Personal Finance
For personal finance, inflation acts like a hidden tax, eroding the value of your cash savings and fixed-income investments. If your savings account yields 1% interest and inflation is 5%, your real return is -4%, meaning your money is losing purchasing power. This highlights the importance of investing in assets that can outpace inflation. Budgeting also becomes critical; as prices rise, you may need to adjust your spending habits or seek higher income to maintain your lifestyle. Understanding inflation empowers individuals to negotiate salaries, plan for retirement, and make smarter decisions about borrowing and lending.
Impact on Business Finance
Businesses are profoundly affected by inflation. Rising input costs (raw materials, labor, energy) can squeeze profit margins, forcing companies to decide whether to absorb these costs or pass them on to consumers through higher prices. This can be a delicate balance, as raising prices too much could lead to a loss of customers. Inflation also impacts investment decisions, as future cash flows need to be discounted at a higher rate. Moreover, businesses must consider inflation when planning long-term projects, valuing assets, and managing inventory. Stable inflation allows for predictable planning, while volatile inflation creates significant uncertainty and risk.
Limitations and Criticisms of CPI
Despite its widespread use, the CPI has several recognized limitations:
- Substitution Bias: The fixed basket of goods does not account for consumers’ ability to substitute cheaper goods for more expensive ones when prices rise. For example, if beef prices surge, consumers might buy more chicken. The CPI might overstate the true cost of living increase because it assumes consumers continue buying the same amount of beef.
- Quality Bias: Over time, goods and services improve in quality (e.g., computers become faster, cars safer). A higher price might reflect improved quality rather than pure inflation. The BLS attempts to adjust for quality changes, but it’s a complex task.
- New Goods Bias: New products are not immediately included in the CPI basket and only become part of it after a delay. This can cause the CPI to miss price decreases or utility increases that new technologies often bring.
- Regional Differences: The national CPI might not accurately reflect the cost of living in specific regions or cities, which can have significantly different price levels and consumption patterns.
Leveraging Financial Tools for Monitoring
In today’s digital age, monitoring CPI and inflation is easier than ever, with various financial tools and resources available to help you stay informed and make proactive financial decisions.
Government Resources and Data Portals
The primary source for official CPI and inflation data is government statistical agencies. In the U.S., the Bureau of Labor Statistics (BLS) provides detailed reports, data series, and explanations through its website (www.bls.gov). Similar agencies exist in other countries (e.g., Eurostat for the EU, Office for National Statistics for the UK). These portals offer historical data, regional breakdowns, and analyses that are invaluable for in-depth understanding. Central banks, like the Federal Reserve, also publish economic reports that include inflation analyses.
Personal Finance Apps and Software
Many modern personal finance apps and software solutions integrate economic data, offering a holistic view of your financial health. While they may not calculate CPI for you directly, they can help you track your spending patterns, which is the first step in creating a personal basket of goods. Investment platforms often provide dashboards that show current inflation rates and how they might impact your portfolio, allowing you to make informed adjustments. Budgeting tools can help you visualize how rising costs affect your disposable income, prompting you to re-evaluate your spending categories.
Spreadsheets for Custom Tracking and Analysis
For those who prefer a hands-on approach, spreadsheets like Microsoft Excel or Google Sheets are powerful tools for creating your own personalized CPI and inflation trackers. By meticulously logging prices for your chosen basket of goods over time, you can construct a highly relevant personal CPI. This allows for customized analysis, helping you understand how inflation specifically affects your household or business, rather than relying solely on generalized national averages. Advanced users can even build models to project future inflation rates based on various economic inputs.

Conclusion
The Consumer Price Index and inflation rate are far more than just abstract economic figures; they are direct reflections of your purchasing power and the cost of living. Mastering their calculation and understanding their implications is an indispensable skill for anyone aiming for financial stability and growth. From managing your household budget and planning for retirement to setting business prices and negotiating wages, these metrics play a pivotal role.
By utilizing government data, leveraging personal finance tools, and even creating your own custom trackers, you empower yourself to navigate the dynamic economic landscape with confidence. A proactive approach to monitoring CPI and inflation allows you to anticipate challenges, adjust your strategies, and ultimately protect and enhance your financial well-being in an ever-changing world. Don’t let these crucial indicators remain mysteries; embrace them as powerful allies in your financial journey.
aViewFromTheCave is a participant in the Amazon Services LLC Associates Program, an affiliate advertising program designed to provide a means for sites to earn advertising fees by advertising and linking to Amazon.com. Amazon, the Amazon logo, AmazonSupply, and the AmazonSupply logo are trademarks of Amazon.com, Inc. or its affiliates. As an Amazon Associate we earn affiliate commissions from qualifying purchases.