
In the complex world of finance, discerning genuine investment skill from mere market exposure is paramount. Investors, fund managers, and financial analysts constantly seek metrics that cut through the noise, providing a clearer picture of an asset’s or portfolio’s true performance. Among these, Alpha stands out as a critical indicator, often referred to as the “active return” or “excess return.” It quantifies the performance of an investment compared to a suitable market benchmark, taking into account the risk involved. Understanding how to calculate Alpha is not just an academic exercise; it’s a vital skill for anyone looking to make informed financial decisions, evaluate fund managers, or assess the efficacy of their own investment strategies. This comprehensive guide will demystify Alpha, break down its calculation, and explore its profound implications for investors.

Understanding Alpha: Beyond Market Returns
To appreciate the significance of Alpha, one must first grasp its core concept and how it distinguishes itself from other performance measures. It moves beyond simply reporting returns and delves into the source of those returns.
What is Alpha?
At its heart, Alpha represents the portion of an investment’s return that cannot be attributed to the broader market’s movements. In simpler terms, it’s the extra return an investor receives for taking on specific risks, or more favorably, due to the skill of the portfolio manager. A positive Alpha indicates that the investment has outperformed its benchmark after accounting for the risk taken, suggesting that the manager added value through their security selection, market timing, or other active strategies. Conversely, a negative Alpha implies underperformance relative to the benchmark, suggesting that the manager failed to generate returns commensurate with the risk assumed, or even destroyed value. An Alpha of zero suggests the investment performed exactly as expected given its market risk, implying no unique skill or disadvantage.
Why Alpha Matters to Investors
For individual investors and institutional clients alike, Alpha is a cornerstone metric for several reasons. Firstly, it provides a crucial benchmark for evaluating the effectiveness of active management. Many investors pay higher fees for actively managed funds, with the expectation that these managers will generate Alpha. If a fund consistently exhibits a negative or zero Alpha, despite higher fees, it raises questions about the value proposition of that active management. Secondly, Alpha helps in making informed asset allocation decisions. By identifying investments or managers that consistently deliver positive Alpha, investors can strategically allocate capital to those sources of outperformance. Thirdly, it fosters a deeper understanding of risk-adjusted returns. While a high return might seem attractive, Alpha helps contextualize that return against the risk profile, preventing investors from chasing high-return, high-volatility assets blindly. It separates the “luck” of being in a rising market from genuine skill.
Alpha vs. Beta: Differentiating Risk and Skill
Alpha and Beta are two sides of the same coin when it comes to measuring investment performance and risk, but they represent fundamentally different aspects. Beta (β) measures the sensitivity of an investment’s returns to movements in the overall market. A Beta of 1 indicates that the investment’s price will move with the market. A Beta greater than 1 suggests higher volatility and sensitivity to market movements (e.g., if the market rises 1%, the asset might rise 1.2%). A Beta less than 1 implies lower volatility than the market. Beta explains the portion of an asset’s return that is attributable to systemic market risk.
Alpha, on the other hand, measures the residual return once the impact of market movements (as captured by Beta) has been stripped away. While Beta tells you how much market risk an investment has, Alpha tells you how well the investment performed given that market risk. An investment with a high Beta might generate high returns in a bull market, but if its Alpha is zero, it merely performed as expected given its market exposure, not due to any unique skill. Investors ideally seek investments with high positive Alpha, regardless of their Beta, as this signifies genuine value creation.
The Core Formula: Deconstructing Alpha Calculation
Calculating Alpha requires understanding a few key components and their relationship within the established formula. The most common method for calculating Alpha is derived from the Capital Asset Pricing Model (CAPM).
The Alpha Formula Explained
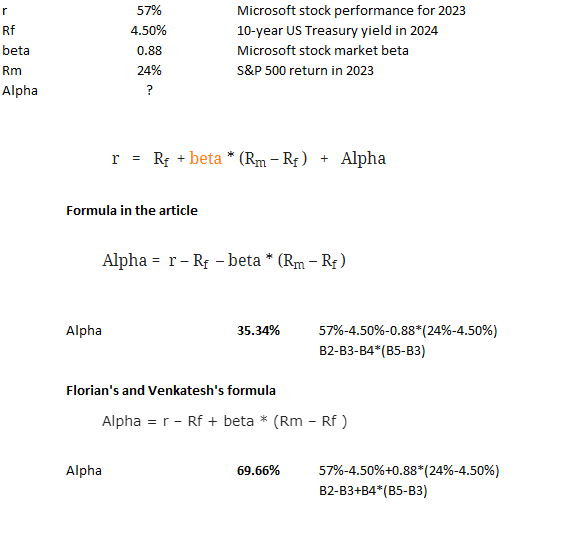
The standard formula for Alpha, often referred to as Jensen’s Alpha, is:
Alpha = Portfolio Return – [Risk-Free Rate + Beta * (Market Return – Risk-Free Rate)]
Let’s break down each element of this equation to understand its role.
Key Components: Portfolio Return, Benchmark Return, Risk-Free Rate, and Beta
-
Portfolio Return (Rp): This is the actual return generated by the investment or portfolio over a specific period (e.g., monthly, quarterly, annually). It includes capital gains and any income (dividends, interest). It’s crucial to calculate this accurately, typically as the percentage change in value from the start to the end of the period, plus any distributions.
-
Market Return (Rm): This is the return of a chosen market benchmark index over the same period. The selection of the benchmark is critical. It should accurately represent the market segment or asset class the portfolio is invested in. For example, for a U.S. large-cap equity portfolio, the S&P 500 might be an appropriate benchmark. For a global diversified portfolio, a global equity index might be better.
-
Risk-Free Rate (Rf): This is the theoretical return of an investment with zero risk. In practice, this is typically approximated by the yield on short-term government securities, such as U.S. Treasury Bills (e.g., 3-month or 6-month T-bills), which are considered to have negligible default risk. The risk-free rate accounts for the time value of money—the return an investor could expect without taking on any market risk.
-
Beta (β): As discussed, Beta measures the sensitivity of the portfolio’s returns to the market’s returns. It’s a measure of systemic risk. Beta can be calculated by regressing the portfolio’s historical returns against the market’s historical returns. A Beta of 1 means the portfolio moves in lockstep with the market; a Beta greater than 1 implies more volatility; a Beta less than 1 implies less volatility.
Step-by-Step Calculation Walkthrough
Let’s walk through an example to illustrate the calculation of Alpha:
Scenario:
- An investment fund generated an annual return of 15%.
- The chosen market benchmark (e.g., S&P 500) returned 10% over the same year.
- The annual risk-free rate was 3%.
- The fund’s Beta relative to the S&P 500 is 1.2.
Steps:
-
Identify Portfolio Return (Rp): Rp = 0.15 (15%)
-
Identify Market Return (Rm): Rm = 0.10 (10%)
-
Identify Risk-Free Rate (Rf): Rf = 0.03 (3%)
-
Identify Beta (β): β = 1.2
-
Calculate the Excess Market Return (Market Risk Premium):
(Market Return – Risk-Free Rate) = (Rm – Rf) = (0.10 – 0.03) = 0.07 (7%) -
Calculate the Expected Return based on CAPM:
Expected Return = Risk-Free Rate + Beta * (Market Return – Risk-Free Rate)
Expected Return = 0.03 + 1.2 * (0.07)
Expected Return = 0.03 + 0.084
Expected Return = 0.114 (11.4%)This step tells us that, given the fund’s Beta and the market conditions, it was expected to return 11.4%.
-
Calculate Alpha:
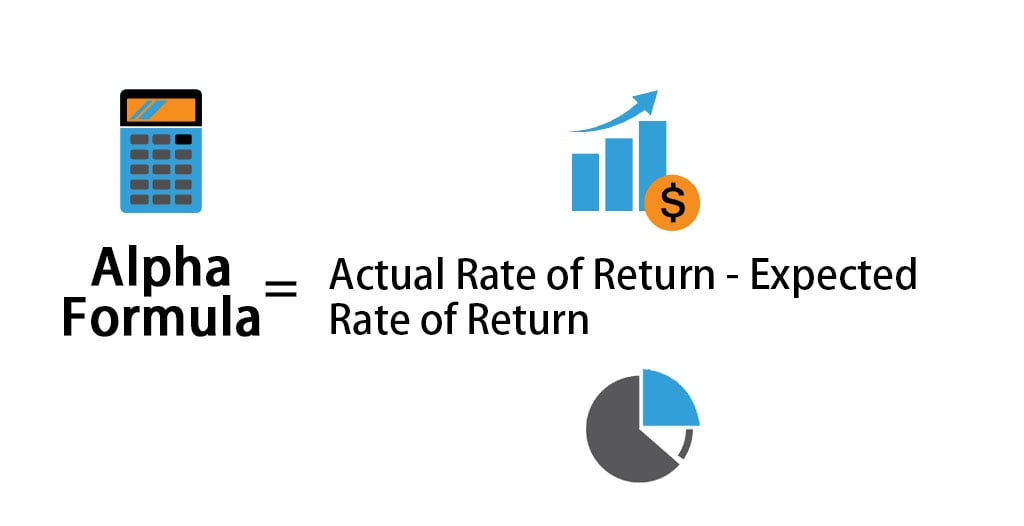
Alpha = Portfolio Return – Expected Return
Alpha = 0.15 – 0.114
Alpha = 0.036 or 3.6%
In this example, the fund delivered an Alpha of 3.6%. This positive Alpha suggests that the fund manager added 3.6% of value beyond what would be expected given the market’s performance and the fund’s level of systematic risk.
Practical Application and Interpretation of Alpha
Once calculated, Alpha is not merely a number; it’s a powerful insight that guides investment decisions and performance evaluations.
Interpreting Alpha Values: Positive, Negative, and Zero
-
Positive Alpha (Alpha > 0): This is the Holy Grail for active managers. A positive Alpha signifies that the investment or portfolio has outperformed its benchmark on a risk-adjusted basis. It suggests that the manager’s skill in security selection, market timing, or other active strategies has generated excess returns beyond what the market would typically provide for that level of risk. Investors actively seek managers who consistently generate positive Alpha.
-
Negative Alpha (Alpha < 0): A negative Alpha indicates underperformance. The investment failed to generate returns commensurate with its market risk, or even performed worse than a passive index with similar risk. This could be due to poor security selection, excessive transaction costs, high management fees eating into returns, or an inability to adapt to market conditions. Consistent negative Alpha is a red flag for active management and suggests that investors might be better off in a low-cost index fund.
-
Zero Alpha (Alpha ≈ 0): An Alpha close to zero suggests that the investment performed exactly as expected given its market risk. The manager neither added nor subtracted value. In essence, the returns could have been achieved by simply investing in a passive index fund with a similar Beta, likely at a lower cost. For investors, a zero Alpha implies that the active management fees might not be justified.
Real-World Scenarios and Examples
Consider two mutual funds, Fund A and Fund B, both investing in U.S. large-cap equities.
-
Fund A: Reports an annual return of 18%, with a Beta of 1.1. Market Return is 12%, Risk-Free Rate is 2%.
Expected Return = 0.02 + 1.1 * (0.12 – 0.02) = 0.02 + 1.1 * 0.10 = 0.02 + 0.11 = 0.13 (13%)
Alpha (Fund A) = 0.18 – 0.13 = 0.05 (5%). Fund A’s manager generated significant positive Alpha. -
Fund B: Reports an annual return of 15%, with a Beta of 1.3. Market Return is 12%, Risk-Free Rate is 2%.
Expected Return = 0.02 + 1.3 * (0.12 – 0.02) = 0.02 + 1.3 * 0.10 = 0.02 + 0.13 = 0.15 (15%)
Alpha (Fund B) = 0.15 – 0.15 = 0 (0%). Despite a high return, Fund B merely met expectations given its higher risk exposure; its manager generated no Alpha.
These examples clearly demonstrate how Alpha provides a nuanced view beyond just raw returns. Fund A, while potentially having a lower raw return than other high-Beta funds in a bull market, shows genuine skill. Fund B, despite a respectable 15% return, offered no discernible active management advantage.
Leveraging Alpha for Investment Decisions
Investors can use Alpha in several ways:
- Fund Manager Evaluation: It’s a primary tool for assessing whether an actively managed fund justifies its fees. Consistent positive Alpha over several periods is a strong indicator of skilled management.
- Portfolio Construction: Incorporating investments with a track record of positive Alpha can potentially enhance overall portfolio returns.
- Strategy Refinement: For individual investors managing their own portfolios, calculating Alpha can help validate or revise their investment strategies. If your Alpha is consistently negative, it’s a sign to re-evaluate your approach.
- Due Diligence: When considering new investments, Alpha helps to separate genuine value propositions from those simply riding market waves.
Challenges and Nuances in Alpha Analysis
While immensely valuable, Alpha is not without its limitations and complexities. A nuanced understanding of these challenges is crucial for its proper application.
Limitations of Alpha as a Performance Metric
- Dependence on Benchmark Selection: The choice of benchmark is critical. An inappropriate benchmark can distort Alpha results, making a manager appear skilled or unskilled when the reality is different. A manager focused on small-cap value stocks should not be benchmarked against the S&P 500 (large-cap growth bias).
- Reliance on Historical Data: Alpha is calculated using historical returns and Beta. Past performance is not indicative of future results, and historical Beta may not accurately predict future risk sensitivity.
- Single-Factor Model (CAPM): Jensen’s Alpha is derived from the CAPM, which is a single-factor model (market risk is the only factor). More sophisticated multi-factor models (e.g., Fama-French Three-Factor Model) suggest that other factors like size and value also explain returns. Alpha derived from these models might offer a more refined perspective.
- Statistical Significance: A positive Alpha needs to be statistically significant. A small positive Alpha might just be random chance, especially over short periods. Longer time horizons and statistical tests are needed to confirm persistent Alpha.
- Timing of Calculation: Alpha can vary significantly depending on the time period chosen for its calculation. Market cycles, economic conditions, and manager strategy shifts can all impact short-term Alpha.
The Impact of Benchmarking and Data Quality
The quality and relevance of the benchmark are paramount. If a manager invests heavily in emerging markets but is benchmarked against a developed market index, their Alpha could be misleadingly high or low. Similarly, inaccurate or incomplete data for portfolio returns, market returns, or the risk-free rate will compromise the Alpha calculation’s integrity. Ensuring consistent data sources and methodologies across the board is essential. Regular re-evaluation of the benchmark’s appropriateness is also a best practice.
Adapting Alpha for Different Investment Strategies
While the core Alpha formula remains consistent, its interpretation and the factors considered can adapt for different strategies:
- Hedge Funds: For hedge funds that employ complex strategies (e.g., long/short, market neutral), a simple market index might not be an adequate benchmark. Custom benchmarks or multi-factor models might be more appropriate.
- Private Equity: Given the illiquidity and long-term nature of private equity investments, traditional Alpha calculations are challenging. Alternative methods like Public Market Equivalent (PME) are often used to compare private equity returns to public markets.
- Fixed Income: For fixed-income portfolios, the benchmark might be a bond index, and Beta would measure sensitivity to interest rate changes rather than equity market movements.
Tools and Resources for Alpha Calculation
Fortunately, investors don’t always need to perform complex manual calculations. Various tools and platforms simplify the process.
Spreadsheet Software for Manual Calculation
For individual investors or smaller portfolios, spreadsheet software like Microsoft Excel or Google Sheets is perfectly adequate. You can input historical monthly or quarterly returns for your portfolio, a chosen benchmark, and the risk-free rate, then use built-in functions (e.g., SLOPE for Beta, simple arithmetic for the rest of the formula) to derive Alpha. This method offers transparency and control, allowing users to select their own benchmarks and time periods. Many online tutorials and templates are available to guide this process.
Financial Data Platforms and Analytics Tools
Professional investors and financial institutions leverage specialized financial data platforms. Services like Bloomberg Terminal, Refinitiv Eikon, S&P Capital IQ, and FactSet provide comprehensive historical data for securities, indices, and risk-free rates. These platforms also offer advanced analytics tools that can automatically calculate Alpha (often Jensen’s Alpha and others derived from multi-factor models), Beta, Sharpe Ratio, Sortino Ratio, and other performance metrics, often with visual dashboards and reporting capabilities. These tools significantly reduce manual effort and enhance the accuracy and depth of analysis.
Professional Investment Software
Beyond data platforms, dedicated investment management software and portfolio analysis tools often include robust Alpha calculation capabilities. These solutions are designed for portfolio managers, wealth advisors, and institutional investors, offering features like:
- Automated data feeds: Seamlessly integrating market data and portfolio holdings.
- Customizable benchmarks: Allowing users to define specific benchmarks for unique strategies.
- Scenario analysis: Testing Alpha under different market conditions.
- Performance attribution: Breaking down returns into components (e.g., market, sector, security selection) to better understand the sources of Alpha.
- Reporting: Generating professional-grade reports for clients and internal stakeholders.
Examples include BlackRock Aladdin, SimCorp Dimension, and various specialist portfolio analytics systems. These tools empower investors to not only calculate Alpha efficiently but also to deeply analyze its drivers and implications for portfolio management.
In conclusion, Alpha is more than just a metric; it’s a window into the true efficacy of an investment or an investment manager’s skill. By mastering its calculation and interpretation, investors can move beyond raw returns, make more informed decisions, and better navigate the complex journey of wealth creation. While its calculation requires attention to detail and a clear understanding of its components, the insights it provides are invaluable for any serious participant in the financial markets.
aViewFromTheCave is a participant in the Amazon Services LLC Associates Program, an affiliate advertising program designed to provide a means for sites to earn advertising fees by advertising and linking to Amazon.com. Amazon, the Amazon logo, AmazonSupply, and the AmazonSupply logo are trademarks of Amazon.com, Inc. or its affiliates. As an Amazon Associate we earn affiliate commissions from qualifying purchases.