In the dynamic world of finance, understanding how to quantify changes is paramount. Whether you’re managing personal investments, analyzing business performance, or tracking economic trends, the ability to accurately calculate a percentage decrease provides invaluable insight. It allows us to measure decline, assess losses, identify areas for improvement, and make informed decisions. Far from being a mere mathematical exercise, this calculation is a fundamental tool in the arsenal of anyone navigating financial landscapes, revealing the magnitude of shrinkage, depreciation, or reduction in a standardized, comparable format. This comprehensive guide will demystify the process, offering practical applications and critical insights specifically tailored for financial contexts.

Understanding the Concept: What is a Percentage Decrease?
At its core, a percentage decrease represents the relative reduction between an initial value and a final, smaller value, expressed as a fraction of the initial value, multiplied by 100. It quantifies how much something has gone down compared to where it started. Unlike an absolute decrease, which merely tells you the raw number difference, a percentage decrease provides context and comparability. For instance, a $100 decrease might be significant for an item worth $200 (50% decrease) but negligible for an item worth $10,000 (1% decrease).
The Core Idea in Financial Contexts
In finance, the application of percentage decrease is pervasive. It’s used to:
- Track Investment Performance: Measuring the decline in stock value, mutual fund returns, or portfolio worth.
- Monitor Business Metrics: Analyzing drops in revenue, profit margins, sales figures, or customer acquisition costs.
- Evaluate Personal Finances: Assessing budget overruns, decreases in savings, or reductions in income.
- Understand Economic Indicators: Observing declines in GDP, inflation rates, employment figures, or market indices.
The power of a percentage decrease lies in its ability to normalize changes, making it possible to compare the impact of different events or trends across varying scales. A 10% drop in revenue is a standardized metric, interpretable regardless of whether the business is a small startup or a multinational corporation.
Why It Matters: Identifying Trends and Impact
Calculating percentage decrease isn’t just about identifying a reduction; it’s about understanding the “why” and “what next.” A consistent percentage decrease in a particular metric can signal a problem that requires immediate attention, or conversely, a positive outcome (e.g., a percentage decrease in expenses).
For investors, a significant percentage decrease in a stock’s price might trigger a re-evaluation of its potential or prompt a stop-loss action. For businesses, a drop in quarterly profit margin might initiate an investigation into operational inefficiencies or market shifts. In personal finance, a noticeable percentage decrease in monthly savings could necessitate a review of spending habits. By providing a clear, relative measure, percentage decrease empowers individuals and organizations to spot critical trends, gauge the severity of financial events, and formulate appropriate strategies. It’s the numerical foundation for proactive financial management and strategic planning.
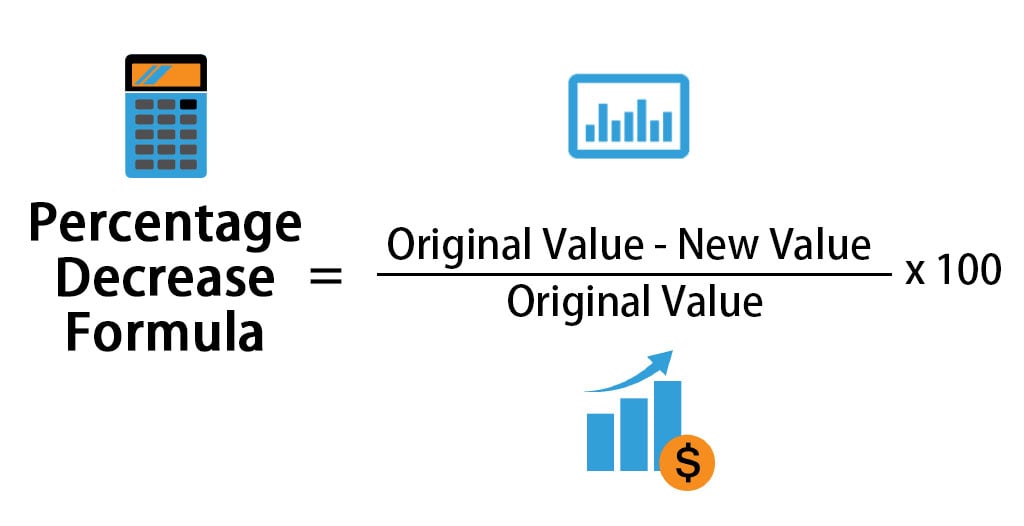
The Fundamental Formula for Financial Analysis
Calculating a percentage decrease involves a straightforward three-step process that can be applied across all financial scenarios. Mastering this formula is crucial for accurate financial assessment and decision-making.
The basic formula is:
$$ text{Percentage Decrease} = left( frac{text{Initial Value} – text{Final Value}}{text{Initial Value}} right) times 100 $$
Let’s break down the components and demonstrate with practical financial examples.
Step-by-Step Calculation for Money Matters
-
Determine the Initial Value: This is the starting point, the original amount, or the baseline figure before any decrease occurred. In financial terms, this could be your initial investment, last quarter’s revenue, your original budget, or last year’s stock price.
-
Determine the Final Value: This is the ending point, the amount after the decrease has taken place. This could be your current investment value, this quarter’s revenue, your actual spending, or today’s stock price. It’s crucial that the final value is less than the initial value for a percentage decrease to exist.
-
Calculate the Absolute Decrease: Subtract the Final Value from the Initial Value. This gives you the raw numerical difference of how much the value has dropped.
$$ text{Absolute Decrease} = text{Initial Value} – text{Final Value} $$ -
Divide by the Initial Value: Take the Absolute Decrease and divide it by the Initial Value. This step determines the proportion of the decrease relative to the starting point. The result will be a decimal.
$$ text{Proportion} = frac{text{Absolute Decrease}}{text{Initial Value}} $$ -
Multiply by 100: Convert the decimal proportion into a percentage by multiplying it by 100.
$$ text{Percentage Decrease} = text{Proportion} times 100 $$
Practical Examples: Personal Finance Scenarios
Let’s apply this to everyday personal finance situations:
Example 1: Decrease in Savings
- Scenario: You started the month with $2,500 in your savings account. By the end of the month, due to an unexpected expense, your savings dropped to $2,200.
- Initial Value: $2,500
- Final Value: $2,200
- Absolute Decrease: $2,500 – $2,200 = $300
- Proportion: $300 / $2,500 = 0.12
- Percentage Decrease: $0.12 times 100 = text{12%}$
- Insight: Your savings decreased by 12% over the month, prompting a review of the unexpected expense or future budgeting.
Example 2: Investment Portfolio Decline
- Scenario: Your investment portfolio was worth $50,000 at the start of the year. Due to market volatility, it is now valued at $47,500.
- Initial Value: $50,000
- Final Value: $47,500
- Absolute Decrease: $50,000 – $47,500 = $2,500
- Proportion: $2,500 / $50,000 = 0.05
- Percentage Decrease: $0.05 times 100 = text{5%}$
- Insight: Your portfolio has experienced a 5% decrease, which might influence decisions on rebalancing or holding patterns.
Practical Examples: Business Finance Scenarios
The same formula applies robustly to business contexts:
Example 1: Revenue Decline
- Scenario: A company’s quarterly revenue dropped from $1,200,000 last quarter to $1,080,000 this quarter.
- Initial Value: $1,200,000
- Final Value: $1,080,000
- Absolute Decrease: $1,200,000 – $1,080,000 = $120,000
- Proportion: $120,000 / $1,200,000 = 0.10
- Percentage Decrease: $0.10 times 100 = text{10%}$
- Insight: The company experienced a 10% decrease in revenue, signaling a need to investigate sales strategies, market conditions, or product performance.
Example 2: Cost Reduction
- Scenario: A manufacturing plant successfully reduced its energy costs from $75,000 per month to $60,000 per month after implementing new efficiencies.
- Initial Value: $75,000
- Final Value: $60,000
- Absolute Decrease: $75,000 – $60,000 = $15,000
- Proportion: $15,000 / $75,000 = 0.20
- Percentage Decrease: $0.20 times 100 = text{20%}$
- Insight: The plant achieved a commendable 20% decrease in energy costs, demonstrating the success of their efficiency initiatives. This is an example where a decrease is a positive outcome.
Common Applications Across Financial Domains
The utility of calculating a percentage decrease extends across virtually every facet of financial management. Its adaptability makes it an indispensable tool for analysis, reporting, and strategic planning.
Personal Finance: Tracking Expenses and Savings
For individuals, percentage decrease is vital for understanding personal financial health.
- Budgeting: If you aimed to spend $1,000 on discretionary items but only spent $800, you achieved a 20% decrease in your planned expenditure – a positive outcome. Conversely, if your monthly income decreased, knowing the percentage helps you adjust your budget proportionally.
- Debt Reduction: Monitoring the percentage decrease in your outstanding loan balance over time can be a powerful motivator and a clear indicator of progress toward financial freedom.
- Net Worth: While typically aiming for an increase, understanding percentage decreases in specific asset values (e.g., a car’s depreciation, a stock’s drop) helps in calculating an accurate overall net worth.
Investing: Analyzing Portfolio Performance and Stock Volatility
Investors heavily rely on percentage decrease to gauge the performance and risk of their holdings.
- Stock Price Drops: When a stock price falls from $100 to $90, it’s a 10% decrease. This metric helps investors decide whether to hold, sell, or buy more.
- Mutual Fund Returns: Comparing the percentage decrease in a fund’s value during a market downturn against benchmarks helps assess the fund manager’s performance in protecting capital.
- Portfolio Drawdown: The maximum percentage decrease from a peak to a trough in a portfolio’s value is a critical risk metric, informing investors about potential capital exposure during market corrections.
Business Finance: Assessing Revenue, Profit, and Operational Efficiency
For businesses, percentage decrease is fundamental to understanding operational health and market position.
- Sales & Revenue: A percentage decrease in sales year-over-year indicates potential market share loss, competitive pressure, or declining demand.
- Profit Margins: A shrinking gross or net profit margin (expressed as a percentage decrease from previous periods) can highlight rising costs, pricing issues, or inefficient operations.
- Customer Churn: The percentage decrease in active customers or subscribers over a period is a direct measure of customer retention effectiveness, vital for subscription-based businesses.
- Inventory Shrinkage: A percentage decrease in inventory due to theft, damage, or obsolescence helps businesses quantify losses and implement better controls.
Economic Indicators: Understanding Market Shifts
Economists and policymakers frequently use percentage decreases to describe macroeconomic trends.
- GDP Contraction: A percentage decrease in a country’s Gross Domestic Product signifies an economic recession.
- Inflation/Deflation: While typically discussed as a percentage increase, a negative inflation rate (deflation) is a percentage decrease in prices, carrying significant economic implications.
- Unemployment Rate: A percentage decrease in the unemployment rate indicates job market improvement, while an increase signifies economic hardship.
Interpreting and Acting on Percentage Decreases
Calculating a percentage decrease is merely the first step. The true value lies in interpreting what that number signifies and formulating appropriate actions. A decrease isn’t inherently good or bad; its implication depends entirely on the context and the metric being measured.
Beyond the Numbers: Strategic Implications
A percentage decrease provides a quantitative measure, but the qualitative assessment is where strategic thinking comes into play. For instance, a 15% decrease in marketing spend could be positive if it led to a more efficient campaign with similar results, or negative if it resulted in a disproportionate drop in customer acquisition.
- Root Cause Analysis: A significant decrease in a key financial metric (e.g., 20% drop in Q3 profits) should trigger a deep dive into its underlying causes. Is it a seasonal dip, a new competitor, a supply chain disruption, or an internal operational issue?
- Forecasting and Budgeting: Historical percentage decreases can be used to project future trends, helping businesses and individuals set more realistic budgets and financial targets. If marketing effectiveness has historically decreased by 5% year-over-year, that trend needs to be factored into future planning.
- Risk Management: Investors analyze maximum percentage drawdowns to understand potential risks. Businesses use it to assess exposure to market downturns or operational failures.
When a Decrease is Good vs. Bad (e.g., Expense vs. Revenue)
It’s critical to distinguish between desirable and undesirable percentage decreases:
Desirable Decreases: These are typically associated with costs, liabilities, or inefficiencies.
- Expenses: A 10% decrease in operational costs (e.g., utility bills, raw material prices) directly boosts profitability.
- Debt: A 15% decrease in your credit card balance is a clear sign of financial improvement.
- Waste/Shrinkage: A 5% decrease in inventory spoilage is a positive operational efficiency gain.
- Overheads: Reducing administrative overheads by a certain percentage can free up resources for growth.
Undesirable Decreases: These typically relate to income, assets, market share, or positive growth indicators.
- Revenue/Sales: A 8% decrease in sales is usually a cause for concern, indicating lost market share or reduced demand.
- Asset Value: A 20% decrease in the value of an investment or property represents a capital loss.
- Customer Base: A 7% decrease in your active customer count indicates churn and potential future revenue loss.
- Profitability: A decrease in profit margins means less money is being kept from each sale, often signaling pricing pressure or rising costs.
Understanding this distinction is crucial for context-driven financial analysis. A decrease in expenses is often celebrated, while a decrease in revenue often demands corrective action.
Tools and Software for Streamlined Financial Calculations
While manual calculation is straightforward for simple figures, real-world financial management involves numerous data points. Financial professionals and savvy individuals often leverage tools to automate these calculations:
- Spreadsheet Software (Excel, Google Sheets): Invaluable for tracking multiple financial metrics. Formulas like
=(Initial_Value - Final_Value) / Initial_Value * 100can be applied to entire datasets, providing instant percentage change calculations. Conditional formatting can even highlight significant decreases automatically. - Financial Software & Apps: Personal finance apps (e.g., Mint, YNAB) and business accounting software (e.g., QuickBooks, Xero) often have built-in dashboards and reporting features that automatically calculate and display percentage changes for various accounts and categories.
- Business Intelligence (BI) Tools: For larger organizations, BI platforms (e.g., Tableau, Power BI) visualize complex financial data, including percentage decreases, making it easier to spot trends and anomalies at a glance.
Leveraging these tools not only saves time but also reduces the potential for manual errors, ensuring that financial decisions are based on accurate and timely data.
Common Pitfalls and Best Practices
While calculating percentage decrease is straightforward, certain pitfalls can lead to misinterpretations or inaccuracies. Adhering to best practices ensures robust and reliable financial analysis.
Ensuring Accurate Base Values
The most common error in calculating percentage decrease is using an incorrect initial value.
- Consistency is Key: Always use the original or “starting” value as the denominator. For example, if you’re tracking a stock’s performance, the initial value should be its purchase price or the value at the start of your tracking period.
- Avoiding “Percentage of a Percentage” Traps: When dealing with multiple changes over time, be careful not to simply add or subtract percentages. A 10% decrease followed by a 10% increase does not result in returning to the original value due to the changing base. For example, $100 – 10% = $90. $90 + 10% = $99.
- Inflation Adjustment: For long-term financial analysis (e.g., investment returns over decades), consider adjusting initial and final values for inflation to get a “real” percentage decrease, reflecting true purchasing power changes.
Contextualizing Decreases Over Time
A single percentage decrease snapshot tells only part of the story.
- Trend Analysis: Look for patterns. Is the decrease an isolated event, or part of a consistent downward trend? A small, consistent decrease might be more concerning than a single, large but explainable drop.
- Benchmarking: Compare the percentage decrease against industry averages, competitor performance, or historical data. Is a 5% revenue drop acceptable in a declining market, or is it underperforming peers?
- Timeframes: Be clear about the period over which the decrease is calculated (e.g., monthly, quarterly, annually). A 1% monthly decrease annualizes to a much larger figure.
Communicating Financial Changes Effectively
Presenting percentage decreases clearly is as important as calculating them accurately, especially when communicating to stakeholders, clients, or team members.
- Clarity and Simplicity: Avoid jargon. State the initial and final values, the absolute decrease, and then the percentage decrease clearly.
- Visual Aids: Use charts and graphs (e.g., line charts, bar graphs) to illustrate decreases over time. Visual representations make complex financial changes more accessible and understandable.
- Narrative Context: Always accompany numbers with an explanation. What caused the decrease? What are the implications? What actions are being taken? This turns raw data into actionable insights.
By adhering to these best practices, financial professionals and individuals can leverage percentage decrease calculations to gain deeper insights into their financial health, manage risks more effectively, and make more informed strategic decisions. In the ever-evolving financial world, precision in measurement and clarity in interpretation are the bedrock of success.
aViewFromTheCave is a participant in the Amazon Services LLC Associates Program, an affiliate advertising program designed to provide a means for sites to earn advertising fees by advertising and linking to Amazon.com. Amazon, the Amazon logo, AmazonSupply, and the AmazonSupply logo are trademarks of Amazon.com, Inc. or its affiliates. As an Amazon Associate we earn affiliate commissions from qualifying purchases.