In the contemporary financial landscape, Bitcoin is often discussed in the same breath as gold, treasury bonds, and blue-chip stocks. However, to truly understand the magnitude of Bitcoin’s ascent as a premier financial asset, one must look back to its most transformative formative year: 2011. For modern investors, the question “how much was Bitcoin in 2011?” is not merely a request for a data point; it is an inquiry into the birth of an entirely new asset class.
In 2011, Bitcoin transitioned from an obscure cryptographic experiment into a tradeable financial instrument with a fluctuating market price. This was the year the world first saw the “proof of concept” for decentralized digital currency in terms of real-world purchasing power. Understanding the price action of 2011 provides invaluable insights into market psychology, risk management, and the long-term potential of asymmetric investments.
The Financial Landscape of Bitcoin in 2011: From Pennies to Parity
At the dawn of 2011, Bitcoin was largely unknown outside of specialized cypherpunk mailing lists and niche forums. It had no institutional backing, no regulatory framework, and incredibly low liquidity. Yet, this year would mark the first time the asset achieved “parity” with the United States Dollar—a psychological milestone that changed the narrative of digital finance forever.
The Starting Point: Sub-Dollar Trading
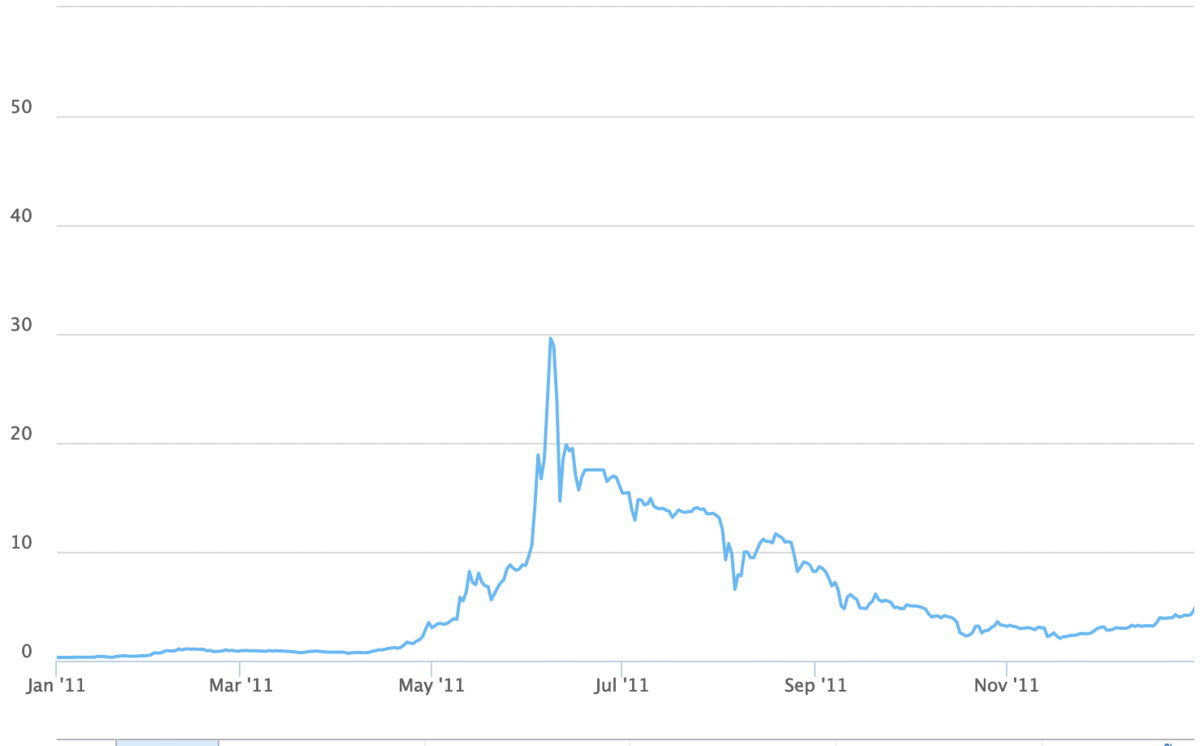
On January 1, 2011, Bitcoin was trading at approximately $0.30 per coin. At this price point, the total market capitalization of the network was negligible by global standards. For the few individuals who were “mining” Bitcoin on their home computers, the asset was more of a hobbyist’s token than a serious investment vehicle. However, the underlying scarcity—capped at 21 million units—began to attract the attention of forward-thinking speculators who saw it as a hedge against the traditional inflationary monetary system that was still reeling from the 2008 financial crisis.
Reaching the $1 Milestone
The most significant event of early 2011 occurred on February 9, when Bitcoin’s price reached $1.00 on the Mt. Gox exchange. For the first time, one unit of digital code was worth exactly one unit of the world’s reserve currency. This event acted as a catalyst for mainstream media coverage, with outlets like TIME and Forbes beginning to mention the digital currency. The achievement of parity was a signal to the financial world that Bitcoin had moved beyond a mere experiment and had established a baseline of value.
The First Major Peak and Correction
Following the $1 milestone, Bitcoin entered its first true “bull run.” By June 2011, the price skyrocketed to an all-time high of approximately $32.00. For early adopters who had acquired coins at $0.10 or $0.30, this represented a return on investment (ROI) of over 10,000% in a matter of months. However, the fledgling market was not yet equipped to handle such rapid growth. A massive sell-off ensued, exacerbated by security breaches at early exchanges, causing the price to crash back down to the $2.00 range by the end of the year. This 90% drawdown was a brutal introduction for many to the extreme volatility that would become Bitcoin’s hallmark.
Understanding Bitcoin’s Early Valuation as an Asset Class
To analyze Bitcoin’s price in 2011 through a professional financial lens, one must examine the infrastructure that supported these valuations. Price is a function of supply and demand, but in 2011, the mechanisms for facilitating that demand were in their infancy.
The Role of Early Exchanges like Mt. Gox
In 2011, the vast majority of Bitcoin trading took place on a single platform: Mt. Gox. Based in Tokyo, this exchange became the primary source of price discovery. From a financial perspective, this created a significant “single point of failure” risk. When the exchange suffered technical glitches or security scares, the price of Bitcoin reacted violently. Modern investors often take for granted the robust, regulated exchanges like Coinbase or Kraken, but in 2011, the “market price” was often whatever a single, fragile website said it was. This period taught the market the importance of exchange security and the need for distributed liquidity.
Market Cap and Liquidity in the Early Days
In 2011, the concept of “liquidity”—the ability to buy or sell an asset without significantly moving its price—was virtually non-existent for Bitcoin. A single sell order of a few thousand Bitcoins could crash the price by 20% or more. This lack of depth meant that while the “paper gains” for early holders were astronomical, realizing those gains was difficult. This era of Bitcoin’s history is a case study in “slippage” and the challenges of exiting a high-growth, low-liquidity position. It underscores why institutional investors waited years for more mature market structures before entering the space.

Investment Lessons from the 2011 Volatility
The price action of 2011 serves as a masterclass in the psychology of investing in disruptive technologies. For those looking to build wealth through “side hustles” in the digital space or through long-term investing, 2011 provides several perennial lessons.
Dealing with High Percentage Swings
In 2011, it was common for Bitcoin to move 10% to 20% in a single day. For a traditional investor used to the 1% or 2% swings of the S&P 500, this was terrifying. However, those who viewed Bitcoin as a long-term “call option” on a new financial system were able to stomach the volatility. The lesson here is clear: with high potential reward comes high risk and the necessity of a strong stomach. 2011 proved that the price of admission for Bitcoin’s legendary gains was the ability to ignore short-term price collapses.
The Concept of “HODLing” Born from Chaos
While the term “HODL” (a misspelling of “hold”) wouldn’t be coined until a few years later, the strategy was essentially pioneered during the 2011 crash. Investors who bought at the $30 peak and watched their investment lose 90% of its value had two choices: sell at a massive loss or hold through the “crypto winter.” Those who chose the latter and maintained their conviction eventually saw their $30 investment turn into tens of thousands of dollars. 2011 taught the financial community that in the world of decentralized finance, time in the market is often more important than timing the market.
Comparing 2011 Value to Modern Financial Realities
To put the 2011 price of Bitcoin into perspective, we must compare the purchasing power and market sentiment of that era with today’s sophisticated financial environment.
Purchasing Power: What $100 Could Buy Then vs. Now
In mid-2011, if an investor had allocated $100 toward Bitcoin at an average price of $5.00, they would have acquired 20 BTC. At today’s prices (hypothetically $60,000 per BTC), that $100 investment would be worth $1.2 million. This represents one of the greatest wealth-creation events in human history. In 2011, $100 might have bought you a decent dinner for two; today, that same $100 investment in Bitcoin could theoretically fund a comfortable retirement. This highlights the power of early-stage investing in technologies that have the potential to reach global scale.
Institutional vs. Retail Sentiments
In 2011, the “money” involved in Bitcoin was almost entirely retail—individuals, tech enthusiasts, and a few libertarians. There were no Bitcoin ETFs, no corporate balance sheet allocations (like MicroStrategy), and no nation-states adopting it as legal tender. The sentiment was one of skepticism and curiosity. Today, the price is driven by massive institutional flows and global macroeconomic factors. The shift from the “pennies” of 2011 to the “thousands” of today reflects Bitcoin’s transition from a fringe digital experiment to a legitimate component of a diversified modern portfolio.
The Legacy of 2011 in the Context of Personal Finance Today
The story of Bitcoin in 2011 is more than just a history lesson; it is a framework for how we should approach new financial tools and online income opportunities today.
Risk Management and Diversification
The 2011 crash serves as a reminder that one should never invest more than they can afford to lose in highly speculative assets. While the upside was enormous, many people in 2011 lost significant sums by “buying the top” and panic-selling at the bottom. Modern personal finance dictates that while Bitcoin can be a powerful wealth builder, it should be part of a balanced strategy that includes more stable assets. The 2011 data shows that even the most successful asset in history had moments where it looked like a total failure.

Why the 2011 Price Matters for Future Projections
Analysts often look back at 2011 to model Bitcoin’s “logarithmic growth curves.” By observing how the asset behaved when it was worth only a few dollars, experts can better predict how it might behave as it reaches total market saturation. The 2011 price action established the “halving” cycles and the four-year market patterns that many traders still use today to inform their investment decisions.
In conclusion, when we ask “how much was Bitcoin in 2011,” we are looking at the foundational year of the digital gold rush. It was a year of $1 parity, a year of $30 peaks, and a year of $2 bottoms. Most importantly, it was the year that Bitcoin proved it had a price—and therefore, a future—in the global financial system. For the modern investor, 2011 remains the ultimate reminder that the greatest opportunities often come in small, volatile, and misunderstood packages.
aViewFromTheCave is a participant in the Amazon Services LLC Associates Program, an affiliate advertising program designed to provide a means for sites to earn advertising fees by advertising and linking to Amazon.com. Amazon, the Amazon logo, AmazonSupply, and the AmazonSupply logo are trademarks of Amazon.com, Inc. or its affiliates. As an Amazon Associate we earn affiliate commissions from qualifying purchases.