
The United States stock market is often viewed as the primary engine of global capitalism. It is a vast, complex ecosystem where trillions of dollars change hands, representing the collective expectations, innovations, and risks of millions of participants worldwide. When people ask, “How much money is in the US stock market?” they are typically referring to the total market capitalization—the aggregate value of all publicly traded companies listed on American exchanges. As of the current fiscal year, that figure has reached staggering heights, fluctuating between $50 trillion and $55 trillion depending on daily market movements and economic cycles.
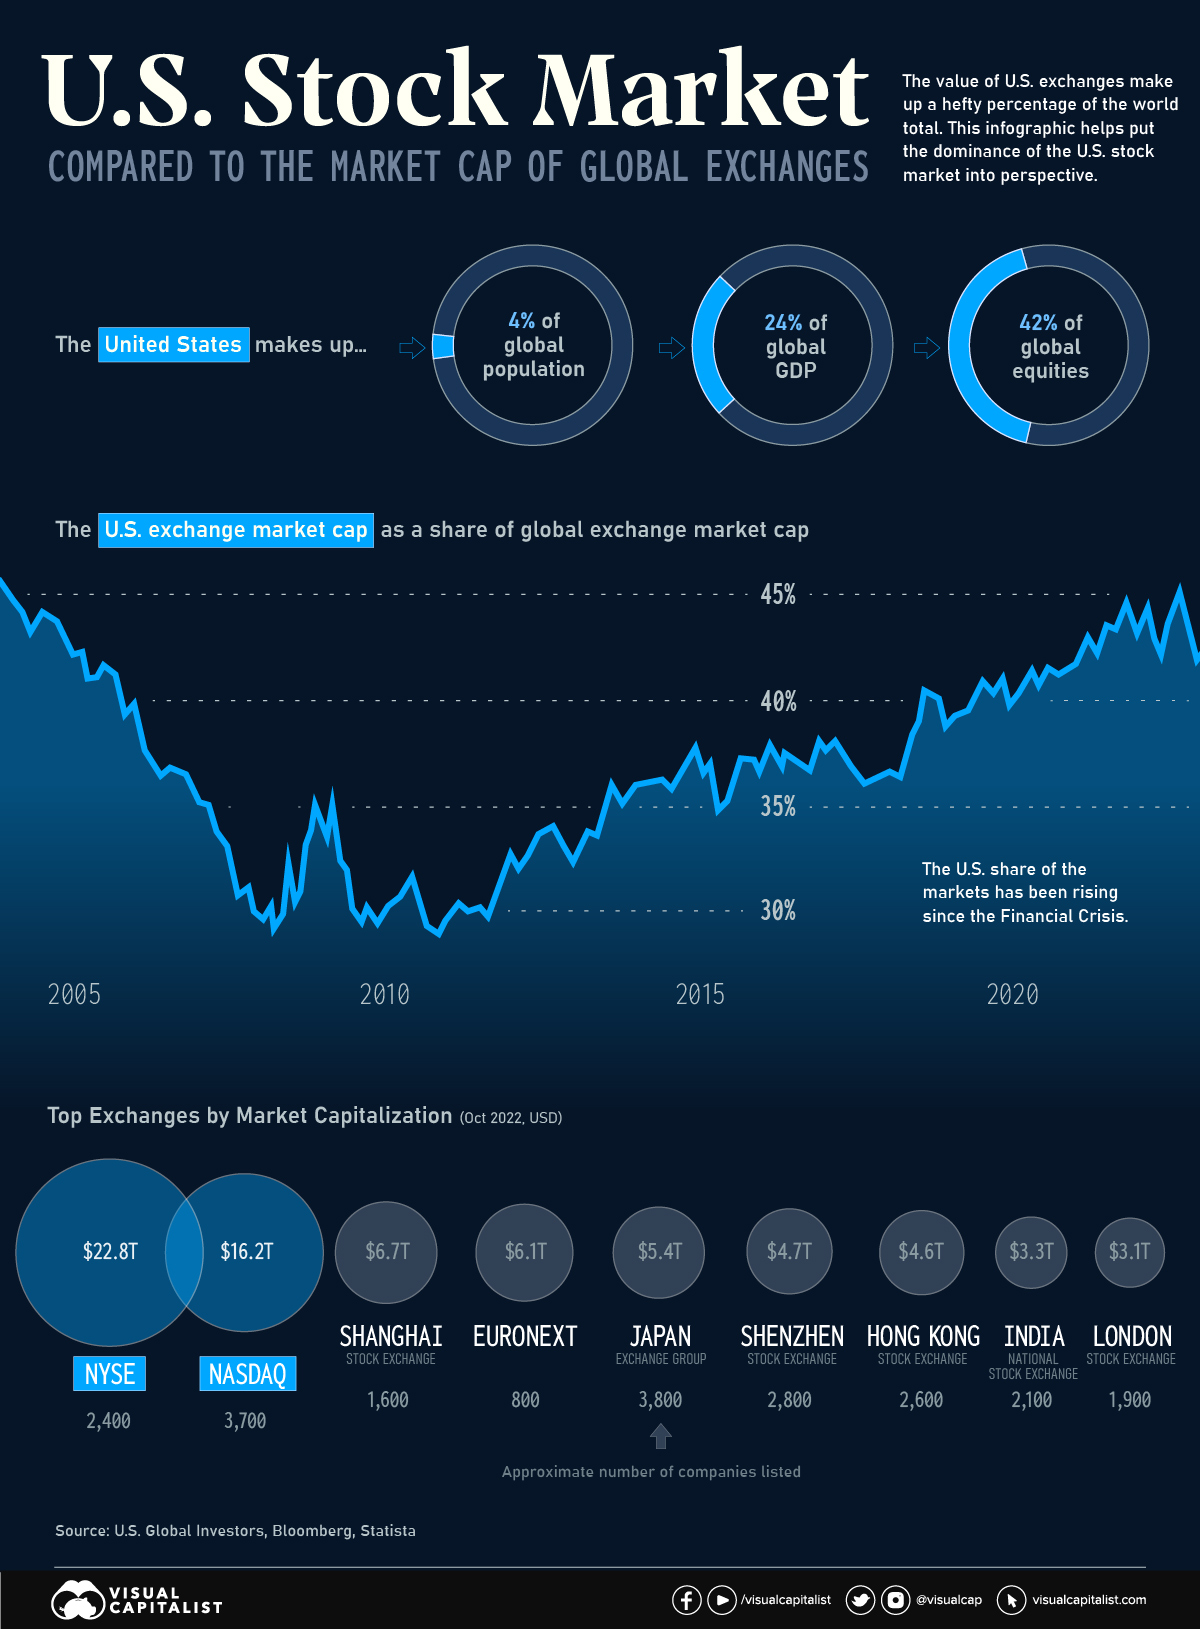
Understanding the scale of this capital is essential for any investor or financial professional. This figure is not just a static number; it is a reflection of the total equity wealth concentrated within the borders of a single nation, representing more than 40% of the entire world’s equity value. To grasp the magnitude of this wealth, one must look beneath the surface at the indices, the sectors, and the economic drivers that propel these valuations.
Defining the Scope: Market Capitalization vs. Circulating Wealth
To accurately quantify the “money” in the stock market, we must first define our terms. In financial terms, the most accurate metric is “Market Capitalization.” This is calculated by multiplying a company’s current share price by its total number of outstanding shares. When we aggregate this for every public company in the U.S., we arrive at the total market value.
How Market Cap is Calculated and Verified
The total valuation of the U.S. stock market is primarily tracked through broad-based indices. While the Dow Jones Industrial Average (DJIA) is the most famous, it only tracks 30 large companies. The S&P 500 is a better representation of large-cap health, but even it does not capture the full picture. For the most comprehensive view, economists point to the Wilshire 5000 Total Market Index.
The Wilshire 5000 is intended to track all actively traded U.S. stocks. Historically, the “money” in the market has grown exponentially. For context, in the mid-1970s, the total U.S. market cap was less than $1 trillion. By the mid-1990s, it surpassed $5 trillion. Today, the rapid acceleration of technology and the influx of institutional capital have pushed that number past the $50 trillion mark. This growth is a testament to the compounding nature of equity returns and the increasing “financialization” of the economy.
The Distinction Between Value and Liquidity
It is important to note that while the market is “worth” $50 trillion, there is not $50 trillion in cash sitting in bank accounts waiting to be spent. Market capitalization is a valuation of ownership. If every investor attempted to sell their shares simultaneously to “cash out,” the price would plummet, and that $50 trillion valuation would vanish. Therefore, the “money” in the market represents paper wealth—the perceived value of future earnings and dividends.
Current Valuations and the Trillion-Dollar Club
The distribution of wealth within the U.S. stock market is heavily skewed toward the top. In recent years, we have witnessed a phenomenon known as “market concentration,” where a small handful of elite companies account for a massive percentage of the total market value.
The S&P 500 Dominance
The S&P 500 represents approximately 80% of the total value of the U.S. stock market. Because the index is float-adjusted market-cap weighted, the largest companies have the greatest impact on the index’s performance and total valuation. Currently, the top ten companies in the S&P 500 make up roughly 30% to 35% of the index’s total value. This concentration means that “how much money is in the market” is often a question of how much money is in Big Tech.
The Rise of the Mega-Caps
The “Trillion-Dollar Club”—which includes titans like Microsoft, Apple, NVIDIA, Alphabet (Google), Amazon, and Meta—serves as the cornerstone of American financial dominance. These companies alone possess market caps that exceed the entire GDP of many developed nations. For example, Apple’s market capitalization has at various times exceeded $3 trillion. To put that in perspective, if Apple were a country, its “wealth” would rank among the top ten economies in the world.
This concentration of wealth into mega-cap stocks has changed the dynamics of investing. It provides stability during certain market phases but also creates systemic risk; if the technology sector faces a downturn, the entire “valuation” of the U.S. market can shrink by trillions of dollars in a single week.
The US Market in a Global Context
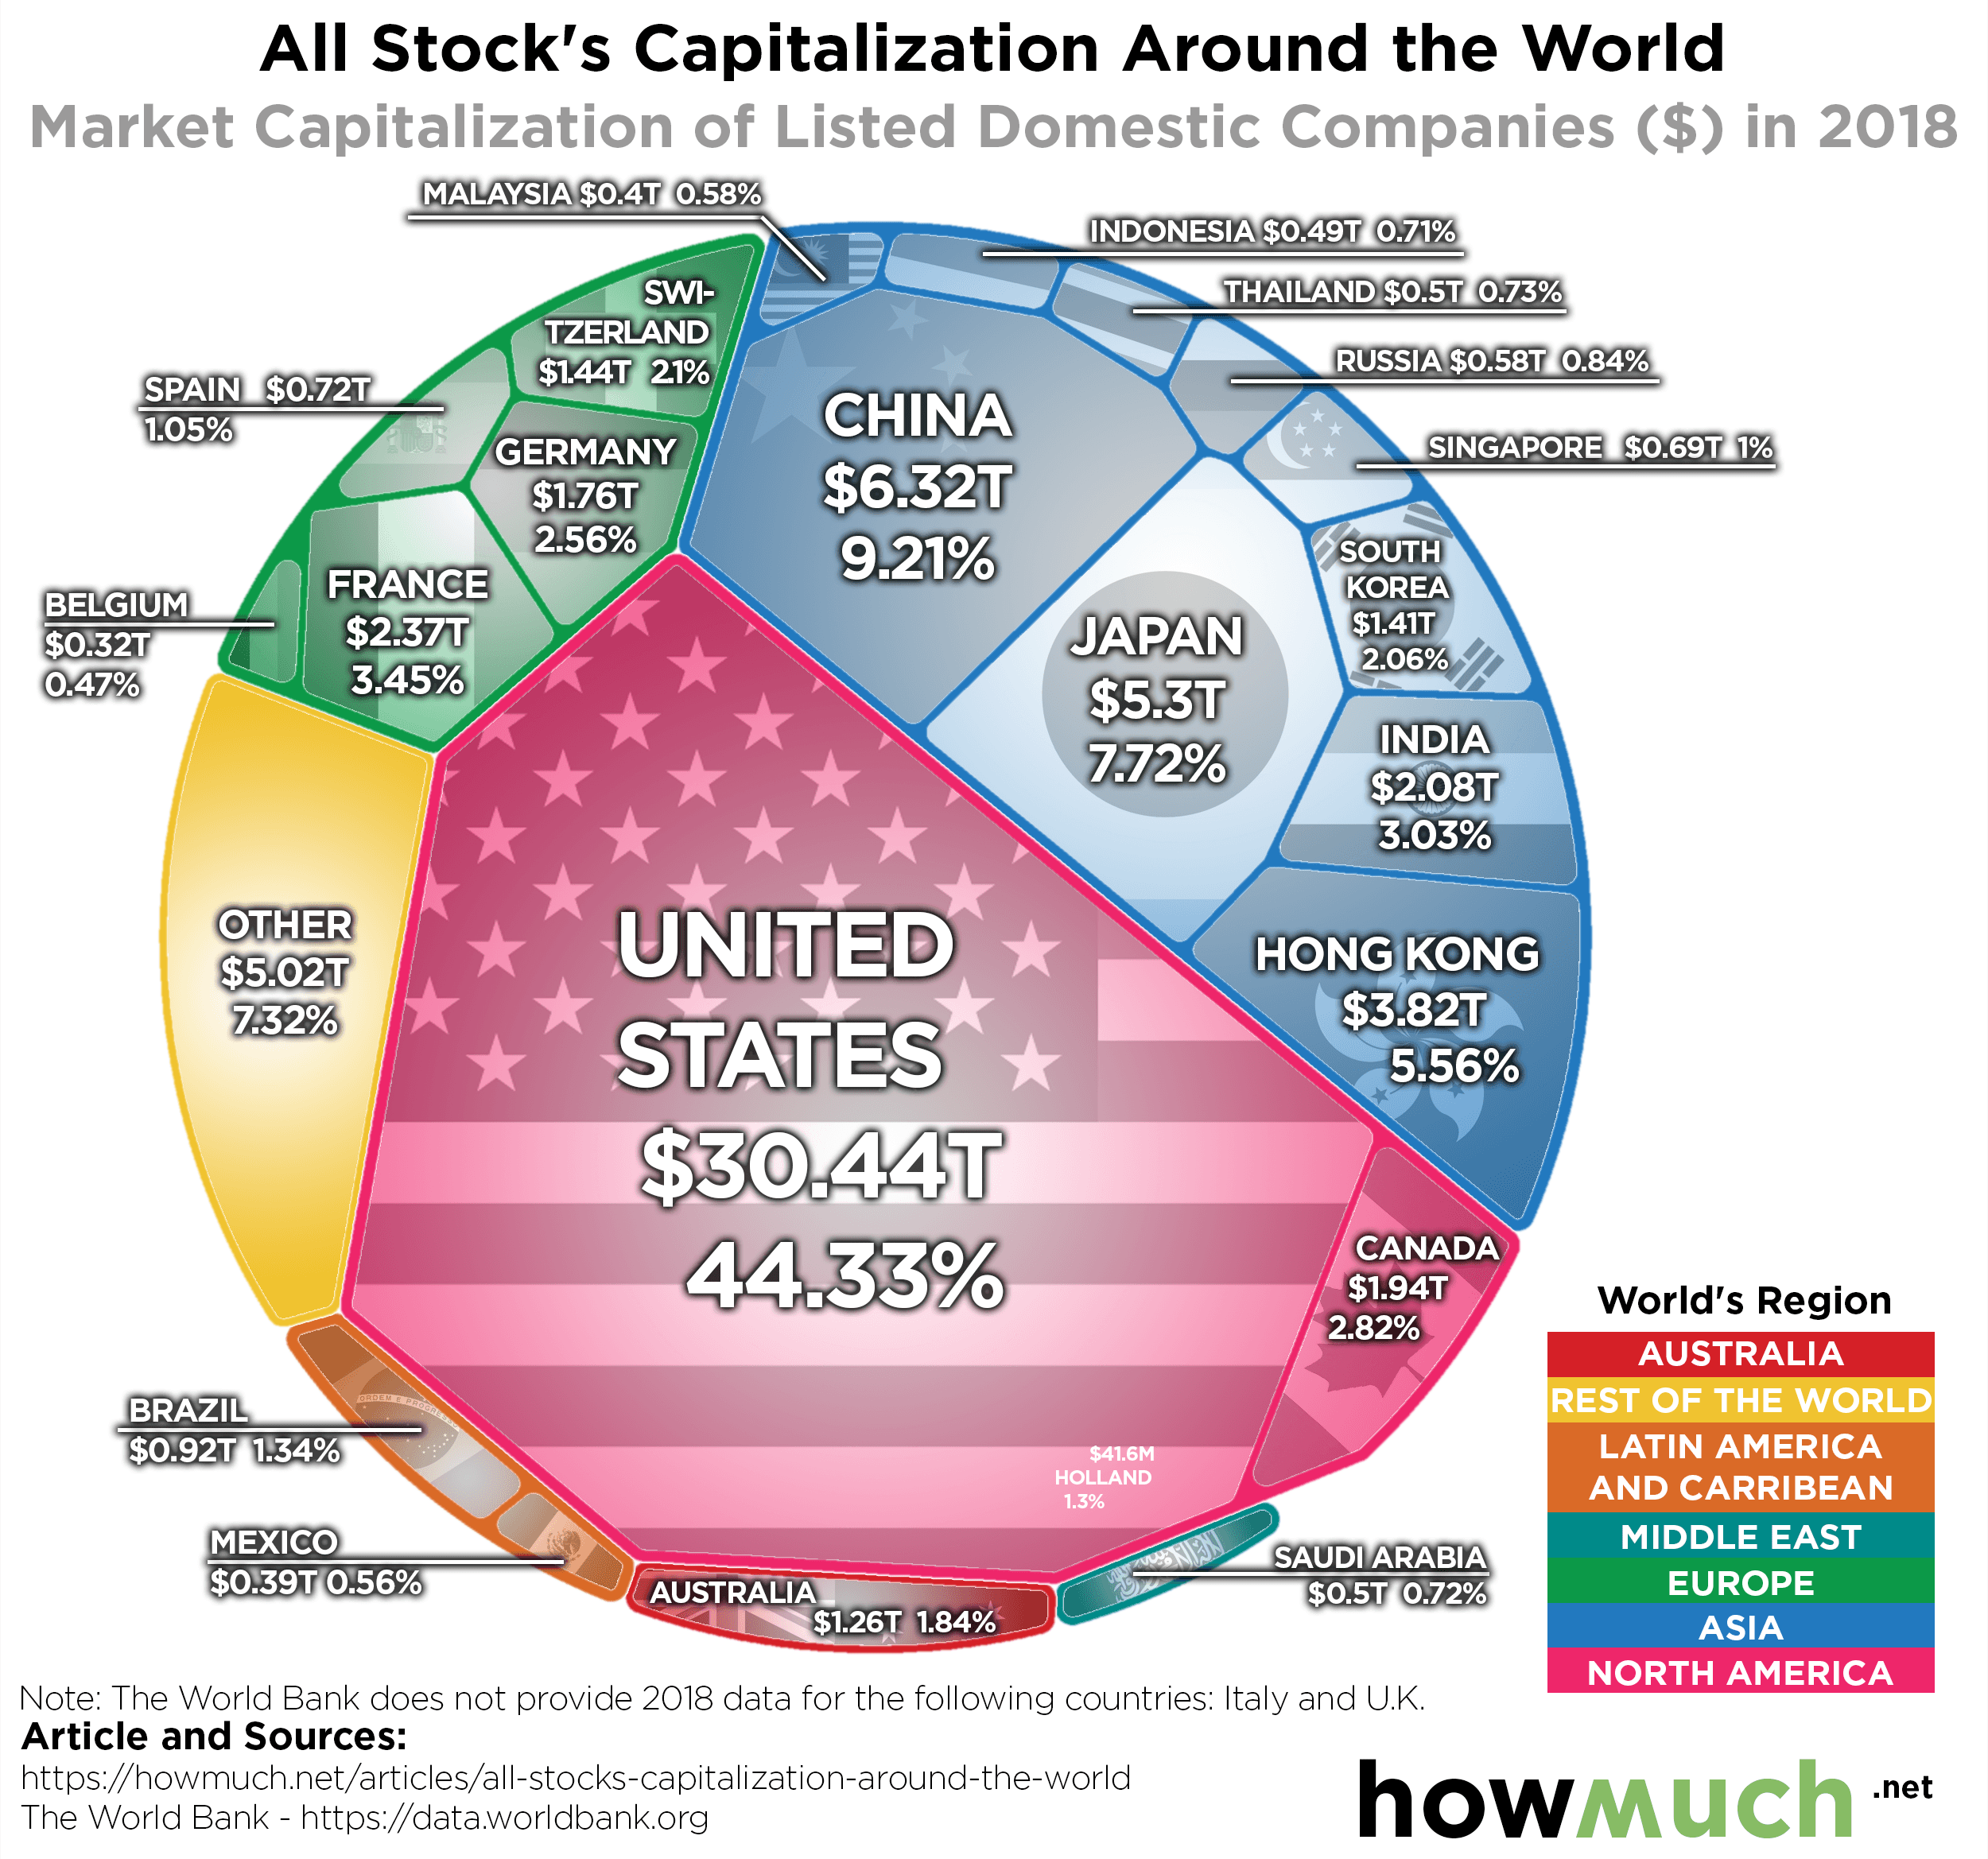
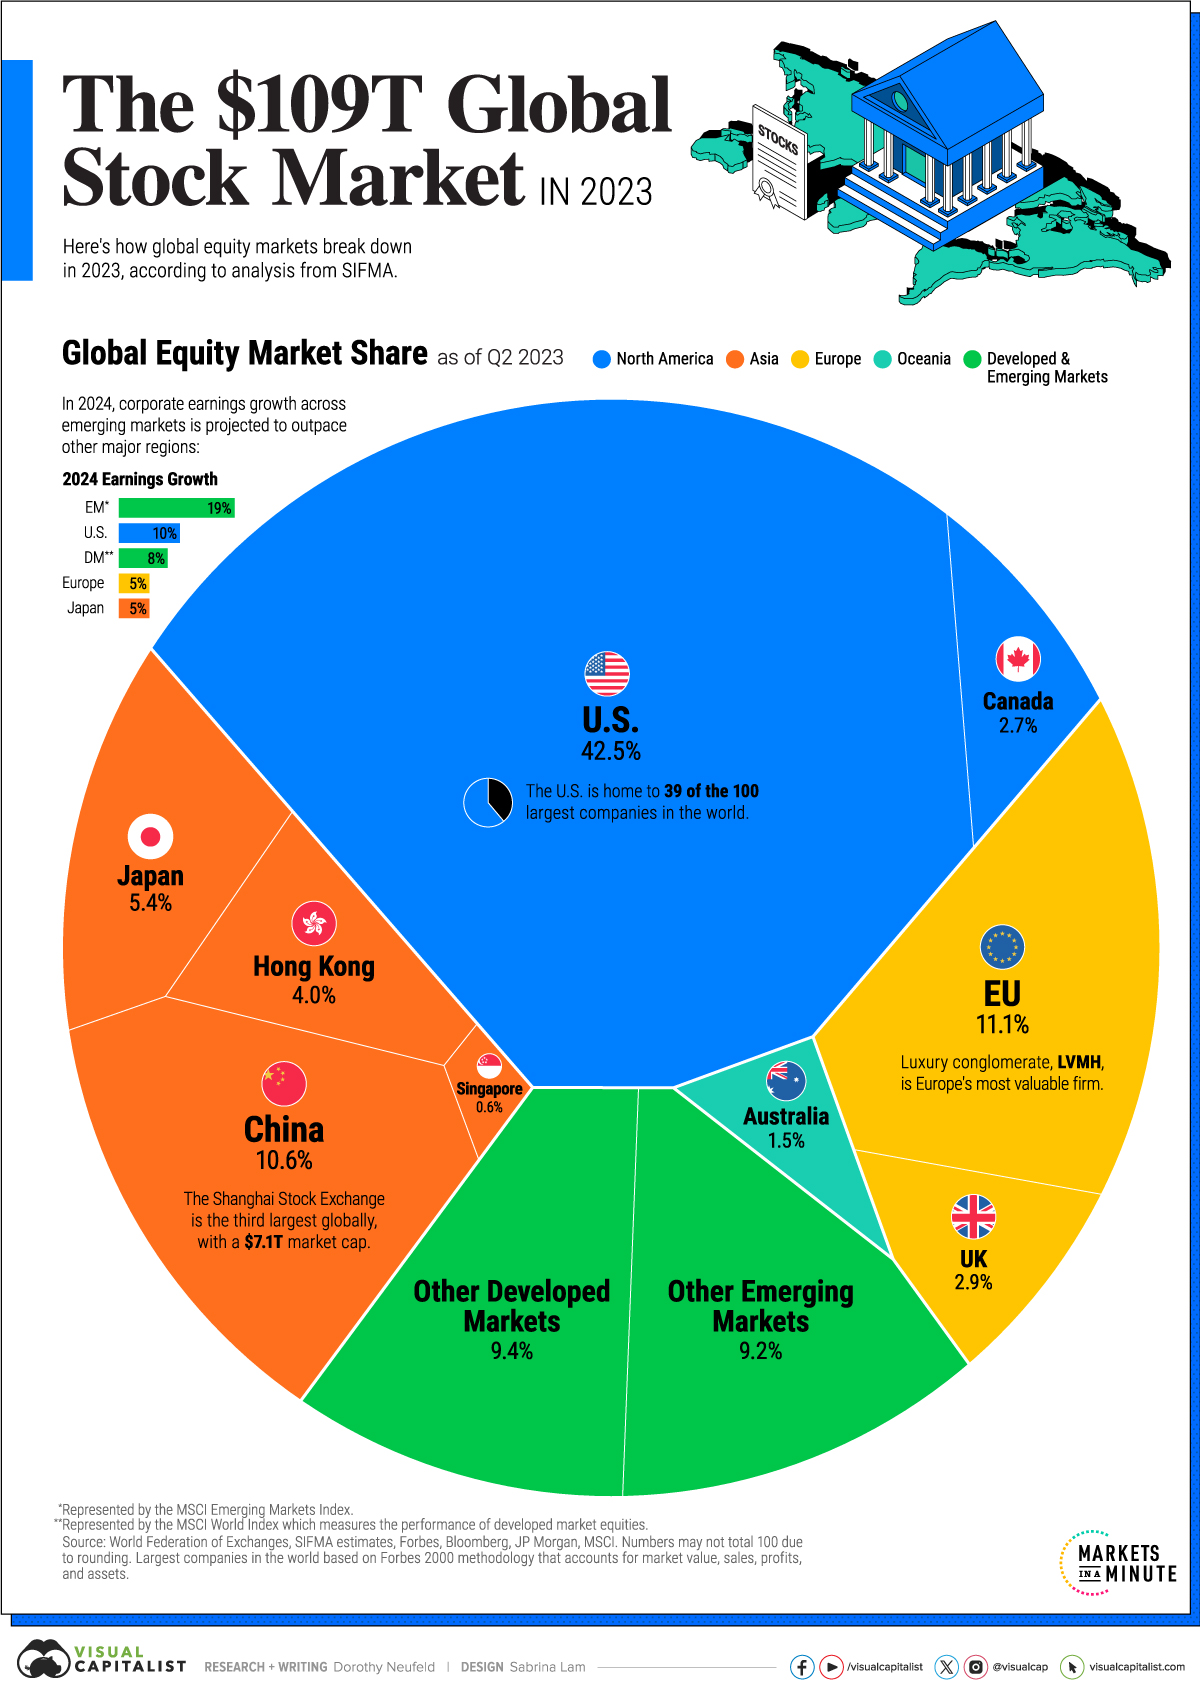
One cannot discuss the size of the U.S. stock market without acknowledging its disproportionate share of the global financial pie. Despite the U.S. representing only about 4% of the world’s population and roughly 25% of global GDP, its stock market represents nearly 60% of the total global equity market value.
Relative Size to Global Equities
The depth and breadth of U.S. capital markets are unparalleled. Compare the $50+ trillion U.S. market to other major global players: the Japanese market (JPX) typically hovers around $6 trillion, the Chinese markets (Shanghai and Shenzhen) combined are roughly $10 trillion, and the Euronext is significantly smaller. The U.S. market is not just a leader; it is the dominant force.
This dominance is driven by several factors: a robust legal framework for property rights, a culture of innovation and entrepreneurship, and the status of the U.S. Dollar as the world’s reserve currency. Investors from around the world park their capital in U.S. equities because they offer a level of liquidity and transparency that is difficult to find elsewhere.
Why Global Capital Flows Toward the US
When global instability arises, capital tends to seek “safe havens.” Historically, this has meant U.S. Treasuries, but increasingly, it includes blue-chip U.S. stocks. The influx of foreign institutional money—from sovereign wealth funds in the Middle East to pension funds in Europe—continually inflates the total amount of money in the U.S. stock market. This “foreign demand” for American shares is a primary reason why U.S. valuations (Price-to-Earnings ratios) are often much higher than those in emerging markets or Europe.
Driving Forces Behind Market Expansion
The journey from a $10 trillion market to a $50 trillion market didn’t happen by accident. Several macroeconomic levers have been pulled over the last two decades to facilitate this massive expansion of wealth.
Monetary Policy and Interest Rates
One of the most significant contributors to the rise in stock market value is the long-term trend of low interest rates. When the Federal Reserve maintains low rates, “money” becomes cheap to borrow. Corporations use this cheap debt to buy back their own shares, which reduces supply and increases the price per share, effectively boosting market capitalization.
Furthermore, in a low-yield environment, investors cannot get a decent return on bonds or savings accounts. This forces “yield-seeking” capital into the stock market, driving up demand and valuations. The era of “Quantitative Easing” (QE) essentially pumped liquidity directly into the financial system, much of which ended up in equity valuations.
Corporate Earnings and Innovation
While monetary policy provides the liquidity, corporate earnings provide the fundamental justification for the market’s size. American companies have proven exceptionally adept at scaling operations globally. The digital revolution allowed software companies to achieve profit margins that were previously unthinkable in the industrial age.
When a company like NVIDIA experiences a 200% growth in earnings due to the Artificial Intelligence boom, its market cap swells by trillions. This is “new money” being created through innovation and future expectations. As long as American companies continue to lead in sectors like AI, biotechnology, and renewable energy, the total money in the market is likely to continue its upward trajectory over the long term.
The Implications for the Individual Investor
For the individual investor, the fact that there is $50 trillion in the market is both a sign of opportunity and a call for caution. The sheer size of the market ensures liquidity—you can almost always find a buyer for your shares—but it also means that the market is influenced by massive global forces that are beyond any one person’s control.
Understanding Valuation Risk
When the total market capitalization grows much faster than the underlying GDP, it creates a “valuation gap.” Analysts often use the “Buffett Indicator” (the ratio of total market cap to GDP) to determine if the market is overvalued. When this ratio is historically high, it suggests that there is “too much money” in the market relative to the actual output of the economy, which can precede a correction or a “bear market.”
The Liquidity Factor
The “money” in the market is also a reflection of participation. With the rise of commission-free trading apps and the democratization of finance, more retail investors are contributing to the market’s total value than ever before. This increased participation adds to the market’s “depth,” making it more resilient but also more prone to sentiment-driven volatility.
In conclusion, the US stock market is a $50+ trillion monument to global economic activity. It is the repository of the world’s retirement savings, corporate profits, and speculative bets. While the headline number is staggering, its true significance lies in its role as a barometer for technological progress and economic health. As we look toward the future, the expansion of this figure will depend on the balance between inflationary pressures, technological breakthroughs, and the continued confidence of investors worldwide in the American financial system.
aViewFromTheCave is a participant in the Amazon Services LLC Associates Program, an affiliate advertising program designed to provide a means for sites to earn advertising fees by advertising and linking to Amazon.com. Amazon, the Amazon logo, AmazonSupply, and the AmazonSupply logo are trademarks of Amazon.com, Inc. or its affiliates. As an Amazon Associate we earn affiliate commissions from qualifying purchases.