
The question “how much money has the stock market lost?” is a perennial concern for investors, echoing through periods of economic uncertainty and market volatility. It’s a question that, while seemingly straightforward, unravels into a complex tapestry of economic indicators, historical context, and individual financial experiences. The stock market, a dynamic barometer of economic health and corporate performance, inevitably experiences downturns – periods where the aggregate value of publicly traded companies diminishes significantly. Understanding these losses, how they are measured, and their implications is crucial for both seasoned investors and those just beginning their financial journey. This article delves into the nuances of market losses, examining historical precedents, underlying causes, and strategies for navigating these challenging yet inherent phases of the investment cycle.
Understanding Market Downturns: More Than Just a Number
When the stock market “loses” money, it’s not a static event but rather a dynamic process reflecting a broad decline in the value of securities. This decline can be swift and sharp, or it can be a prolonged, gradual erosion. The perception of loss is often amplified by media headlines and immediate portfolio statements, but a deeper understanding requires differentiating between various types of market movements and how they are quantified.
Defining “Loss” in the Stock Market
In the simplest terms, a stock market loss occurs when the total market capitalization of publicly traded companies, or the value of major stock indices, decreases from a previous high. For an individual investor, a loss occurs when the current market value of their holdings is less than the price they paid for them. However, it’s vital to distinguish between “paper losses” or “unrealized losses” and “realized losses.” A paper loss exists as long as an investor holds onto an asset whose value has declined; it only becomes a realized loss if the investor sells that asset at the lower price. The stock market’s “losses” are almost always referring to unrealized declines across broad indices.
The Difference Between Corrections and Bear Markets
Not all market declines are created equal. Financial vernacular distinguishes between two primary types of significant downturns:
- Market Correction: This is typically defined as a decline of at least 10% but less than 20% from a recent peak in a major market index (like the S&P 500 or Dow Jones Industrial Average). Corrections are relatively common and often healthy, helping to reset valuations and prevent overheating. They can last anywhere from a few days to several months.
- Bear Market: A more severe and prolonged downturn, characterized by a decline of 20% or more from recent highs. Bear markets often coincide with economic recessions, high unemployment, and significant investor pessimism. They can last for many months, or even a couple of years, requiring a more cautious and strategic approach from investors.
Understanding this distinction helps to contextualize the severity and potential duration of any reported market “loss.” A 12% dip is a correction; a 30% drop signals a bear market, demanding a different level of analysis and response.
Measuring Market Performance: Indices and Market Capitalization
When we talk about how much the “stock market” has lost, we are typically referring to the performance of major stock market indices. These indices, such as the S&P 500 (representing 500 large U.S. companies), the Dow Jones Industrial Average (30 large companies), or the Nasdaq Composite (technology and growth stocks), serve as benchmarks for the overall health of the market.
- Index Performance: The percentage decline in these indices from their peak values is the most common way to quantify market losses. For example, if the S&P 500 drops from 4,800 points to 3,600 points, it represents a 25% loss for the index.
- Market Capitalization: Another way to conceptualize losses is by looking at the aggregate market capitalization – the total value of all outstanding shares – of all publicly traded companies. Trillions of dollars can be wiped off this collective value during significant downturns, representing the direct monetary amount “lost” on paper by shareholders globally. This figure is often staggering and can be difficult for individuals to fully grasp.
A Historical Perspective on Major Market Declines
History offers invaluable lessons about stock market losses, revealing patterns, causes, and the eventual resilience of equity markets. While each downturn has its unique triggers, studying past events provides context and helps investors prepare for future volatility.
The Dot-Com Bubble Burst (Early 2000s)
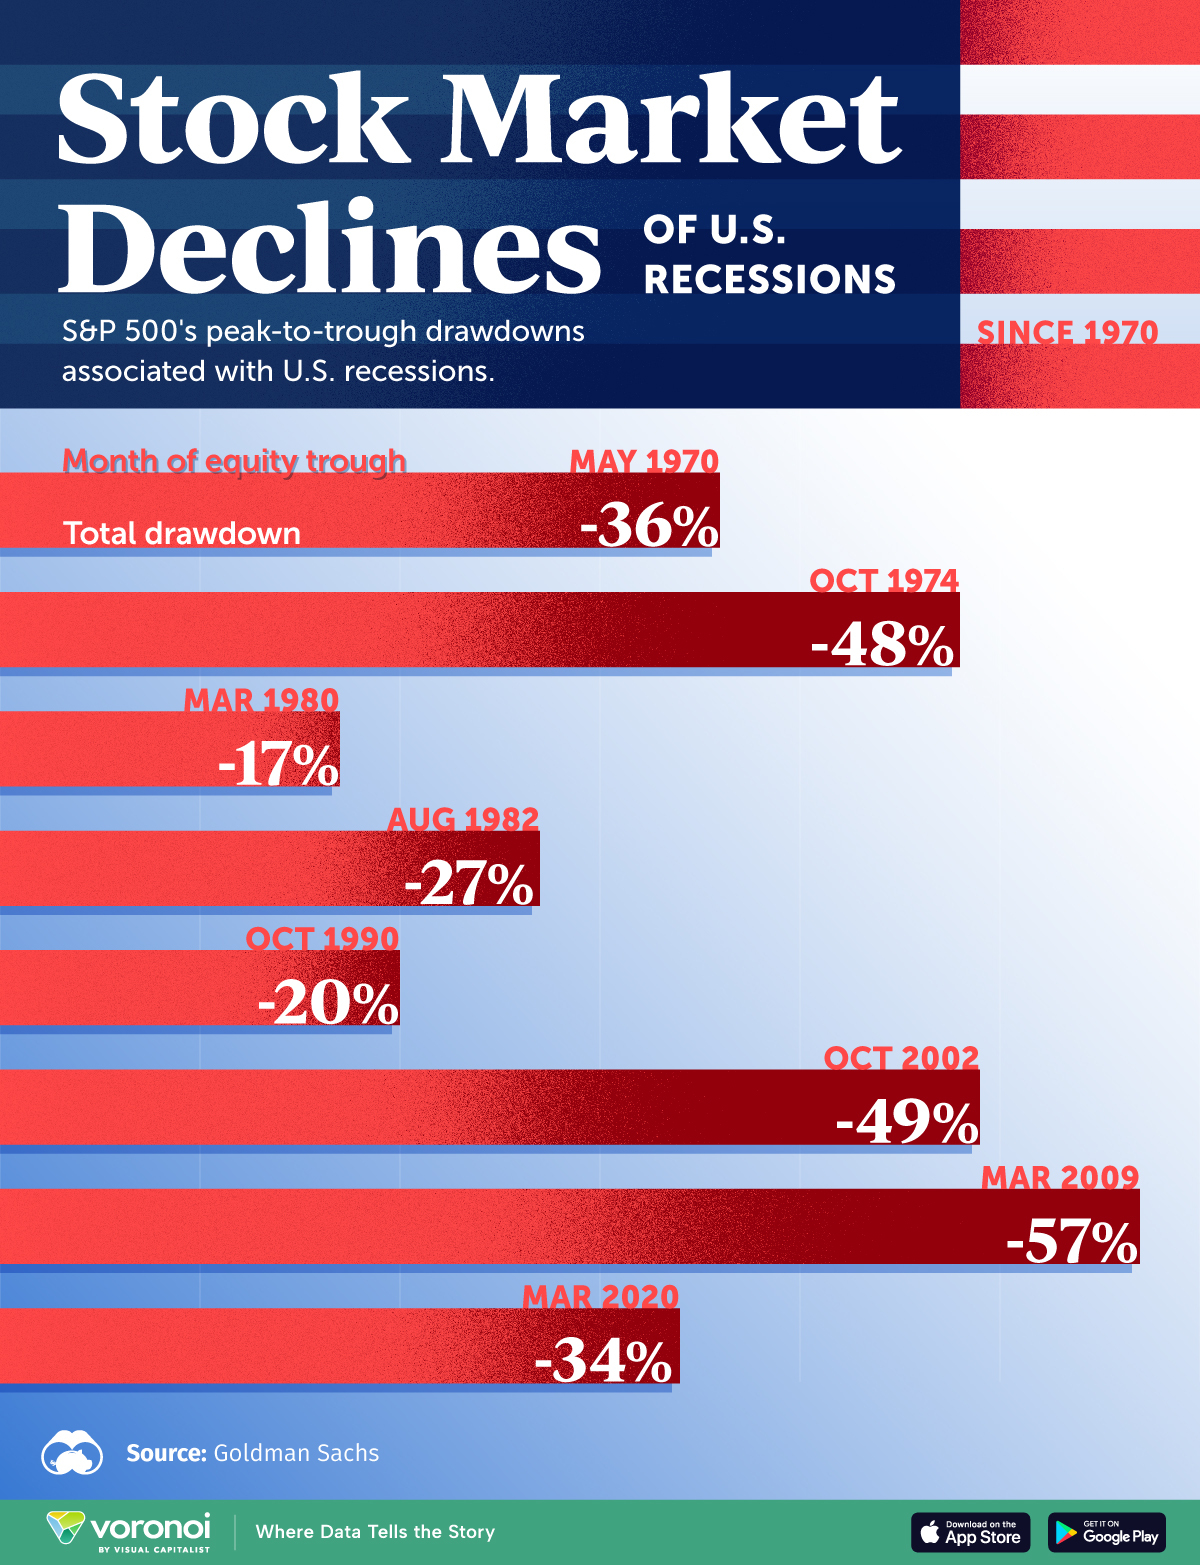
The late 1990s saw an exuberant boom in internet and technology stocks, fueled by speculative fervor rather than sustainable profits. When the bubble burst in early 2000, it led to a significant bear market. The tech-heavy Nasdaq Composite index plummeted by approximately 78% from its peak in March 2000 to its trough in October 2002. Trillions of dollars in market capitalization vanished, highlighting the dangers of irrational exuberance and overvaluation in specific sectors.
The 2008 Global Financial Crisis
Triggered by the collapse of the U.S. housing market and subsequent failures in the financial system (subprime mortgages, securitization, etc.), the 2008 crisis sent shockwaves across the globe. The S&P 500 index lost about 57% from its October 2007 peak to its March 2009 low. This period represented one of the most severe economic downturns since the Great Depression, leading to widespread job losses, bankruptcies, and government bailouts. The sheer scale of wealth destruction, both in equities and real estate, was immense.
The COVID-19 Pandemic Shock (2020)
The onset of the COVID-19 pandemic in early 2020 triggered an unprecedentedly rapid market sell-off. As businesses shut down and economies ground to a halt globally, fear gripped investors. The S&P 500 experienced a breathtaking 34% drop from its peak in February to its low in March – one of the fastest bear markets in history. However, thanks to aggressive monetary and fiscal stimulus from governments and central banks, the market recovered with astonishing speed, demonstrating the impact of external, sudden shocks and the potential for swift rebounds under supportive conditions.
Recent Economic Headwinds and Their Impact
More recently, markets have contended with a confluence of challenges, including high inflation, aggressive interest rate hikes by central banks, geopolitical tensions (e.g., the war in Ukraine), and lingering supply chain issues. While not reaching the depths of 2008, these factors have contributed to significant volatility and corrections in various sectors. For instance, in 2022, major indices experienced their worst year since 2008, with technology and growth stocks particularly affected by rising interest rates, which discount future earnings more heavily. These periods, while less catastrophic than full-blown crises, still represent substantial “paper losses” for investors, impacting sentiment and spending.
The Mechanisms Behind Market Losses
Stock market losses are rarely attributable to a single factor. Instead, they typically arise from a complex interplay of macroeconomic forces, geopolitical events, corporate performance, and investor psychology. Understanding these mechanisms helps to demystify market movements and inform investment decisions.
Macroeconomic Factors: Inflation and Interest Rates

Two of the most powerful drivers of market performance are inflation and interest rates.
- Inflation: When inflation (the general increase in prices for goods and services) runs high, it erodes the purchasing power of money, including future corporate earnings. This makes investors demand a higher return for holding stocks, pushing down valuations. Companies also face higher costs for raw materials, labor, and transportation, which can squeeze profit margins.
- Interest Rates: Central banks, like the U.S. Federal Reserve, raise interest rates to combat inflation. Higher interest rates make borrowing more expensive for companies, potentially slowing expansion and reducing profitability. They also make fixed-income investments (like bonds) more attractive relative to stocks, causing investors to shift capital away from equities. Growth stocks, whose valuations often rely on anticipated future earnings, are particularly vulnerable to rising interest rates, as higher rates diminish the present value of those future profits.
Geopolitical Events and Supply Chain Disruptions
Global events, from wars and political instability to pandemics and natural disasters, can have profound and immediate effects on financial markets.
- Geopolitical Tensions: Conflicts, trade wars, or significant political shifts can create uncertainty, disrupt global trade routes, affect commodity prices (e.g., oil and gas), and lead to sanctions, all of which can negatively impact corporate revenues and investor confidence.
- Supply Chain Disruptions: As evidenced during the COVID-19 pandemic, disruptions to global supply chains can lead to shortages of goods, increased production costs, and delays, ultimately impacting corporate profitability and consumer prices. These disruptions often contribute to inflationary pressures and economic slowdowns.
Corporate Earnings and Investor Sentiment
Ultimately, the stock market reflects the collective valuation of individual companies.
- Corporate Earnings: When companies report disappointing earnings, lower profit forecasts, or fail to meet analyst expectations, their stock prices tend to fall. A widespread decline in corporate profitability across many sectors can trigger a broader market downturn. Economic slowdowns often translate directly into reduced consumer spending and business investment, which hits corporate bottom lines.
- Investor Sentiment: Fear and greed are powerful emotions in the market. Negative news, economic uncertainty, or a cascade of selling can lead to widespread panic selling, even if underlying fundamentals haven’t drastically changed. This emotional reaction can amplify market downturns, sometimes pushing valuations below what rational analysis might suggest, only to rebound when sentiment shifts.
The Investor’s Experience: Real and Unrealized Losses
While market indices provide a macroscopic view of losses, the true impact is felt at the individual investor level, often through the lens of their personal portfolios and long-term financial goals. The experience of “losing money” in the stock market is as much psychological as it is financial.
Impact on Retirement Savings and Long-Term Goals
For many, their exposure to the stock market is primarily through retirement accounts like 401(k)s, IRAs, or pension funds. A significant market downturn can see the value of these accounts drop substantially, leading to anxiety about retirement timelines and financial security. Individuals nearing retirement age may feel particularly vulnerable, as they have less time to recover from losses. However, for younger investors with decades until retirement, market dips can be viewed as opportunities to buy assets at lower prices, which can significantly boost long-term returns through dollar-cost averaging.
The Psychology of Investing During Volatility
Witnessing one’s portfolio decline by 20%, 30%, or even more can be emotionally draining. Fear often prompts investors to make irrational decisions, such as selling their holdings at the bottom of the market, thereby converting unrealized losses into realized ones. This “panic selling” locks in losses and prevents participation in the inevitable market recovery. Greed can also be a factor during downturns, leading some to chase risky, speculative investments in hopes of a quick rebound, often without proper due diligence. Maintaining a disciplined, long-term perspective is critical during volatile periods.
Differentiating Between Paper Losses and Realized Losses
As mentioned, a key concept for investors is the distinction between “paper losses” and “realized losses.”
- Paper Losses (Unrealized Losses): These are declines in the value of an asset you still own. If you bought a stock at $100 and it’s now worth $70, you have a $30 paper loss. This loss only affects your net worth on paper and does not impact your cash flow or tax situation unless you sell. Most of the “money lost by the stock market” refers to these unrealized, aggregate paper losses.
- Realized Losses: These occur when you sell an asset for less than you paid for it. A realized loss impacts your capital, reduces your investable cash, and can have tax implications (e.g., capital loss deductions). The core advice during market downturns is to avoid realizing losses unless absolutely necessary, to give your investments time to recover.
Navigating Volatility: Strategies for Long-Term Investors
While stock market losses are an inherent part of investing, they don’t have to derail your financial future. Adopting a strategic, disciplined approach can help investors weather downturns and even position themselves for future growth.
The Power of Diversification
Diversification is perhaps the most fundamental principle of prudent investing. It involves spreading investments across different asset classes (stocks, bonds, real estate), industries, geographies, and company sizes. The goal is to avoid putting “all your eggs in one basket.” When one sector or asset class performs poorly, others may hold steady or even perform well, mitigating the overall impact on your portfolio. For example, during stock market downturns, bonds often act as a cushion, offering stability.
Embracing a Long-Term Investment Horizon
History consistently demonstrates that the stock market, despite its periodic downturns, has an upward bias over the long term. Major indices have always recovered from bear markets and gone on to reach new highs. Investors with a long-term horizon (10+ years) can afford to ride out volatility, knowing that temporary dips are often mere blips on a multi-decade chart. Short-term market noise should not dictate long-term strategy. This perspective helps in resisting the urge to sell during panic.
The Role of Dollar-Cost Averaging
Dollar-cost averaging (DCA) is a strategy where an investor invests a fixed amount of money at regular intervals, regardless of the asset’s price. When prices are high, your fixed amount buys fewer shares; when prices are low (during a downturn), it buys more shares. Over time, this strategy helps to average out the purchase price and reduces the risk of investing a large sum at an unfavorable market peak. During a bear market, DCA allows investors to accumulate more shares at lower prices, which can lead to significant gains when the market eventually recovers.

Rebalancing Your Portfolio and Staying Informed
- Rebalancing: Periodically reviewing and adjusting your portfolio back to its target asset allocation is crucial. If stocks have performed exceptionally well, they might now represent a larger percentage of your portfolio than intended. Rebalancing means selling some of the outperforming assets and buying more of the underperforming ones (which might include assets that have experienced a market loss), thus “selling high and buying low” and maintaining your desired risk level.
- Staying Informed, Not Overwhelmed: While it’s important to understand the economic landscape, obsessively checking your portfolio during a downturn can lead to anxiety. Focus on reliable financial news sources, understand the underlying reasons for market movements, and consult with a financial advisor if needed. Avoid making impulsive decisions based on sensational headlines or social media chatter.
In conclusion, the question “how much money has the stock market lost?” is answered through a combination of broad index performance, market capitalization figures, and individual portfolio valuations. While these losses can be substantial and unnerving, they are a cyclical feature of equity markets. By understanding the nature of these downturns, studying historical patterns, and employing sound investment strategies rooted in diversification, a long-term perspective, and disciplined execution, investors can navigate periods of volatility and continue towards their financial objectives, ultimately benefiting from the market’s enduring capacity for growth.
aViewFromTheCave is a participant in the Amazon Services LLC Associates Program, an affiliate advertising program designed to provide a means for sites to earn advertising fees by advertising and linking to Amazon.com. Amazon, the Amazon logo, AmazonSupply, and the AmazonSupply logo are trademarks of Amazon.com, Inc. or its affiliates. As an Amazon Associate we earn affiliate commissions from qualifying purchases.