
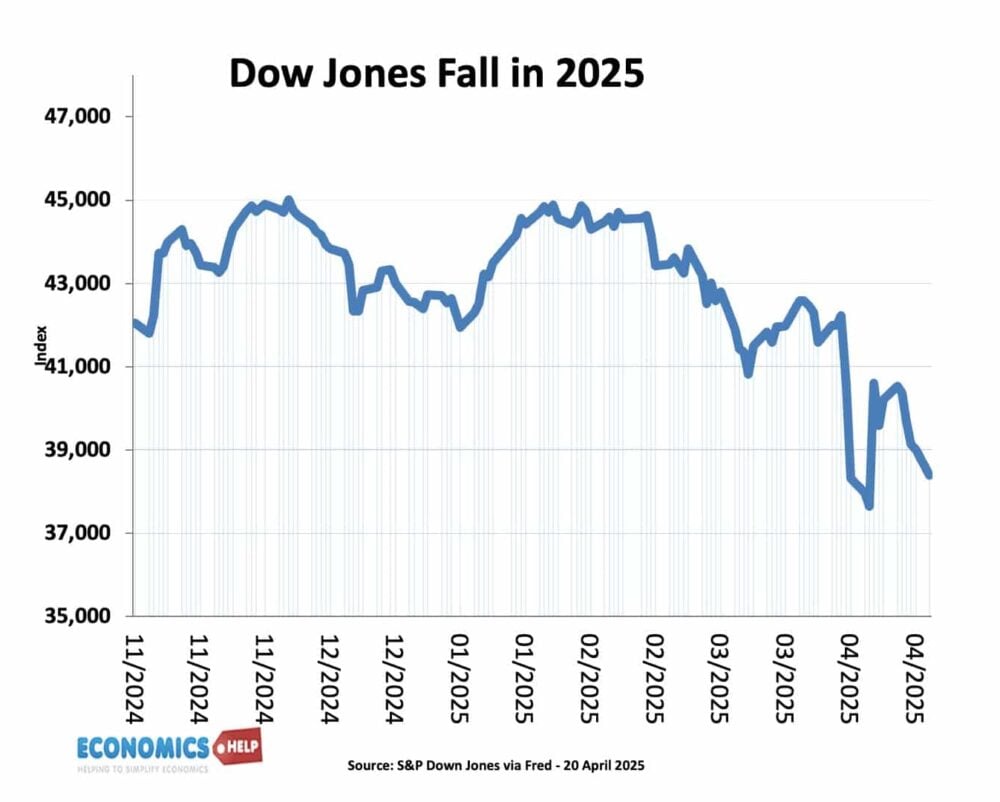
The question of how much lower the stock market will go is perhaps the most pressing concern for investors navigating today’s volatile financial landscape. Market downturns, whether they manifest as standard corrections or prolonged bear markets, evoke a primal sense of uncertainty. When red dominates the trading screens, the instinct to preserve capital often clashes with the desire to find a bottom. Understanding the trajectory of a falling market requires a multifaceted approach that combines macroeconomic analysis, technical indicators, and a deep dive into investor psychology. While no one possesses a crystal ball, historical patterns and current economic data provide a roadmap for where the floor might eventually be found.
Analyzing the Macroeconomic Catalysts for Downward Pressure
To understand how much lower the market might fall, one must first identify the forces pushing it down. In the current economic cycle, the primary antagonist has been the shift in monetary policy. For over a decade, investors were treated to a regime of low interest rates and high liquidity. As central banks, led by the Federal Reserve, pivoted toward tightening to combat inflation, the fundamental math of stock valuation changed.
The Persistence of Interest Rate Volatility
Interest rates are the gravity of the financial world. When rates rise, the present value of future corporate earnings decreases, which naturally compresses price-to-earnings (P/E) ratios. The market’s bottom is often tied to the “terminal rate”—the point at which the central bank stops raising rates. As long as there is uncertainty regarding the peak of the interest rate cycle, equity markets remain vulnerable. If inflation remains “sticky” and refuses to return to the target 2% range, the market may have significantly further to fall as investors price in a “higher for longer” interest rate environment.
Corporate Earnings and the Valuation Compression
The second macroeconomic pillar is corporate earnings. During the initial phases of a market decline, prices often drop because of valuation compression—investors simply aren’t willing to pay as much for a dollar of profit. However, the second leg of a potential downward move usually stems from an “earnings recession.” If consumer spending slows and corporate margins are squeezed by rising input costs, earnings estimates must be revised downward. If the consensus earnings per share (EPS) for major indices like the S&P 500 begins to drop significantly, the stock market could see a secondary wave of selling that takes indices to new lows before a recovery is possible.
Historical Precedents and the Anatomy of a Bear Market
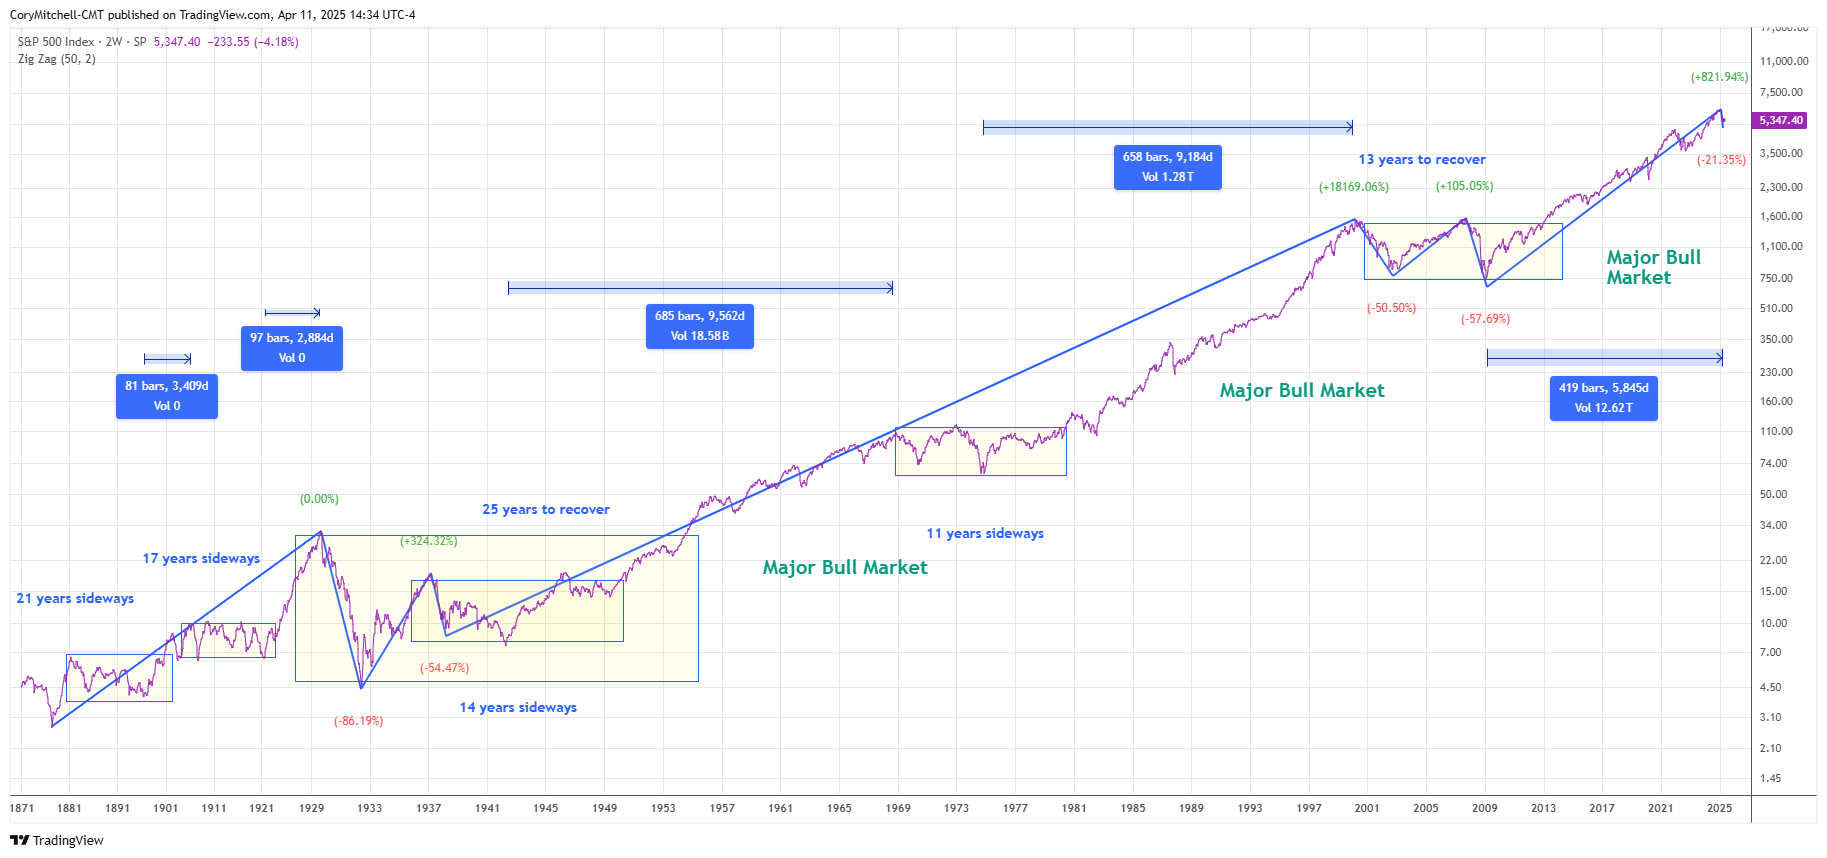
History does not repeat itself, but it often rhymes. By looking at previous market cycles, investors can gain perspective on the potential depth of the current decline. Historically, the average bear market (defined as a drop of 20% or more) lasts about 289 days and results in an average loss of roughly 33%. If the current downturn is a result of a standard economic contraction, these figures provide a baseline for expectations.
Differentiating Between Correction and Recessionary Troughs
It is vital to distinguish between a “non-recessionary” bear market and a “recessionary” one. History shows that when the economy manages to avoid a formal recession, market bottoms tend to be shallower, often finding support around the 20% to 24% decline mark. However, if a full-scale recession occurs, the market has historically dropped closer to 35% or even 50% in extreme cases like 2008 or 2000. Therefore, the answer to “how much lower” is inextricably linked to the Gross Domestic Product (GDP) data. If the labor market remains resilient, the “soft landing” scenario could mean we are already near the bottom. If unemployment begins to spike, the market likely has another 10% to 15% of downside to explore.
Standard Deviation and Historical Support Levels
Technical analysts often look at “mean reversion” to predict where a market might stop falling. Over long periods, the stock market tends to return to its long-term trend line. During the speculative heights of recent years, many indices became disconnected from these trends. A return to the 200-week moving average is a common occurrence during significant market resets. For many major indices, this moving average has historically served as a “line in the sand.” If the market breaches this level and stays below it, it signals a deeper structural shift in the economy, suggesting that the “lower” could be much further than anticipated.
Sentiment Indicators: When Fear Overwhelms Fundamentals
Markets are driven by more than just spreadsheets; they are driven by human emotion. Fear and greed often push prices far beyond their fair value in both directions. To find the bottom, one must often look for “capitulation”—the moment when the last remaining bulls give up and sell their positions in a panic.
The Volatility Index (VIX) as a Contrarian Signal
The CBOE Volatility Index, or VIX, is often referred to as the “fear gauge.” Historically, market bottoms are associated with a “spike” in the VIX, often reaching levels above 30 or 40. A slow, grinding decline without a spike in volatility often suggests that the selling is not yet over. When the VIX reaches extreme highs, it typically indicates that the maximum amount of fear is priced in. For the contrarian investor, this is often the signal that the market has gone as low as it likely will in the short term, as there are few sellers left to push prices further down.
Searching for Market Capitulation
Capitulation is characterized by heavy trading volume on a sharp downward move, followed by a period where the market refuses to go lower despite bad news. This “exhaustion” of sellers is a prerequisite for a sustainable bottom. If the market continues to react violently to every negative headline, it is a sign that the bottom is not yet in. We will know we are reaching the end of the decline when “bad news is good news”—meaning the market has already priced in the worst-case scenario and begins to look forward to the eventual recovery.
Tactical Shifts for the Individual Investor
While trying to predict the exact bottom is a tempting game, it is notoriously difficult even for professional fund managers. For the individual investor focused on personal finance and long-term wealth, the question of “how much lower” should be met with a tactical strategy rather than a defensive retreat.
The Power of Dollar-Cost Averaging in a Downturn
Rather than trying to time a single entry point, savvy investors utilize dollar-cost averaging (DCA). By investing a fixed amount of money at regular intervals, you naturally buy more shares when prices are low and fewer when prices are high. This strategy mitigates the risk of “catching a falling knife”—buying a stock as it crashes only for it to fall another 20%. If the market does go lower, the DCA practitioner views it as an opportunity to lower their average cost basis, which accelerates wealth creation once the market eventually turns.
Seeking Quality and Defensive Positioning
In a falling market, not all stocks are created equal. Growth stocks with no earnings are often the first to be discarded. To survive the trip to the bottom, investors often rotate into “defensive” sectors such as healthcare, consumer staples, and utilities. These companies provide essential services and often maintain steady dividends, providing a “buffer” against price depreciation. Analyzing the “quality” of a balance sheet—specifically looking at low debt-to-equity ratios and strong free cash flow—is the best way to ensure that the assets you hold will actually survive to see the next bull market.
Conclusion: Recognizing the Pivot Point
The stock market will stop going lower when the collective consensus of investors believes that all potential risks have been accounted for in current prices. This pivot point rarely happens when the news is good; in fact, the market usually bottoms when the news is at its absolute worst. This is the paradox of investing: the greatest opportunities arise when the outlook appears most bleak.
To determine if we are near that point, watch for a stabilization in interest rates, a leveling off of earnings revisions, and a peak in the VIX. While the market could certainly go lower in the short term due to geopolitical shocks or unexpected economic data, the long-term trajectory of the equity market remains upward. For the disciplined investor, the question shouldn’t be “how much lower will it go,” but rather “am I prepared to take advantage of the prices when it gets there?” By focusing on fundamentals and maintaining a long-term horizon, the temporary pain of a falling market becomes the foundation for future financial independence.
aViewFromTheCave is a participant in the Amazon Services LLC Associates Program, an affiliate advertising program designed to provide a means for sites to earn advertising fees by advertising and linking to Amazon.com. Amazon, the Amazon logo, AmazonSupply, and the AmazonSupply logo are trademarks of Amazon.com, Inc. or its affiliates. As an Amazon Associate we earn affiliate commissions from qualifying purchases.