
Navigating the financial markets requires a blend of data-driven analysis and psychological fortitude. For many investors, the central question of the current cycle—”how much is the market down this year”—is less about a single percentage point and more about the underlying narrative of the global economy. To understand the current state of the market, one must look beyond the surface-level fluctuations of the S&P 500 and delve into the macroeconomic pressures, sector rotations, and historical precedents that are shaping the current financial landscape.
Analyzing the Benchmark Indices: A Year of Volatility
When investors ask how much the market is down, they are typically referring to the three major U.S. indices: the S&P 500, the Nasdaq Composite, and the Dow Jones Industrial Average. Each of these benchmarks tells a different story about the health of the economy and the appetite for risk.
The S&P 500: The Broad Market Pulse
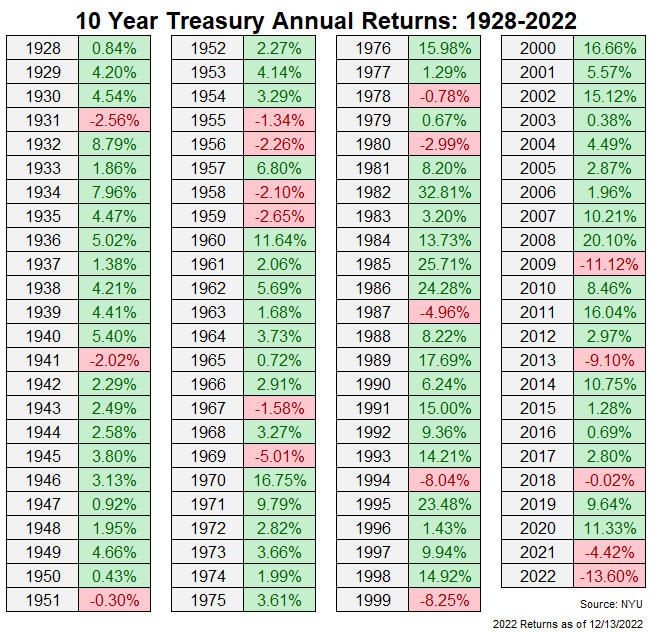
The S&P 500, representing the 500 largest publicly traded companies in the United States, is widely considered the most accurate barometer of the overall market. Throughout this year, the S&P 500 has faced significant headwinds. While there have been periods of “bear market rallies” where the index reclaimed lost ground, the overarching trend has been defined by caution. The index’s performance this year reflects a repricing of risk as the era of “easy money” and zero-interest-rate policy (ZIRP) comes to an end.
The Nasdaq Composite: The Tech Sector Struggle
The tech-heavy Nasdaq has traditionally been the hardest hit during periods of rising interest rates. Because many technology and growth companies rely on future earnings to justify high valuations, higher discount rates make those future cash flows less valuable today. Consequently, the Nasdaq has frequently outpaced the broader market on the downside this year. Investors have seen a dramatic shift from “growth at any price” to a demand for profitability and strong balance sheets.
The Dow Jones Industrial Average: Relative Stability
The Dow, which consists of 30 “blue-chip” industrial and value-oriented stocks, has historically shown more resilience during market contractions. Because the Dow is price-weighted and leans heavily toward established companies with consistent dividends and cash flows, it often experiences shallower drawdowns than its counterparts. Monitoring the divergence between the Dow and the Nasdaq provides insight into whether investors are seeking safety in defensive sectors or continuing to speculate on high-growth assets.
The Macroeconomic Catalysts Fueling Market Contraction
Understanding why the market is down requires an examination of the macroeconomic forces at play. This year, a “perfect storm” of economic factors has converged to create an environment of heightened uncertainty.
Inflation and the Federal Reserve’s Response
The primary driver of market volatility this year has been the persistence of inflation. As the Consumer Price Index (CPI) reached multi-decade highs, the Federal Reserve was forced to abandon its “transitory” narrative and embark on one of the most aggressive interest rate hiking cycles in history. Every basis point increase in the federal funds rate puts downward pressure on stock valuations and increases the cost of borrowing for corporations and consumers alike.
Quantitative Tightening and Liquidity Constraints
In addition to raising rates, the Federal Reserve has been reducing its balance sheet through quantitative tightening (QT). This process effectively removes liquidity from the financial system. For years, the market was buoyed by an abundance of liquidity, which drove asset prices to record highs. As that liquidity is drained, the “tide goes out,” revealing which companies were reliant on cheap capital to survive.
Geopolitical Tensions and Supply Chain Disruptions
Global events continue to cast a shadow over domestic markets. Conflict in Europe, ongoing supply chain bottlenecks in Asia, and fluctuating energy prices have contributed to a volatile environment for global trade. For multi-national corporations, these factors lead to increased input costs and currency fluctuations, both of which eat into profit margins and contribute to downward pressure on stock prices.
Sector Performance: Winners, Losers, and Defensive Plays
The headline number of “how much the market is down” often masks the significant dispersion happening beneath the surface. Not all sectors are created equal, and this year has seen a massive rotation of capital.
The Energy Sector Outperformance
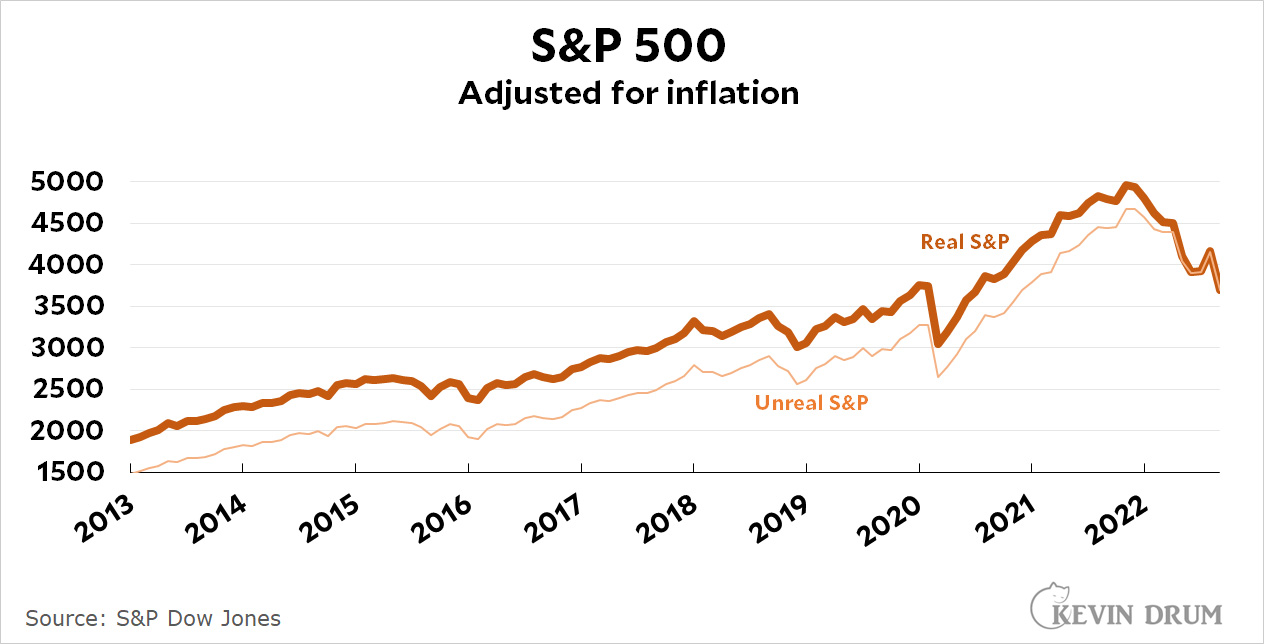
While the broader indices have struggled, the energy sector has often moved in the opposite direction. Driven by supply constraints and rebounding demand, energy stocks have provided a rare bright spot for many portfolios. This inverse correlation highlights the importance of sector diversification; an investor heavily weighted in tech would feel the market’s decline much more acutely than one with exposure to commodities and energy producers.
The Decline of Consumer Discretionary and Tech
On the other side of the spectrum, consumer discretionary and technology stocks have born the brunt of the sell-off. As inflation bites into the average household’s “disposable” income, companies that rely on non-essential spending have seen their earnings forecasts slashed. Similarly, the “stay-at-home” stocks that flourished during the pandemic have undergone a brutal valuation reset as consumer behavior normalizes.
Defensive Rotations into Utilities and Healthcare
In a down market, savvy investors often rotate into defensive sectors like utilities, healthcare, and consumer staples. These industries provide essential services that people need regardless of the economic climate. While these sectors may not offer the explosive growth of tech, their ability to maintain steady earnings and pay dividends makes them a vital “buffer” when the broad market is in retreat.
Investor Psychology and the Technical Indicators of a Bottom
The market is as much a psychological entity as it is a financial one. Determining how much lower the market can go involves looking at technical indicators and sentiment gauges that signal when “capitulation” has occurred.
The Role of Market Sentiment and the VIX
The CBOE Volatility Index, or VIX, is often referred to as the “fear gauge.” When the VIX spikes, it indicates that investors are paying a premium for protection against further declines. High levels of fear are often a contrarian indicator; historically, some of the best buying opportunities occur when blood is in the streets and sentiment is at its nadir.
Moving Averages and Support Levels
Technical analysts look at moving averages (such as the 50-day and 200-day) to determine the long-term trend of the market. When an index breaks below these key support levels, it can trigger algorithmic selling, accelerating the downside. Conversely, finding a “floor” at historical support levels can provide the foundation for a sustainable recovery.
The Concept of a “Soft Landing” vs. Recession
Much of the market’s performance for the remainder of the year hinges on whether the Federal Reserve can achieve a “soft landing”—taming inflation without plunging the economy into a deep recession. If investors believe a recession is inevitable, the market may retest previous lows. If inflation cools faster than expected, a “relief rally” could significantly change the year-to-date performance figures.
Actionable Strategies for Navigating a Down Market
For the individual investor, the current market environment demands a shift from passive observation to active risk management. Understanding the numbers is only useful if it informs a sound investment strategy.
The Power of Dollar-Cost Averaging
In a down market, dollar-cost averaging (DCA) becomes an investor’s greatest tool. By investing a fixed amount at regular intervals, you naturally buy more shares when prices are low and fewer shares when prices are high. This removes the emotional burden of trying to “time the bottom” and allows you to lower your average cost basis over time.
Rebalancing and Tax-Loss Harvesting
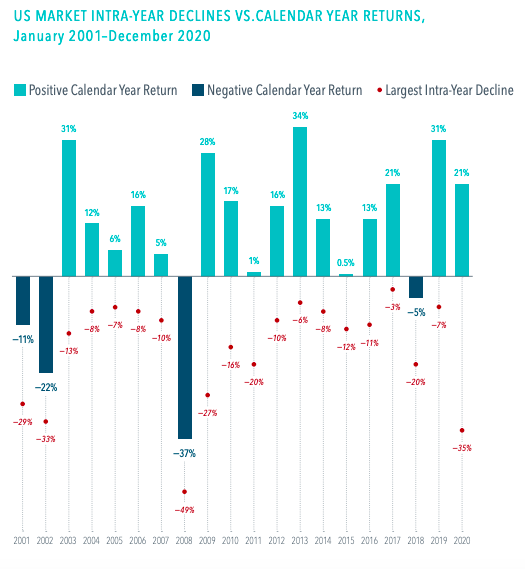
A market downturn is an ideal time to rebalance your portfolio to ensure your asset allocation remains aligned with your risk tolerance. Additionally, investors can utilize tax-loss harvesting—selling losing positions to offset capital gains and up to $3,000 of ordinary income. This strategy can turn a market loss into a tangible tax benefit, preserving more of your capital for future growth.
Focus on Quality and Cash Flow
In an era of high interest rates, “quality” is the name of the game. Investors should look for companies with low debt-to-equity ratios, strong free cash flow, and a history of increasing dividends. These companies are best positioned to weather an economic downturn and emerge stronger on the other side. Speculative bets on pre-revenue companies should generally be avoided until market liquidity improves.
The question of how much the market is down this year is a snapshot in time. For the long-term investor, these periods of contraction are not just challenges but opportunities to build positions in world-class companies at discounted valuations. By understanding the macroeconomic drivers, monitoring sector shifts, and maintaining a disciplined psychological approach, you can navigate the current volatility and position your portfolio for the eventual market cycle reversal. While the red numbers on the screen may be daunting, they are a natural part of the ebb and flow of a healthy, functioning capital market.
aViewFromTheCave is a participant in the Amazon Services LLC Associates Program, an affiliate advertising program designed to provide a means for sites to earn advertising fees by advertising and linking to Amazon.com. Amazon, the Amazon logo, AmazonSupply, and the AmazonSupply logo are trademarks of Amazon.com, Inc. or its affiliates. As an Amazon Associate we earn affiliate commissions from qualifying purchases.