
In the world of personal finance and institutional investing, few questions carry as much weight—or spark as much anxiety—as “how much has the stock market dropped?” For the seasoned investor, a market decline represents a period of strategic recalibration. For the novice, it can feel like a direct threat to their financial future. Understanding the magnitude of a market drop requires more than just looking at a single day’s closing numbers; it requires a deep dive into benchmarks, historical context, and the underlying economic catalysts that drive price action.

When we ask how much the market has dropped, we are usually referring to the performance of major indices like the S&P 500, the Dow Jones Industrial Average (DJIA), or the Nasdaq Composite. However, the answer is rarely a single percentage. It is a narrative of sector rotations, inflationary pressures, and the constant tug-of-war between “bulls” and “bears.”
Decoding the Current Market Performance: Benchmarks and Percentages
To accurately gauge how much the stock market has dropped, one must first identify which “market” they are measuring. The stock market is not a monolith; it is a collection of various sectors and company sizes that react differently to economic shifts.
The Big Three: S&P 500, Dow Jones, and the Nasdaq
The S&P 500 is generally considered the most accurate representation of the U.S. stock market, tracking 500 of the largest publicly traded companies. When analysts discuss market drops, they typically look at the S&P 500’s “peak-to-trough” decline. The Dow Jones, consisting of 30 industrial giants, tends to be less volatile, while the Nasdaq—heavily weighted in technology—often experiences much sharper drops during periods of rising interest rates.
Sector-Specific Declines: Tech vs. Value
Not all sectors bleed at the same rate. In recent market pullbacks, we have seen a stark divergence between “Growth” and “Value” stocks. Technology and discretionary sectors often lead the way down during a market drop because their valuations are based on future earnings, which become less valuable when interest rates rise. Conversely, defensive sectors like Utilities, Healthcare, and Consumer Staples may only see a fraction of the decline, acting as a stabilizer for diversified portfolios.
Year-to-Date vs. Historical Peaks
When assessing a drop, it is vital to distinguish between a Year-to-Date (YTD) decline and a drop from an all-time high. A market might be down 10% for the year but 15% from its record peak. Understanding this distinction helps investors manage their expectations regarding “recovery” timelines and whether the market is currently entering a “Correction” or a “Bear Market.”
Understanding the Mechanics: Why the Market Drops
A market drop is rarely a random event. It is usually the result of the collective psychology of millions of investors reacting to specific economic data points. To understand the “how much,” we must understand the “why.”
Inflation and the Federal Reserve’s Response
One of the primary drivers of significant market drops in the modern era is the cost of capital. When inflation rises, the Federal Reserve (or other central banks) raises interest rates to cool the economy. Higher rates make borrowing more expensive for companies, which can squeeze profit margins and lead to lower stock prices. The market often drops in anticipation of these rate hikes, reflecting a “risk-off” sentiment.
Geopolitical Uncertainty and Global Supply Chains
Markets thrive on predictability. When geopolitical tensions arise—whether through trade wars, regional conflicts, or global health crises—uncertainty spikes. This uncertainty causes institutional investors to move money out of “risky” assets like stocks and into “safe havens” like gold or government bonds. These mass migrations of capital are what cause the sharp, intraday drops that make headlines.
The Role of Algorithmic Trading and Margin Calls
In the digital age, a significant portion of market movement is driven by high-frequency trading algorithms. These programs are designed to sell when certain price levels are breached, which can accelerate a market drop. Furthermore, when the market drops significantly, investors who have borrowed money to buy stocks (trading on margin) may be forced to sell their positions to cover their losses, creating a “domino effect” that pushes prices even lower.
Historical Context: Putting Current Declines into Perspective
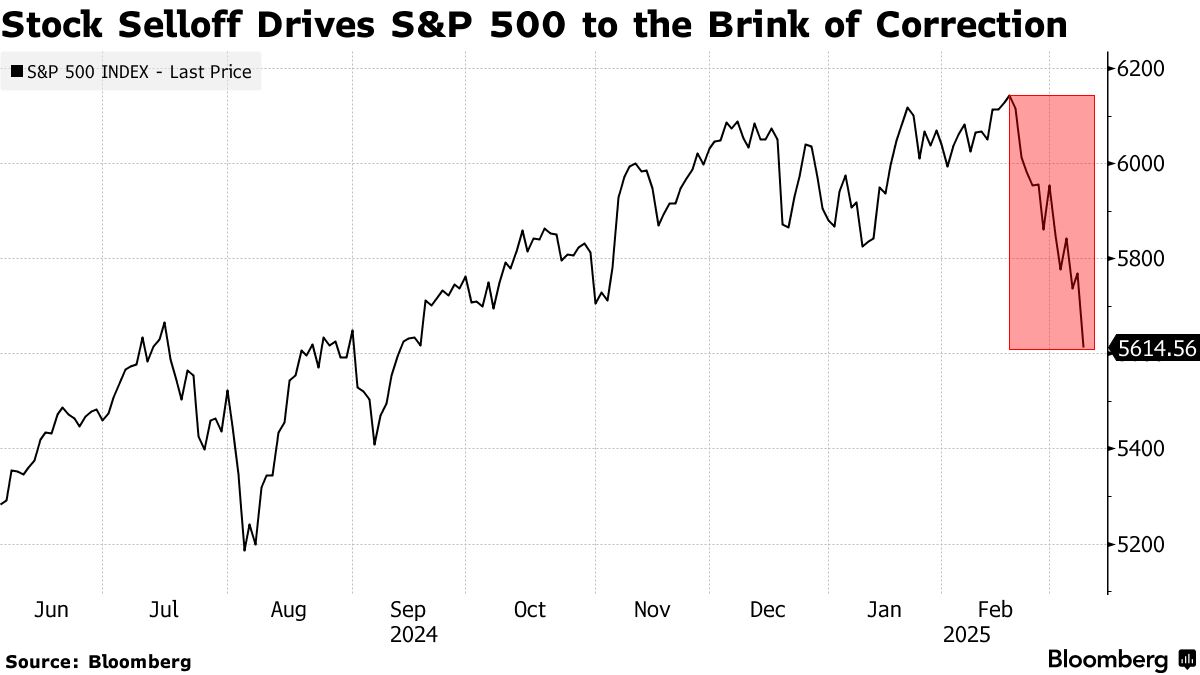
To answer how much the market has dropped effectively, we must compare current volatility to the historical record. History shows us that while market drops feel permanent in the moment, they are a natural and necessary part of the economic cycle.
Defining Corrections, Bear Markets, and Recessions
Financial professionals categorize drops by their severity. A “Correction” is defined as a decline of 10% to 20% from a recent peak. These occur, on average, once every one to two years. A “Bear Market” is a decline of 20% or more. While Bear Markets are more rare and painful, they are also the precursors to some of the strongest bull runs in history. A “Recession,” meanwhile, is a broader economic contraction that often accompanies a Bear Market but is measured by GDP rather than stock prices.
Comparing Modern Volatility to 2008 and 2020
When the market drops, investors often fear a repeat of the 2008 Financial Crisis (where the S&P 500 dropped over 50%) or the 2020 COVID-19 crash (a rapid 30% drop). However, most market drops are far less severe. By looking at the “Average Recovery Time,” we see that the market typically recovers from a 10% correction within a few months, whereas a full Bear Market recovery can take two years or longer.
The “Mean Reversion” Principle
Stock markets do not go up in a straight line forever. Periods of “exuberance”—where stock prices outpace company earnings—are almost always followed by a drop. This is known as “mean reversion.” Understanding that a drop is often just the market “resetting” to its long-term average can help investors maintain a professional and detached perspective during times of red ink.
Strategic Responses: Navigating the Downward Trend
Knowing how much the market has dropped is only useful if it informs your next move. For the savvy investor, a market drop is not a signal to panic, but a signal to execute a pre-determined plan.
The Power of Dollar-Cost Averaging
For those building long-term wealth, market drops are actually a mathematical advantage. Through Dollar-Cost Averaging (DCA), you invest a fixed amount of money at regular intervals. When the market drops, your fixed dollar amount buys more shares. Over time, this lowers your average cost basis, positioning you for massive gains when the market eventually swings back toward growth.
Portfolio Rebalancing and Tax-Loss Harvesting
A market drop is an ideal time to rebalance. If your target allocation is 70% stocks and 30% bonds, a significant stock market drop might leave you at 60/40. Rebalancing involves selling some bonds (which likely held their value) to buy stocks at a discount, returning your portfolio to its target risk level. Additionally, “Tax-Loss Harvesting” allows investors to sell losing positions to offset capital gains elsewhere, turning a market drop into a tax advantage.
Maintaining Emotional Discipline and “Dry Powder”
The biggest risk during a market drop isn’t the drop itself; it’s the investor’s emotional reaction. Selling at the bottom locks in losses and prevents the investor from participating in the eventual recovery. Professional investors often keep “dry powder”—cash reserves—specifically to deploy when the market drops, essentially “shopping” for high-quality companies at “clearance” prices.
Tools and Metrics to Track Future Movement
If you are tracking how much the market has dropped, you should also be tracking the metrics that suggest where it might go next. Using professional financial tools can take the guesswork out of market analysis.
The VIX (Fear Gauge) and Relative Strength Index (RSI)
The CBOE Volatility Index (VIX) measures market expectations of near-term volatility. A high VIX indicates high fear, which often coincides with the bottom of a market drop. Similarly, the Relative Strength Index (RSI) can tell you if a market is “oversold.” When the RSI drops below 30, it often suggests that the selling is overdone and a bounce may be imminent.
Fundamental Valuation: P/E Ratios
To see if a market drop is justified, look at the Price-to-Earnings (P/E) ratio. If the market has dropped 20% but company earnings have stayed the same, the market has become “cheaper” fundamentally. A lower P/E ratio across the S&P 500 often signals a buying opportunity for value-oriented investors.

Watching Technical Support Levels
Technical analysts look at “support levels”—price points where a stock or index has historically stopped falling and started rising. If the market drops to a major support level (like a 200-day moving average) and holds, it may indicate that the “how much” has reached its limit.
In conclusion, while “how much has the stock market dropped” is the question that captures the headlines, the more important question for your financial health is “how will I respond?” By understanding the benchmarks, the underlying causes, and the historical precedents of market declines, you can transform a period of market volatility into a strategic opportunity for long-term wealth creation. Market drops are the “price of admission” for the long-term gains that equity investing provides. Stay disciplined, stay diversified, and keep your eyes on the horizon.
aViewFromTheCave is a participant in the Amazon Services LLC Associates Program, an affiliate advertising program designed to provide a means for sites to earn advertising fees by advertising and linking to Amazon.com. Amazon, the Amazon logo, AmazonSupply, and the AmazonSupply logo are trademarks of Amazon.com, Inc. or its affiliates. As an Amazon Associate we earn affiliate commissions from qualifying purchases.