
Tesla, Inc. has carved out a unique position in the global economy, not just as an automotive manufacturer but as a technology and energy innovator. Its journey from a niche electric vehicle (EV) startup to a global powerhouse has been marked by audacious goals, technological breakthroughs, and, crucially, a dramatic evolution in its financial performance. When addressing the question, “how much does Tesla make a year?” it’s imperative to look beyond a single number. The concept of “making money” is multifaceted, encompassing total revenue, gross profit, net income, and free cash flow – each telling a distinct part of the company’s financial story and offering different insights for investors, analysts, and the curious public alike.
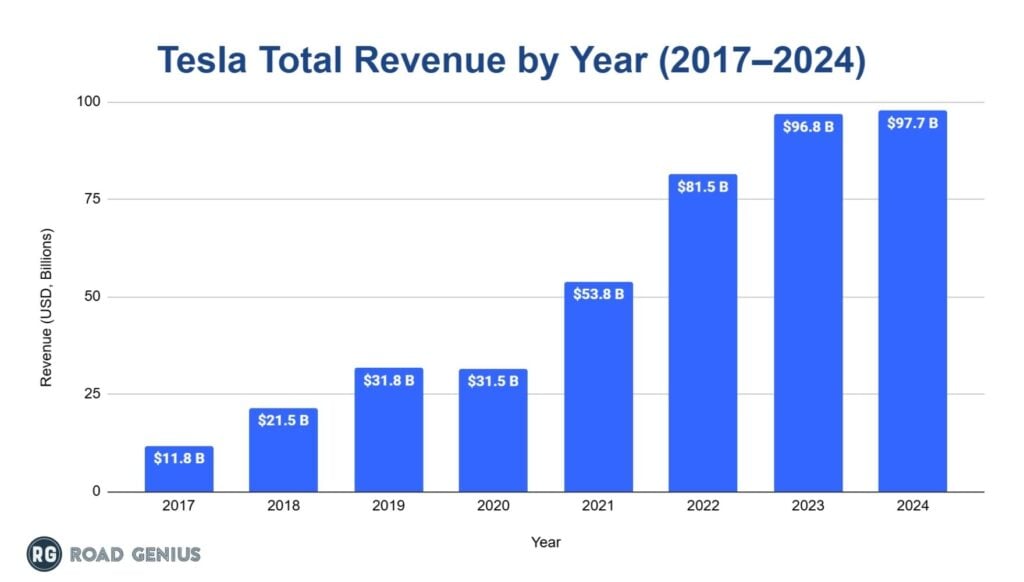
Understanding Tesla’s financial output requires a deep dive into its diverse revenue streams, cost structures, and capital allocation strategies. Unlike traditional automakers, Tesla’s financial narrative is heavily influenced by its forward-looking investments in AI, battery technology, and autonomous driving, alongside its rapidly expanding manufacturing footprint. This article will dissect these financial layers, providing a comprehensive overview of how Tesla generates and manages its formidable economic presence annually, viewed strictly through the lens of business finance.
Decoding Tesla’s Revenue Streams and Top-Line Growth
Tesla’s ability to generate significant annual revenue stems from several core business segments, primarily dominated by its automotive division but increasingly diversified by its energy and services offerings. The growth trajectory of these streams offers a clear picture of the company’s market penetration and expansion efforts.
Automotive Sales: The Core Business Engine
The vast majority of Tesla’s annual revenue is derived from the sale of its electric vehicles. This segment includes the Model S, Model X, Model 3, Model Y, and increasingly, the Cybertruck and Semi. The company’s strategy revolves around scaling production efficiently to meet surging global demand for EVs.
- Vehicle Deliveries and Pricing: Tesla’s financial reports meticulously detail global vehicle deliveries, a key indicator of sales volume. The average selling price (ASP) of its vehicles, influenced by model mix, feature adoption (like Full Self-Driving capabilities), and regional pricing adjustments, directly impacts the top-line revenue. As Tesla has expanded its product line from luxury sedans to more mass-market vehicles (Model 3 and Model Y), it has been able to significantly boost unit sales, even while sometimes experiencing fluctuations in ASP.
- Geographical Expansion: A substantial portion of Tesla’s revenue growth in recent years has come from its aggressive international expansion. The establishment of Gigafactories in Shanghai, Berlin, and Texas not only increases production capacity but also allows the company to localize manufacturing, reduce logistics costs, and penetrate new markets more effectively. Each new factory contributes directly to the annual revenue generation by facilitating higher vehicle deliveries.
- Market Share and Competition: Tesla’s market share in the EV space, while facing increasing competition from traditional automakers and new EV entrants, remains significant. Its ability to maintain demand and pricing power against rivals is crucial for sustaining its automotive revenue growth year over year.
Energy Generation & Storage: A Growing Diversifier
Beyond electric vehicles, Tesla has a substantial, though smaller, revenue stream from its energy products. This segment is key to its mission of accelerating the world’s transition to sustainable energy and acts as a significant diversifier for its overall financial health.
- Solar Products: This includes Solar Roof and traditional solar panels for residential and commercial customers. While once a smaller contributor, Tesla’s continued development in this area aims to integrate solar generation seamlessly with its battery storage solutions.
- Battery Storage Solutions: The Powerwall (residential), Powerpack (commercial), and especially the Megapack (utility-scale) are critical components of this segment. These large-scale battery systems provide grid stability, support renewable energy integration, and offer significant revenue potential as global energy infrastructure evolves. The demand for grid-scale storage solutions has been a particular area of growth, contributing increasingly to the annual top line.
- Synergies with Automotive: The energy segment benefits from Tesla’s core battery technology expertise, creating cost efficiencies and technological advantages that enhance both product lines. As the world moves towards decentralized energy systems, this segment is poised for substantial future revenue growth.
Services & Other: The Supporting Pillars
This category encompasses a range of activities that support Tesla’s primary businesses and also generate recurring revenue.
- Supercharging Network: While often viewed as an operational cost or a customer perk, the Supercharging network generates revenue from usage, especially as Tesla opens it to non-Tesla EVs. This represents a growing ancillary revenue stream.
- Vehicle Service and Maintenance: Post-sale service, warranty work, and repairs contribute to this segment. As Tesla’s fleet size grows, so does the demand for these services, ensuring a steady, recurring income stream.
- Full Self-Driving (FSD) Subscriptions: The highly anticipated FSD software, offered as an upfront purchase or a monthly subscription, represents a significant potential high-margin revenue stream. As the technology matures and regulatory frameworks evolve, FSD monetization could dramatically boost annual services revenue.
- Merchandise and Accessories: Smaller but consistent revenue is also generated from branded merchandise, vehicle accessories, and upgrades.
Regulatory Credits: A Unique Revenue Contributor
For many years, and particularly in its earlier stages of profitability, regulatory credits were a distinct and often high-margin revenue stream for Tesla. These credits, primarily Zero Emission Vehicle (ZEV) credits, are earned by manufacturers who produce more EVs than mandated by certain governments (like in California) and can then be sold to other automakers who don’t meet their targets.
- Impact on Profitability: While not directly tied to vehicle sales or energy products, these credits significantly bolstered Tesla’s annual net income, especially when the company was scaling production and facing initial losses. As other automakers increase their EV production, the market for these credits may shrink, but they have historically been a notable financial booster.
- Reporting: Tesla reports these sales separately, highlighting their contribution to overall profitability. Understanding this unique revenue source is crucial for a complete picture of how much Tesla “makes.”
From Revenue to Profitability: Tesla’s Bottom Line
While total revenue provides a sense of scale, profitability metrics indicate how efficiently Tesla converts its sales into actual earnings. Analyzing gross profit, operating expenses, and net income reveals the true financial health and operational efficiency of the company annually.
Gross Profit and Margins: The First Cut
Gross profit is the revenue remaining after subtracting the cost of goods sold (COGS). The gross margin (gross profit as a percentage of revenue) is a critical indicator of a company’s manufacturing efficiency and pricing power.
- Automotive Gross Margin: Tesla’s automotive gross margins have been a key focus for investors. These margins are influenced by production efficiency, economies of scale from Gigafactories, battery cost reductions, and the mix of vehicles sold (e.g., higher-margin Model S/X vs. lower-margin Model 3/Y, and the impact of FSD sales). In recent years, Tesla has demonstrated its ability to achieve industry-leading gross margins, even amid supply chain challenges.
- Energy and Services Margins: The energy and services segments typically have different margin profiles. Energy storage can be capital-intensive, while software subscriptions (like FSD) offer very high margins once development costs are amortized. The blended gross margin reflects the overall efficiency of all segments.
- Factors Influencing Margins: Commodity prices (lithium, nickel), labor costs, logistics, factory utilization rates, and technological advancements (e.g., new battery architectures like 4680 cells) all play a significant role in determining Tesla’s annual gross profit.
Operating Expenses: Investing in the Future
Beyond the direct costs of production, Tesla incurs substantial operating expenses, which fall mainly into research and development (R&D) and selling, general, and administrative (SG&A) costs.
- Research & Development (R&D): Tesla heavily invests in R&D, reflecting its commitment to innovation. This includes funding for battery technology, AI for autonomous driving, new vehicle platforms, and advanced manufacturing processes. These investments are crucial for long-term growth but impact annual operating profit.
- Selling, General & Administrative (SG&A): This category includes marketing, sales (Tesla’s direct-to-consumer model means less traditional advertising but costs for showrooms and service centers), executive salaries, and corporate overhead. As the company scales, SG&A costs might increase in absolute terms but ideally decrease as a percentage of revenue, indicating improved operational leverage.
- Stock-Based Compensation: A notable component of Tesla’s operating expenses is stock-based compensation, particularly for its CEO, Elon Musk, tied to ambitious performance milestones. While non-cash, it impacts reported earnings and can be substantial.
Net Income and Earnings Per Share (EPS): The Bottom Line
Net income, or profit, is what’s left after all expenses, including taxes and interest, have been deducted from total revenue. Earnings Per Share (EPS) divides net income by the number of outstanding shares, offering a per-share measure of profitability.
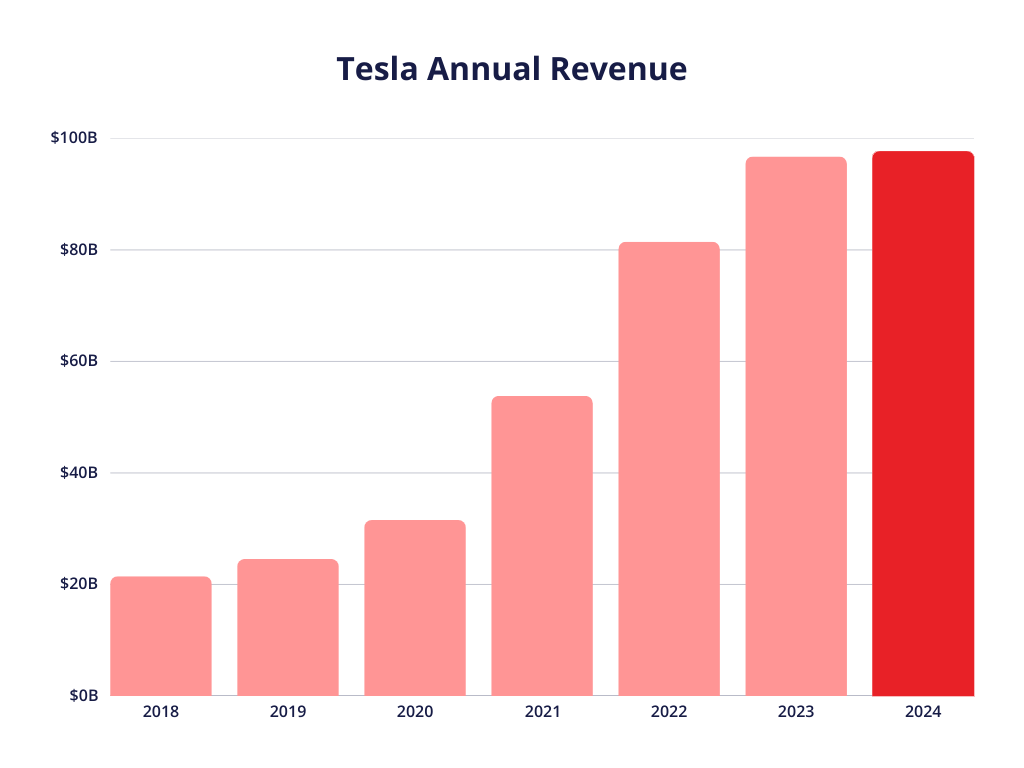
- Consistent Profitability: After years of volatility, Tesla has demonstrated consistent quarterly and annual profitability in recent years. This shift from a growth-at-any-cost model to sustained positive net income is a critical financial milestone.
- Growth in Net Income: Tesla’s annual net income has often shown impressive year-over-year growth, driven by increasing vehicle deliveries, improved margins, and careful cost management. This growth is essential for investor confidence.
- Impact of Non-Operating Items: Net income can also be influenced by non-operating items such as interest income/expense, gains or losses from investments (e.g., Bitcoin holdings), and tax provisions. These factors can introduce variability into the annual net income figure.
Cash Flow and Financial Health: Beyond Profit
While profit is important, cash flow provides an even clearer picture of a company’s liquidity and financial health. A profitable company can still face cash shortages if it’s not effectively managing its cash flows.
Operating Cash Flow: The Lifeblood of the Business
Operating cash flow (OCF) measures the cash generated from a company’s normal business operations. It shows how much cash a company generates from its core products or services before accounting for investments or financing.
- Strong OCF: Tesla’s operating cash flow has seen significant growth, indicating its core businesses are generating substantial cash. This cash is vital for reinvestment, debt reduction, and maintaining liquidity.
- Working Capital Management: Efficient management of working capital (e.g., inventory levels, accounts receivable, accounts payable) plays a crucial role in optimizing operating cash flow. Tesla’s vertically integrated model and direct sales approach help manage some of these aspects effectively.
Capital Expenditures: Fueling Future Expansion
Capital expenditures (CapEx) are funds used by a company to acquire, upgrade, and maintain physical assets such as buildings, factories, and equipment. For a growth company like Tesla, CapEx is a significant outflow of cash.
- Gigafactory Investments: A large portion of Tesla’s annual CapEx goes into building new Gigafactories around the world and expanding existing ones. These investments are critical for increasing production capacity and meeting future demand.
- Infrastructure Development: Investment in the Supercharger network, service centers, and R&D facilities also falls under CapEx. These expenditures are necessary to support the growing fleet and product pipeline.
- Balancing Growth and Cash: Tesla must carefully balance aggressive CapEx spending to fuel growth with maintaining a healthy cash balance. Rapid expansion can strain cash reserves, making strong operating cash flow even more critical.
Free Cash Flow: The Investor’s Perspective
Free cash flow (FCF) is the cash a company generates after accounting for cash outflows to support operations and maintain its capital assets. FCF is a crucial metric for investors as it represents the cash available to pay down debt, return capital to shareholders (dividends or buybacks, though Tesla historically hasn’t paid dividends), or pursue new growth opportunities without external financing.
- Positive and Growing FCF: Tesla’s ability to generate consistently positive and growing free cash flow in recent years is a testament to its operational maturity and financial strength. It signifies that the company can fund its ambitious growth plans internally.
- Financial Flexibility: A strong FCF position gives Tesla considerable financial flexibility, reducing its reliance on debt or equity issuance to fund its expansion.
Key Financial Metrics and Investor Insights
Beyond the raw numbers, several financial ratios and metrics offer a comparative and analytical view of Tesla’s annual performance, essential for potential and existing investors.
Profitability Ratios
- Net Profit Margin: This ratio (net income / revenue) shows how much profit Tesla makes for every dollar of revenue. A rising margin indicates improved efficiency.
- Return on Equity (ROE): ROE measures the return generated on shareholders’ equity, indicating how effectively Tesla uses shareholder investments to generate profits.
Valuation Metrics
- P/E Ratio (Price-to-Earnings): While often high for growth stocks like Tesla, the P/E ratio compares the stock price to EPS. A high P/E suggests investors have strong growth expectations.
- Market Capitalization: Tesla’s market cap, often fluctuating dramatically, reflects the market’s collective valuation of the company annually, often far exceeding traditional automakers due to its perceived growth potential and technological edge.
Debt and Liquidity
- Cash and Equivalents: Tesla’s annual balance sheet shows its cash reserves, which are critical for navigating economic downturns and funding operations.
- Debt Levels: Monitoring Tesla’s long-term debt helps assess its financial leverage and risk profile. Its ability to generate strong cash flow has allowed it to manage debt effectively.
The Future of Tesla’s Financial Performance
Looking ahead, Tesla’s annual financial performance will continue to be shaped by a confluence of internal strategies and external market dynamics.
Growth Drivers and Challenges
- New Products and Markets: The successful scaling of Cybertruck production, the introduction of a more affordable EV model, and deeper penetration into emerging markets are key growth drivers.
- FSD Monetization: The evolution and widespread adoption of Full Self-Driving technology could unlock substantial, high-margin software revenue.
- Battery Technology: Continuous innovation in battery technology (e.g., cost reduction, energy density improvements) will enhance vehicle performance and profitability.
- Competition: Increased competition from legacy automakers and new EV players will put pressure on market share and potentially margins.
- Supply Chain and Macroeconomics: Global supply chain resilience, commodity price volatility, and macroeconomic conditions (interest rates, consumer spending) will continue to influence annual financial outcomes.

Analyst Expectations and Market Outlook
Financial analysts and institutional investors closely track Tesla’s quarterly and annual reports, providing projections for revenue, earnings, and cash flow. These expectations significantly influence market sentiment and stock valuation. The market often values Tesla based on its future potential rather than just its current year’s earnings, reflecting its status as a disruptive innovator.
In conclusion, “how much does Tesla make a year?” is a question best answered by examining a spectrum of financial indicators. From its massive revenue generated primarily by automotive sales and increasingly supported by its energy and services divisions, through to its impressive gross and net profitability, and robust cash flow generation, Tesla has transformed into a financial titan. Its financial journey is a complex interplay of aggressive growth investments, operational efficiencies, and a unique business model that continues to redefine expectations for an automotive and technology company. For anyone tracking the global financial landscape, understanding the intricate layers of Tesla’s annual financial performance offers a compelling case study in modern business finance.
aViewFromTheCave is a participant in the Amazon Services LLC Associates Program, an affiliate advertising program designed to provide a means for sites to earn advertising fees by advertising and linking to Amazon.com. Amazon, the Amazon logo, AmazonSupply, and the AmazonSupply logo are trademarks of Amazon.com, Inc. or its affiliates. As an Amazon Associate we earn affiliate commissions from qualifying purchases.