
In the dynamic world of finance, the question “how much did the stock market go down today?” is a common one, often voiced with a mix of anxiety, curiosity, and a keen desire to understand the immediate state of one’s investments. Daily fluctuations are an inherent characteristic of the stock market, driven by an intricate web of economic data, corporate news, geopolitical events, and ever-shifting investor sentiment. While a single day’s dip can understandably cause concern, a comprehensive understanding requires looking beyond the immediate numbers to grasp the underlying mechanisms and broader implications. This article will delve into how to interpret daily market movements, the factors that influence them, and crucially, how investors can intelligently navigate periods of volatility to safeguard and grow their financial future.

Deciphering Daily Market Movements: More Than Just a Number
Understanding how much the stock market moved on any given day isn’t as simple as glancing at a headline figure. It involves recognizing which metrics are most relevant and what they truly represent within the larger economic landscape. The “stock market” isn’t a single entity but a collection of exchanges where shares of publicly traded companies are bought and sold, and its performance is typically measured by key indices.
The Major Indices and What They Represent
When people refer to “the market,” they are usually thinking of a few prominent stock market indices, each tracking a different segment or breadth of the economy:
- Dow Jones Industrial Average (DJIA): Often simply called “the Dow,” this index tracks 30 large, publicly owned companies trading on the NASDAQ and the New York Stock Exchange. It’s a price-weighted average, meaning stocks with higher prices have a greater impact. While a historic benchmark, its narrow focus means it doesn’t always reflect the entire market.
- S&P 500 (Standard & Poor’s 500): Widely considered the best gauge of large-cap U.S. equities, the S&P 500 tracks 500 of the largest U.S. companies. It’s a market-capitalization-weighted index, meaning companies with larger market values have a greater influence. Its broad representation makes it a crucial indicator for institutional and individual investors alike.
- NASDAQ Composite: This index tracks all common stocks and similar securities listed on the NASDAQ stock market. It’s heavily weighted towards technology and growth companies, making it a key indicator for the tech sector’s health.
When one of these indices “goes down,” it signifies that the collective value of the companies within that index has decreased. The degree of that decline, however, requires further context.
Understanding Percentage Drops vs. Point Drops
A common pitfall is to focus solely on the absolute point drop of an index. For instance, a 500-point drop in the Dow Jones Industrial Average today sounds significant. However, without knowing the index’s starting value, this figure can be misleading. A 500-point drop when the Dow is at 10,000 points (5%) is far more impactful than a 500-point drop when it’s at 35,000 points (approx. 1.4%).
Percentage changes are therefore the more accurate and standardized way to measure market movements. They provide a clear, relative measure of how much an index (and by extension, the segment of the market it represents) has declined or gained, allowing for meaningful comparisons across different periods and indices.
What Drives Daily Volatility?
Daily market movements are rarely arbitrary. They are a complex interplay of numerous factors:
- Economic Data: Inflation reports, unemployment figures, GDP growth, consumer confidence indices, and manufacturing data can all trigger immediate market reactions. Better-than-expected data might lead to gains, while disappointing figures often result in downturns.
- Corporate Earnings and News: Individual company performance, especially for major constituents of an index, can have a ripple effect. Strong earnings reports can boost stock prices, while profit warnings or negative news (e.g., product recalls, regulatory issues) can cause sharp declines.
- Geopolitical Events: International conflicts, political instability, trade disputes, or significant policy changes in major economies can introduce uncertainty, leading investors to pull back from riskier assets.
- Central Bank Announcements: Decisions by central banks, particularly the U.S. Federal Reserve, regarding interest rates and monetary policy, are closely watched. Higher interest rates typically make borrowing more expensive, which can slow economic growth and reduce corporate profits, often leading to market corrections.
- Market Sentiment and Technical Factors: Sometimes, market movements are driven by pure sentiment – fear or greed – leading to herd behavior. Technical analysis, which studies past market data, also influences trading strategies and can contribute to short-term price swings.
The Immediate Impact of a Market Dip
When the stock market “goes down today,” the immediate effects can be felt across various levels, from individual portfolios to broader economic confidence. While a single day’s dip is rarely catastrophic in isolation, understanding its immediate ramifications is crucial.
For Individual Investors
For those with investments in stocks, mutual funds, or exchange-traded funds (ETFs), a market downturn directly translates to a decrease in their portfolio’s value. This can be emotionally challenging, especially for new investors or those nearing retirement. The psychological impact can be significant, leading to:
- Emotional Reactions: Fear often triggers panic selling, where investors sell their holdings at a loss, hoping to prevent further declines. This is almost universally advised against by financial experts, as it locks in losses and prevents participation in subsequent recoveries.
- Reduced Net Worth: While unrealized until assets are sold, the paper loss can affect an individual’s perceived financial security and future planning.
However, it’s also important to remember that for long-term investors, a daily dip is often a transient event. The market has historically recovered from every downturn, and these periods can present opportunities for strategic buying.
For Broader Economic Confidence
The stock market is often seen as a barometer of economic health, and a significant downturn can ripple through the broader economy:
- Consumer Spending: A decline in stock values can make consumers feel less wealthy, potentially leading to reduced spending on discretionary items. This “wealth effect” can slow economic growth.
- Business Investment: Companies, particularly those with publicly traded shares, may find it harder or more expensive to raise capital in a down market. This can lead to reduced investment in expansion, hiring, and research and development.
- Investor Sentiment: Prolonged market declines can erode investor confidence, making them more hesitant to invest, which can perpetuate a downward cycle.
Short-Term vs. Long-Term Perspective
The most critical distinction to make during a market dip is between short-term fluctuations and long-term trends. A single day, week, or even month of decline is typically a short-term event. True market corrections or bear markets, which are more significant and prolonged downturns, usually last for several months or even years.
For long-term investors with a diversified portfolio, daily market noise should be largely ignored. The focus should remain on their financial goals, investment horizon, and asset allocation strategy. Short-term traders, on the other hand, are highly attuned to daily movements, leveraging volatility for potential gains, though this strategy carries significantly higher risk.
Navigating Market Downturns: Strategies for Investors
Market downturns, while unsettling, are an inevitable part of the investment cycle. Rather than succumbing to panic, successful investors adopt a disciplined and strategic approach. These periods, often framed negatively, can actually present unique opportunities for those prepared to act rationally.
Avoid Emotional Decisions
The primary mistake investors make during a downturn is letting fear dictate their actions. Panic selling — liquidating investments because of a sharp drop — almost invariably locks in losses and prevents participation in the inevitable market recovery. History repeatedly demonstrates that markets rebound. A professional approach involves maintaining a cool head, revisiting your original investment thesis, and adhering to your long-term plan. Emotional trading is the enemy of wealth creation.
Reassess Your Risk Tolerance and Asset Allocation
A market dip is an excellent opportunity to honestly evaluate if your current portfolio still aligns with your personal risk tolerance and financial goals. If the recent decline has caused unbearable stress, it might be a sign that your asset allocation (the mix of stocks, bonds, and other assets) is too aggressive for your comfort level. Rebalancing your portfolio — selling some assets that have grown and buying more of those that have shrunk, or adjusting allocations to safer assets like bonds — can help bring your portfolio back in line with your risk profile. This process should be proactive, not reactive.
Diversification as Your Shield
One of the most fundamental principles of investing is diversification. Spreading your investments across various asset classes (stocks, bonds, real estate), different industries, company sizes (large-cap, mid-cap, small-cap), and geographical regions helps mitigate risk. When one sector or region underperforms, others may be performing well, thus cushioning the overall impact on your portfolio. During a downturn, a diversified portfolio tends to suffer less severe losses than a highly concentrated one.

Dollar-Cost Averaging: A Disciplined Approach
Dollar-cost averaging (DCA) is a strategy where an investor invests a fixed amount of money at regular intervals, regardless of the asset’s price. When prices are high, you buy fewer shares; when prices are low (during a downturn), you buy more shares for the same amount of money. This strategy reduces the average cost per share over time and removes the emotion of trying to “time the market,” which is notoriously difficult to do consistently. Market dips are precisely when DCA can be most effective, allowing investors to accumulate more assets at reduced prices.
Focus on Quality Companies
During periods of market stress, the disparity between strong, fundamentally sound companies and weaker ones often becomes more apparent. Focusing your investments on companies with solid balance sheets, consistent earnings growth, competitive advantages, and experienced management teams can be a wise strategy. These “quality” businesses are often better equipped to weather economic storms and recover more strongly when conditions improve. A downturn can be an opportunity to acquire shares in such companies at more attractive valuations.
The Power of Long-Term Investing
Perhaps the most reassuring strategy is to embrace a long-term investment horizon. Over extended periods (decades), the stock market has consistently generated positive returns, overcoming numerous recessions, market crashes, and geopolitical crises. Short-term volatility becomes mere noise when viewed through the lens of a 20- or 30-year investment plan. Compounding returns over the long term is a powerful force, and daily fluctuations are simply bumps on the road to significant wealth accumulation.
Tools and Resources for Tracking Market Performance
In an age of information overload, discerning reliable sources for tracking market performance and understanding financial news is paramount. Having the right tools and knowing where to look can empower investors to make informed decisions rather than reactive ones.
Reliable Financial News Sources
For up-to-the-minute, accurate, and in-depth financial reporting, certain media outlets stand out:
- Bloomberg: Known for its comprehensive global financial data, news, and analytics. It’s a go-to for professionals but also offers accessible content for individual investors.
- The Wall Street Journal (WSJ): A venerable institution offering detailed reporting on business, finance, and economic trends, often with insightful analysis.
- Reuters: Provides fast and impartial news across various sectors, including financial markets, with a global perspective.
- CNBC / Fox Business: These television networks offer real-time market commentary, interviews with industry experts, and breaking financial news. While dynamic, it’s essential to filter the constant stream for truly actionable insights.
- Yahoo Finance / Google Finance: These free online platforms offer real-time stock quotes, news feeds, company financials, and portfolio tracking tools, making them accessible resources for everyday investors.
Utilizing these sources helps investors stay informed about market movements, economic indicators, and corporate developments that might impact their portfolios.
Investment Platforms and Apps
Most modern brokerage firms and investment platforms offer sophisticated tools for tracking market performance and managing portfolios:
- Brokerage Account Dashboards: Platforms like Fidelity, Charles Schwab, Vanguard, E*TRADE, and TD Ameritrade (now Schwab) provide personalized dashboards where you can see your portfolio’s daily performance, analyze asset allocation, set up watchlists for specific stocks, and access research reports.
- Mobile Investment Apps: Apps from brokerages or independent platforms like Robinhood, Webull, M1 Finance, and Acorns offer convenient ways to monitor market activity, execute trades, and receive push notifications about significant market events. Many include charting tools and basic analytical features.
- Specialized Financial Tracking Apps: Apps like Personal Capital (now Empower) or Mint offer holistic financial views, integrating all your accounts (brokerage, banking, credit cards) to give you a complete picture of your net worth and investment performance.
These tools allow investors to move beyond just asking “how much did the market go down today” to understanding why it moved and how their own investments were affected, enabling more proactive portfolio management.
Consulting a Financial Advisor
For those who find navigating market volatility overwhelming or prefer professional guidance, consulting a qualified financial advisor is invaluable. A good advisor can:
- Provide Personalized Guidance: Help you assess your risk tolerance, set realistic financial goals, and create a tailored investment plan.
- Offer Expert Analysis: Translate complex market news and economic data into understandable implications for your portfolio.
- Manage Emotions: Act as a rational voice during periods of market stress, helping you avoid impulsive decisions.
- Rebalance and Optimize: Proactively adjust your portfolio to keep it aligned with your goals and risk profile, identifying potential opportunities during downturns.
While daily market fluctuations are an inescapable part of investing, leveraging reliable information and expert advice ensures that these movements are understood within a broader, strategic context.
The Broader Economic Context: Beyond “Today”
While the immediate question of “how much did the stock market go down today” focuses on a snapshot, true financial wisdom demands an understanding of the larger economic context. Daily movements are often symptoms of deeper economic trends and policy decisions that shape market cycles over the long run.
Leading Economic Indicators
A holistic view of the market requires monitoring key economic indicators that can signal future economic direction:
- Gross Domestic Product (GDP): The total value of goods and services produced, GDP is the primary measure of economic activity. Consistent growth is generally positive for corporate earnings and stock valuations.
- Inflation: The rate at which prices for goods and services are rising. High or persistent inflation can erode purchasing power, reduce corporate profit margins, and prompt central banks to raise interest rates, which can negatively impact stock valuations.
- Unemployment Rate: A measure of the percentage of the labor force that is jobless. Low unemployment generally indicates a strong economy and healthy consumer spending, though excessively low rates can sometimes fuel inflation.
- Interest Rates: Controlled by central banks, interest rates influence the cost of borrowing for businesses and consumers. Higher rates can slow economic activity and make bonds more attractive relative to stocks.
- Consumer Confidence and Manufacturing Indices: Surveys of consumer sentiment and manufacturing activity (like the ISM Purchasing Managers’ Index) offer forward-looking insights into economic momentum.
Understanding these indicators helps investors anticipate potential market shifts rather than just reacting to them.
The Role of Central Banks
Central banks, such as the U.S. Federal Reserve, play a pivotal role in influencing the economy and financial markets. Their primary tools include:
- Interest Rate Policy: By raising or lowering benchmark interest rates, central banks can either cool down an overheating economy (by making borrowing more expensive) or stimulate a sluggish one (by making borrowing cheaper). These decisions have profound effects on corporate profitability, consumer spending, and the relative attractiveness of different asset classes.
- Quantitative Easing (QE) / Quantitative Tightening (QT): These involve central banks buying (QE) or selling (QT) government bonds and other securities. QE injects liquidity into the financial system, lowering long-term interest rates and encouraging investment. QT does the opposite, removing liquidity and potentially raising rates. Both strategies directly impact market sentiment and asset valuations.
A market downturn might often be a reaction to perceived hawkish (tightening) central bank policies or concerns about their ability to manage inflation or recessionary pressures.
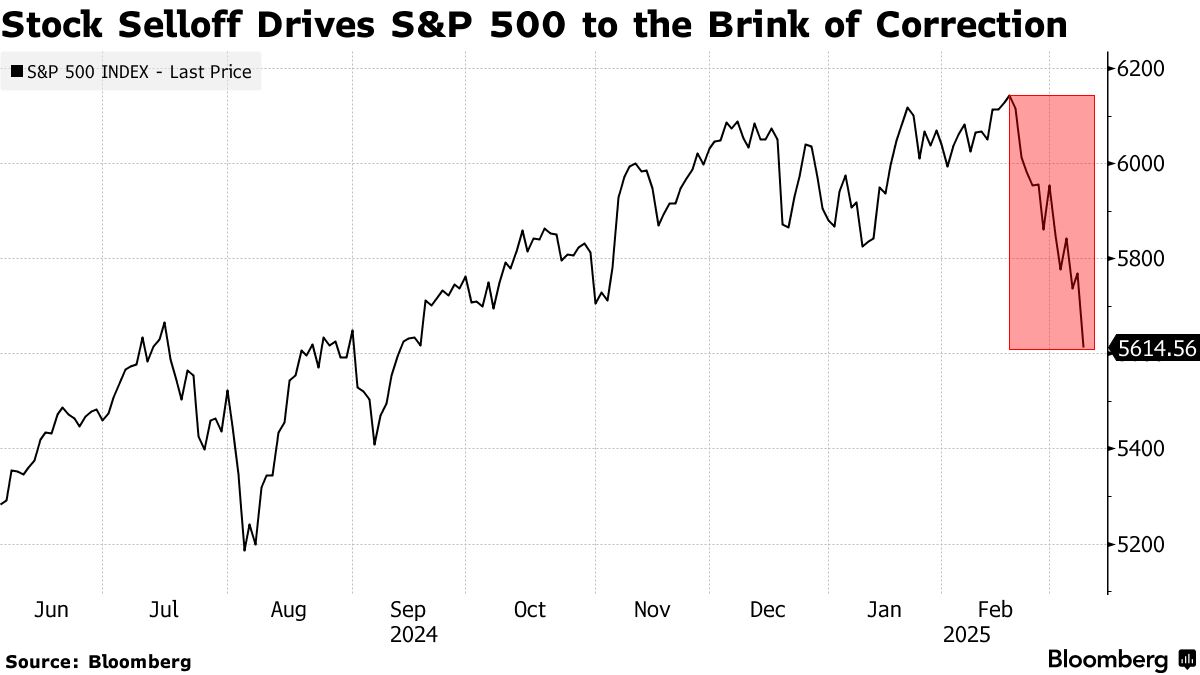
Historical Perspective on Market Cycles
The stock market doesn’t move in a straight line; it follows cycles. Understanding the historical patterns of bull markets (periods of sustained growth, typically 20% or more from a low) and bear markets (periods of sustained decline, typically 20% or more from a high) is crucial.
History shows that while bear markets can be painful, they are typically shorter than bull markets, and the market has always recovered and reached new highs over the long run. Every major downturn, from the Great Depression to the Dot-Com Bust to the 2008 Financial Crisis and the COVID-19 crash, has eventually been followed by a recovery and subsequent growth. This historical context offers a powerful antidote to short-term panic, reinforcing the wisdom of a long-term, disciplined investment approach.
In conclusion, while the immediate question “how much did the stock market go down today” is valid, its true value lies in prompting a deeper inquiry into the forces at play and the strategies available to investors. Daily fluctuations are normal, but informed decisions, diversification, a long-term perspective, and a readiness to learn are the cornerstones of successful financial navigation, regardless of the day’s market headlines.
aViewFromTheCave is a participant in the Amazon Services LLC Associates Program, an affiliate advertising program designed to provide a means for sites to earn advertising fees by advertising and linking to Amazon.com. Amazon, the Amazon logo, AmazonSupply, and the AmazonSupply logo are trademarks of Amazon.com, Inc. or its affiliates. As an Amazon Associate we earn affiliate commissions from qualifying purchases.