
The Financial Rollercoaster of a Tech Giant
The question “how much did Nvidia lose” is more nuanced than a simple balance sheet entry. For a company of Nvidia’s stature—a leading innovator in graphics processing units (GPUs) and a foundational player in AI computing—”loss” can refer to various financial metrics, each telling a different story about shareholder value, operational performance, or market perception. It could signify a drop in market capitalization, a quarter where earnings fell short of expectations, a period of declining revenue, or even substantial inventory write-downs. Understanding these different facets of “loss” is crucial for investors and financial observers attempting to grasp the complete picture of a company operating in a highly dynamic and often volatile technology sector.
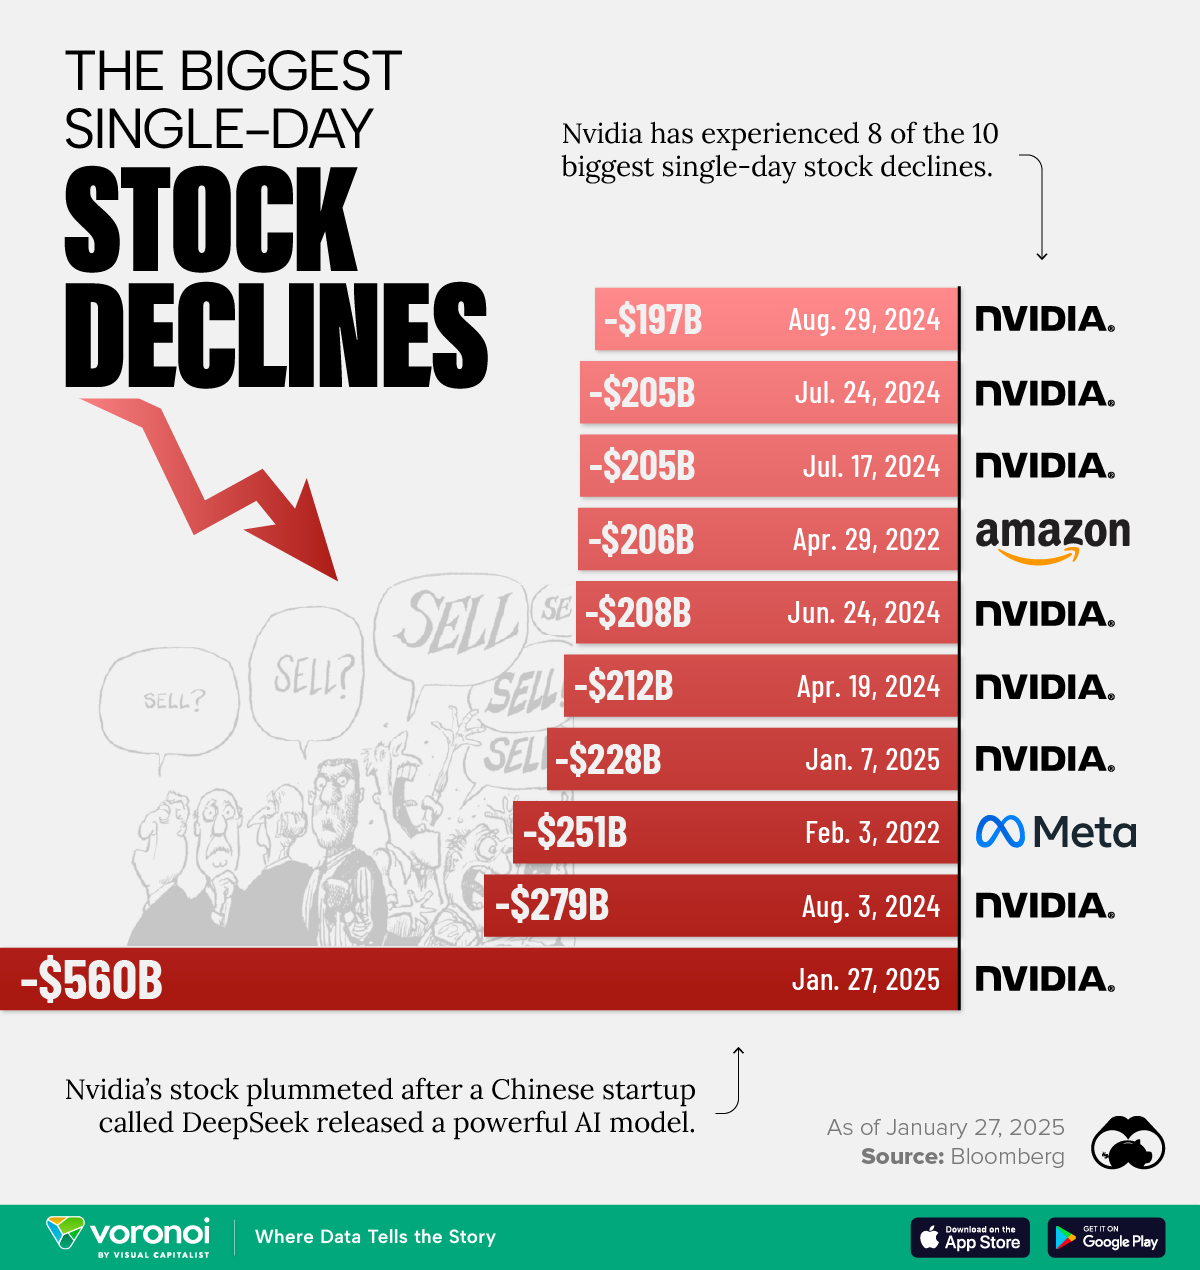
High-growth tech stocks, particularly those at the forefront of emerging technologies like AI, are inherently susceptible to significant fluctuations. Their valuations often bake in aggressive future growth expectations, making them sensitive to economic shifts, competitive pressures, and changes in investor sentiment. Nvidia’s journey, marked by both meteoric rises and noticeable pullbacks, exemplifies this characteristic volatility. The very nature of its innovation-driven business model means that its financial performance is often tied to cyclical demand, supply chain robustness, and the broader macroeconomic environment. While the company has demonstrated remarkable long-term growth, examining periods when its value or financial performance declined offers critical insights into the underlying drivers of business finance within the tech industry.
Nvidia’s unique market position, straddling multiple high-growth industries—gaming, professional visualization, data centers, and automotive AI—contributes both to its incredible potential and its inherent financial volatility. Its leadership in parallel computing and AI has propelled it to trillion-dollar valuations at times, yet this prominence also means it is under constant scrutiny. Any perceived weakness in one segment, or a broader market correction, can disproportionately impact its stock price and perceived value, leading to headlines that ponder “how much did Nvidia lose.” These periods of decline are not necessarily indicators of fundamental business failure but rather a natural part of the lifecycle for a company exposed to rapid technological change and market cycles.
Major Episodes of Shareholder Value Erosion
Nvidia’s financial history includes several distinct periods where significant shareholder value was eroded, often providing invaluable lessons in market dynamics and business resilience. These downturns highlight the multifaceted nature of financial risk, even for market leaders.
The 2018-2019 Crypto-Mining Bust: A Case Study in Inventory Glut
One of the most significant periods of financial setback for Nvidia occurred in late 2018 and extended into 2019, primarily due to the collapse of the cryptocurrency mining boom. During the preceding years, demand for Nvidia’s GPUs had surged, driven by miners using them to validate transactions on blockchain networks. This created an artificial spike in demand that masked underlying trends in other segments. When cryptocurrency prices crashed, the demand for mining-specific GPUs evaporated almost overnight.
This sudden downturn left Nvidia with a massive inventory surplus of gaming GPUs that had been diverted or overproduced to meet the mining demand. Retail channels were flooded with unsold cards, and the secondary market was saturated with used GPUs from former miners. The financial consequences were severe. Nvidia’s revenue guidance for its fiscal Q4 2019 (ending January 2019) was drastically cut, leading to a substantial stock price drop. The company reported a significant sequential revenue decline and took a charge for excess inventory. The gaming segment, typically a strong performer, saw a sharp contraction. Analysts and investors questioned the company’s ability to foresee and manage such a significant market shift, leading to considerable market capitalization losses over several quarters as the company worked to clear inventory and rebalance supply with actual demand. This period underscored the financial risks of over-reliance on a speculative market and the challenges of managing supply chains in volatile industries.
Navigating Macroeconomic Headwinds: Supply Chain and Inflationary Pressures
More recently, particularly throughout parts of 2022, Nvidia, along with many other tech companies, faced significant financial headwinds stemming from broader macroeconomic factors. High inflation rates, rising interest rates, and ongoing supply chain disruptions (exacerbated by geopolitical events and lingering effects of the pandemic) created a challenging operating environment. Consumer spending on discretionary items like high-end GPUs softened, and corporate IT spending faced increased scrutiny.
During this time, while Nvidia’s data center business remained robust due to AI growth, its gaming segment again experienced a downturn. Factors like the “post-COVID hangover” in gaming demand, economic uncertainty leading consumers to delay upgrades, and lingering effects of oversupply from the earlier crypto bust contributed to this. The company’s revenue growth decelerated, and in some quarters, it reported year-over-year revenue declines in specific segments. Profits were pressured by rising operational costs, and the overall market sentiment towards growth stocks soured amidst fears of a recession. While not as dramatic as the crypto bust for inventory, the cumulative effect of these macroeconomic pressures led to a substantial reduction in Nvidia’s market valuation throughout 2022, as investors adjusted their growth expectations for the near term. This illustrates how even fundamentally strong companies can “lose” significant market value due to external economic forces beyond their immediate control.
Sector-Specific Corrections: When Tech Takes a Hit
Beyond company-specific or segment-specific issues, Nvidia’s stock is also vulnerable to broader corrections in the technology sector. Periods of aggressive monetary tightening by central banks, shifts in investor appetite away from high-growth equities, or concerns about market bubbles can lead to widespread sell-offs in tech stocks, irrespective of individual company performance. In such scenarios, Nvidia’s high valuation multiples (e.g., price-to-earnings ratios) can make it particularly susceptible to significant percentage drops, as investors de-risk their portfolios. These market-wide corrections often result in substantial, albeit often temporary, losses in market capitalization, reflecting a systemic re-evaluation of growth stock potential rather than a direct indictment of Nvidia’s business fundamentals.
Decoding Financial Statements During Downturns
When Nvidia faces a financial downturn, the immediate impact is visible in its financial statements. These documents provide the clearest answers to “how much did Nvidia lose” in terms of operational and reported financial performance.
Revenue Deceleration vs. Actual Contraction
A critical distinction for investors is between revenue deceleration and outright contraction. Deceleration means the rate of revenue growth is slowing down, perhaps from 50% year-over-year to 10% or 5%. While this might disappoint growth-focused investors and lead to a stock price drop, the company is still growing. Revenue contraction, however, means that current revenue is lower than the same period last year, indicating a direct reduction in sales. During the 2018-2019 crypto bust and parts of 2022, Nvidia experienced periods of actual revenue contraction in specific segments (like gaming) or overall deceleration, directly impacting investor sentiment and leading to substantial market value losses. Analyzing the segment breakdown is crucial, as strength in one area (e.g., data center) can partially offset weakness in another.
Profitability Squeeze: The Impact on Net Income and Margins
Revenue issues often cascade into profitability challenges. A “loss” in terms of profit doesn’t necessarily mean the company is losing money overall, but rather that its net income has significantly decreased, or even turned negative in severe cases. This can happen due to:
- Lower Sales Volumes: Fewer units sold mean less gross profit.
- Pricing Pressure: To clear excess inventory or compete, Nvidia might have to lower prices, impacting gross margins.
- Inventory Write-downs: As seen in the crypto bust, carrying excess inventory can necessitate write-downs, directly hitting cost of goods sold and thus reducing gross profit.
- Increased Operating Expenses: Even if revenue declines, research and development (R&D) and selling, general, and administrative (SG&A) expenses might not decrease proportionally, leading to operating leverage working in reverse and squeezing operating margins.
Investors closely monitor gross margin, operating margin, and net income as key indicators of a company’s financial health. A significant decline in these metrics directly answers “how much did Nvidia lose” in terms of current earnings power, often leading to a downward revision of earnings per share (EPS) forecasts and a corresponding drop in stock valuation.
Cash Flow Resilience Amidst Adversity
While revenue and profit often grab headlines, cash flow statements offer a deeper insight into a company’s ability to weather financial storms. Even during periods of declining revenue or profit, a company might still generate positive operating cash flow if it manages its working capital effectively. However, severe downturns can impact cash generation. For instance, high inventory levels tie up cash, and slower sales mean less cash coming in from customers. Investors look for strong free cash flow (operating cash flow minus capital expenditures) as a sign of financial robustness. A company that maintains healthy cash flows even during a downturn is generally considered more resilient and less likely to face liquidity issues, which can mitigate the perceived “loss” and offer a quicker path to recovery.
Investor Sentiment and Market Capitalization Swings
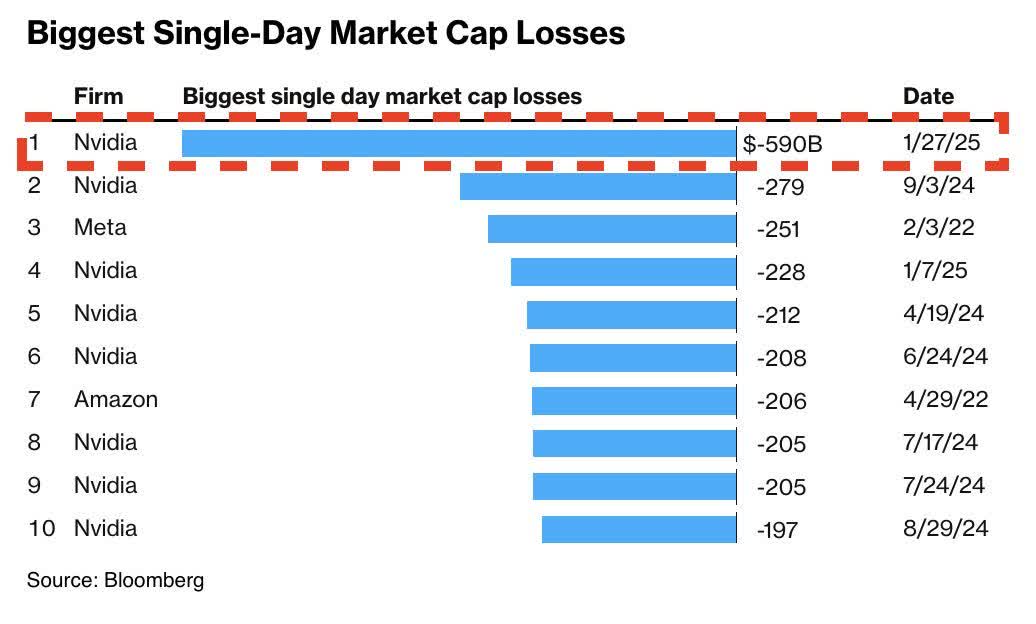
The most visible measure of “how much did Nvidia lose” for public market investors is typically reflected in its stock price and market capitalization. These movements are driven by a complex interplay of current financial results, future expectations, and overall investor sentiment.
Share Price Volatility: Short-Term Reactions vs. Long-Term Trends
Nvidia’s stock has historically exhibited significant volatility. Quarterly earnings reports, product launch announcements, or shifts in macroeconomic outlook can trigger immediate and sometimes dramatic swings in its share price. A “miss” on revenue or earnings expectations, even by a small margin, can lead to billions of dollars in market capitalization evaporating within hours. For example, during the sharp tech downturns, Nvidia’s stock has seen declines of 50% or more from its peak values, representing enormous paper losses for shareholders who bought at the highs.
However, it’s crucial to distinguish between short-term reactions and long-term trends. While an investor might “lose” significant paper wealth in the short term, Nvidia’s long-term trajectory has been one of exceptional growth, driven by its foundational role in critical technologies. Long-term investors often view these short-term dips as buying opportunities, banking on the company’s underlying innovation and market leadership to eventually drive recovery and further gains.
Valuation Metrics Under Scrutiny: P/E Ratios and Growth Expectations
During periods of “loss” or financial deceleration, traditional valuation metrics come under intense scrutiny. High-growth stocks like Nvidia often trade at elevated price-to-earnings (P/E) ratios, reflecting expectations of rapid future earnings growth. When actual growth slows or prospects dim, investors re-evaluate these multiples. A P/E ratio that seemed justified at 50% annual growth might look exorbitant at 10% growth. This re-rating of valuation multiples can cause a significant drop in stock price even if earnings don’t decrease proportionally, as the market adjusts its future expectations. The forward P/E ratio, which uses projected future earnings, is particularly sensitive to changes in analyst forecasts during uncertain times.
The Role of Institutional Investors and Analyst Ratings
Institutional investors (such as mutual funds, hedge funds, and pension funds) hold a substantial portion of Nvidia’s stock. Their buying and selling decisions, often influenced by their own investment mandates and risk assessments, can amplify market movements. When institutions collectively decide to reduce their exposure to a stock or sector, the selling pressure can be immense, leading to significant drops in market capitalization.
Similarly, ratings from financial analysts play a crucial role. Downgrades from “buy” to “hold” or “sell,” or reductions in price targets, can further fuel negative sentiment and accelerate declines. These analysts often base their revisions on changes in financial outlook, competitive landscape, or macroeconomic forecasts, directly contributing to the perception of “how much did Nvidia lose” in terms of investor confidence and future prospects.
Long-Term Financial Resilience and Future Outlook
Despite periods of significant financial “losses” in terms of market value or quarterly performance, Nvidia has repeatedly demonstrated remarkable long-term financial resilience. Its ability to innovate and adapt is a key factor in its recovery from downturns.
Strategic Investments as a Buffer Against Losses
Nvidia’s consistent and substantial investment in research and development (R&D) serves as a critical buffer against long-term financial stagnation. Even during challenging periods, the company continues to pour resources into next-generation architectures, new software platforms, and AI advancements. These strategic investments ensure that when market conditions improve, or new demand cycles emerge, Nvidia is positioned with cutting-edge products and solutions to capture that growth. This forward-looking approach helps mitigate the long-term impact of short-term financial setbacks, as it continually replenishes its pipeline of future revenue drivers.
Diversification of Revenue Streams
Historically known primarily for its gaming GPUs, Nvidia has successfully diversified its revenue streams, significantly strengthening its financial profile. The explosive growth of its data center segment, fueled by demand for AI and high-performance computing (HPC), has become its largest and most profitable business. This diversification means that weakness in one segment (e.g., gaming during a downturn) can be partially offset by strength in another. Its growing presence in professional visualization, automotive AI, and Omniverse also provides additional avenues for growth and reduces over-reliance on any single market, thus dampening the overall financial impact of cyclical downturns in specific sectors. This strategic diversification is paramount in reducing the magnitude of future financial “losses” by spreading risk across multiple, high-growth markets.
Understanding the Growth Catalysts and Risk Factors from an Investor’s View
For investors, understanding Nvidia’s potential for future growth remains key, even when analyzing past “losses.” The ongoing explosion of AI, the increasing demand for high-performance computing in various industries, and the continuous evolution of graphics technology are significant growth catalysts. Nvidia’s platform approach, integrating hardware, software, and services, creates a powerful ecosystem that fosters customer loyalty and high switching costs, contributing to its long-term financial stability.
However, financial risks persist. These include intense competition from other chipmakers, potential regulatory scrutiny (especially concerning market dominance or acquisitions), geopolitical tensions affecting supply chains and market access, and the cyclical nature of its core markets. While Nvidia has demonstrated a capacity to recover from downturns, investors must continuously weigh these risks against the company’s innovation engine and market leadership. The question “how much did Nvidia lose” often prompts a deeper inquiry into these long-term financial fundamentals, revealing a company that, despite its volatility, has consistently found new avenues for growth and value creation.
aViewFromTheCave is a participant in the Amazon Services LLC Associates Program, an affiliate advertising program designed to provide a means for sites to earn advertising fees by advertising and linking to Amazon.com. Amazon, the Amazon logo, AmazonSupply, and the AmazonSupply logo are trademarks of Amazon.com, Inc. or its affiliates. As an Amazon Associate we earn affiliate commissions from qualifying purchases.