
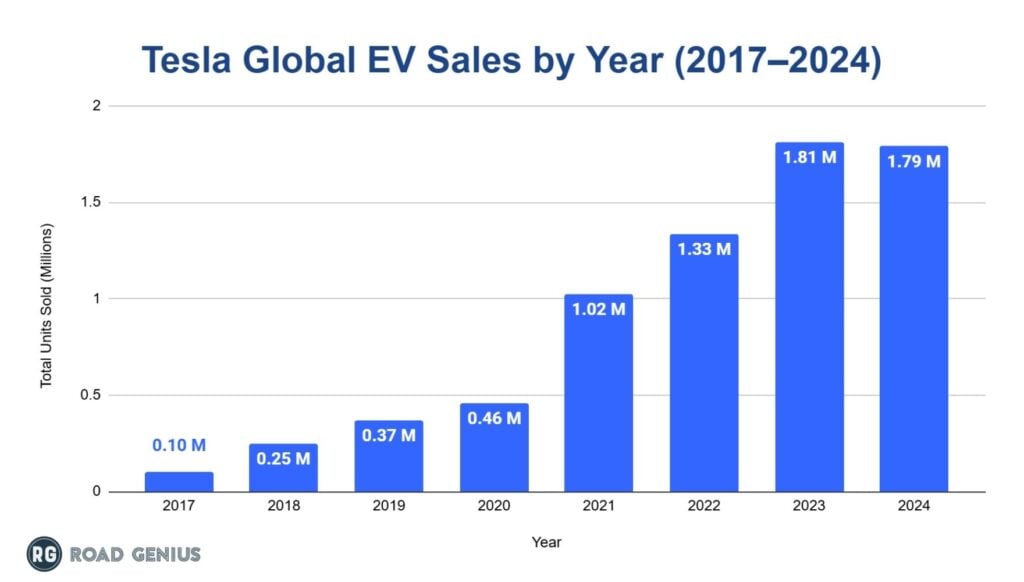
In the realm of modern finance and global manufacturing, few metrics are as scrutinized as the delivery numbers of Tesla, Inc. For investors, financial analysts, and market observers, the question of “how many Teslas have been sold” is not merely a tally of vehicles on the road; it is a fundamental indicator of the company’s scalability, cash flow health, and its position within the broader S&P 500 index. As of the current fiscal year, Tesla has surpassed the monumental milestone of 5 million cumulative vehicle deliveries, a feat that has redefined the automotive industry’s financial landscape.
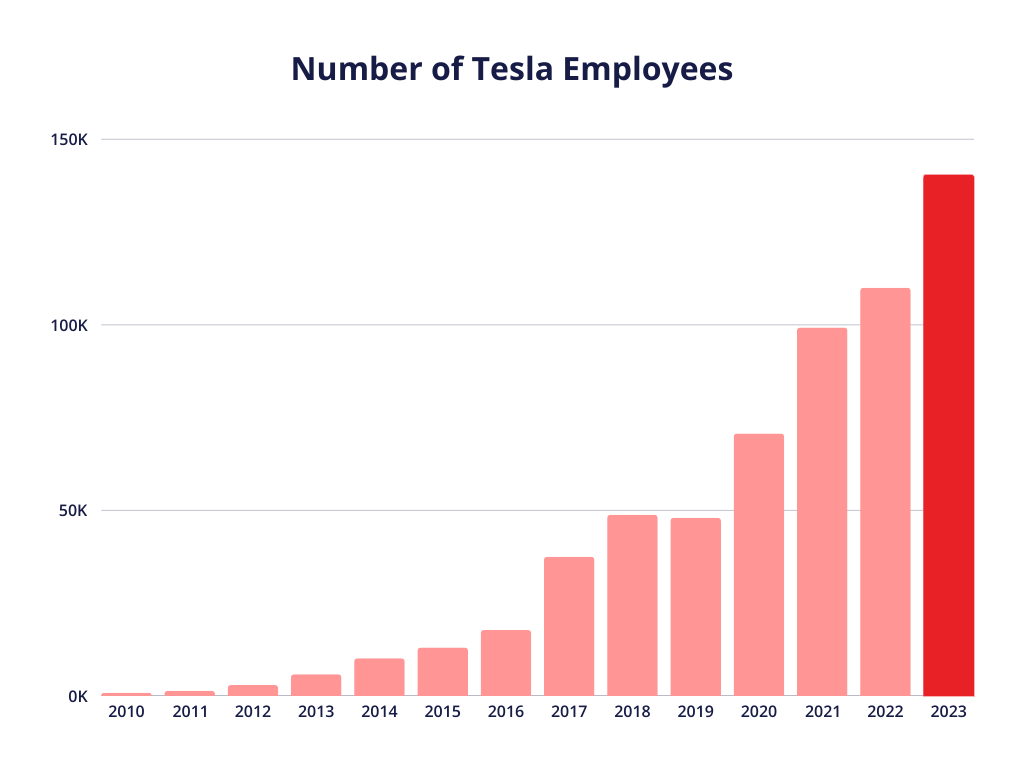
Understanding these sales figures requires a deep dive into the business finance and investment strategy that propelled a niche electric vehicle (EV) startup into a trillion-dollar market cap contender. This article examines the trajectory of Tesla’s sales, the regional financial drivers behind those numbers, and the long-term implications for the company’s valuation.
The Evolution of Sales: From Niche Luxury to Mass-Market Dominance
The story of Tesla’s sales is one of aggressive reinvestment and the successful navigation of “production hell.” For the better part of a decade, Tesla was viewed by the financial community as a high-risk venture with precarious cash flow. However, the transition from low-volume luxury products to high-volume mass-market vehicles fundamentally shifted the company’s balance sheet.
From the Roadster to the Model 3/Y Pivot
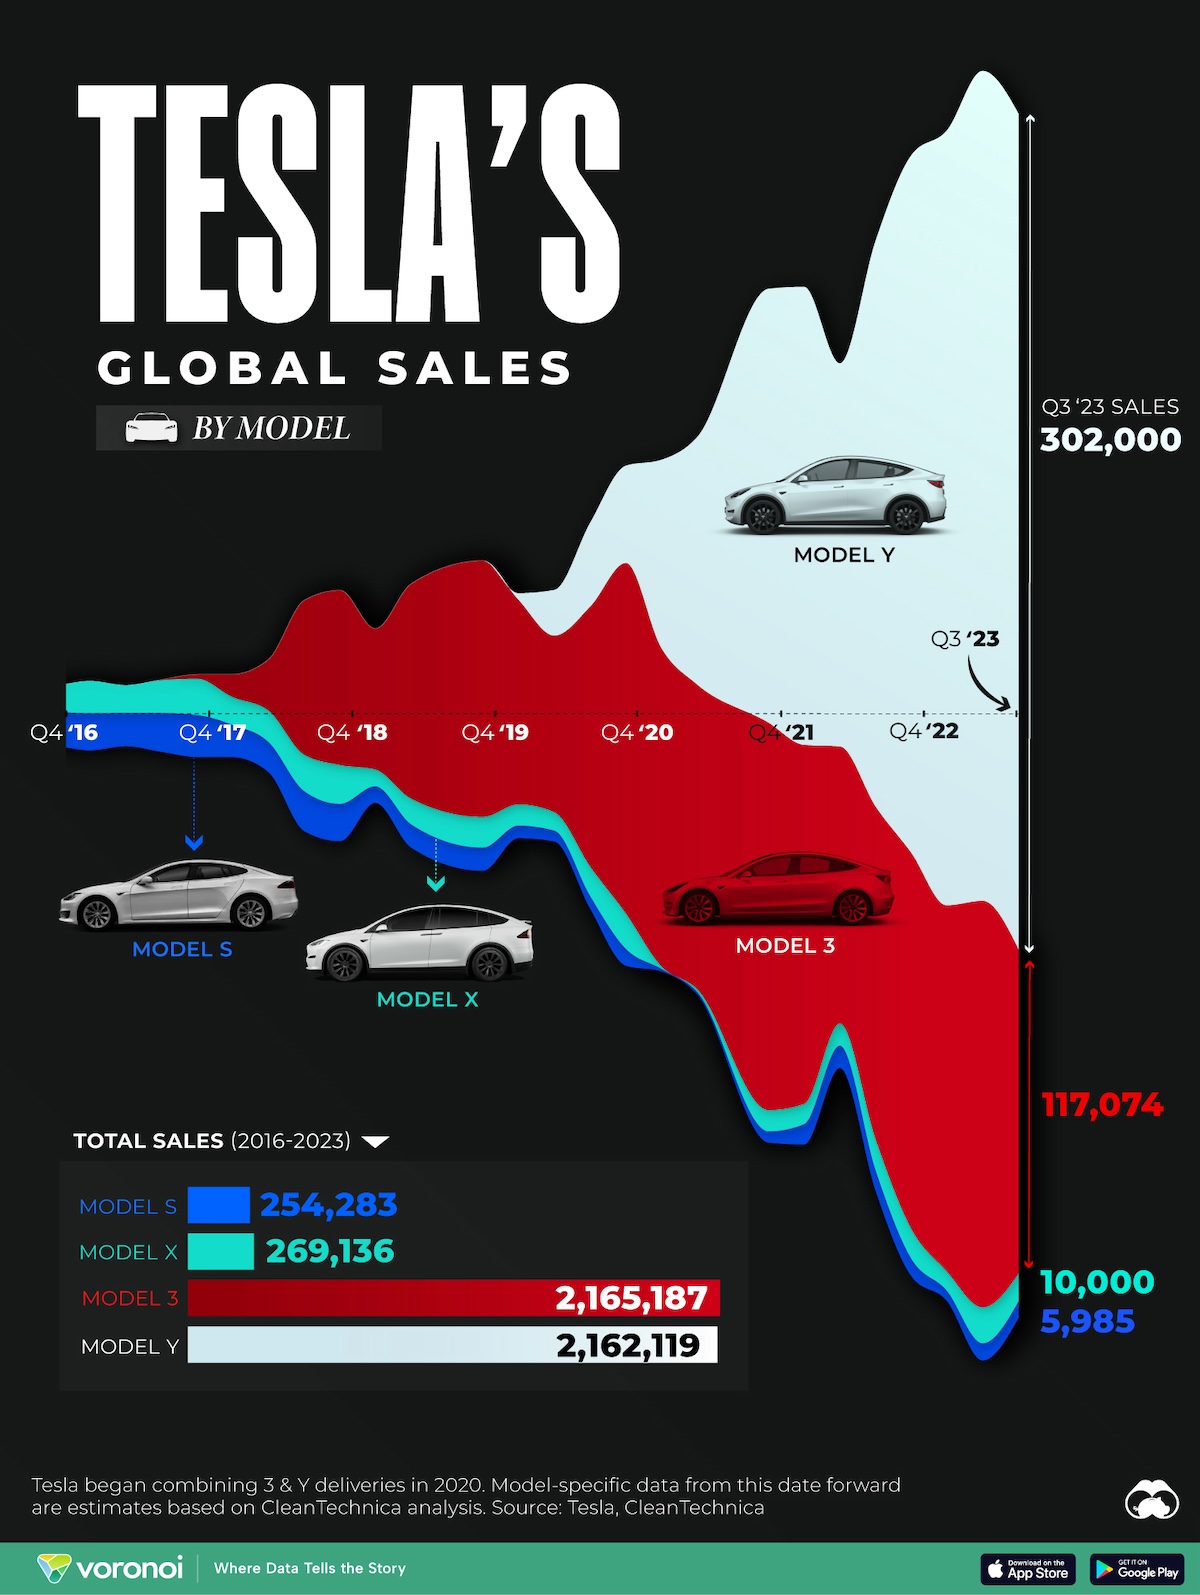
In the early 2010s, Tesla’s sales were negligible in the context of the global automotive market. The original Roadster and the early years of the Model S and Model X were proof-of-concept vehicles designed to generate high margins on low volumes. The real financial transformation began with the launch of the Model 3.
By 2018, Tesla’s ability to scale production became the primary driver of its stock price. Investors were no longer looking at the novelty of the technology; they were looking at the “run rate”—the projected number of vehicles sold annually. The introduction of the Model Y further accelerated this trend, eventually leading to it becoming the best-selling vehicle globally in 2023, an unprecedented achievement for an electric car.
The S-Curve: Tracking Exponential Growth
Financial analysts often refer to the “S-Curve” of adoption. Tesla’s sales data illustrates this perfectly. It took the company 12 years to deliver its first million cars. However, the leap from 4 million to 5 million took less than seven months. This exponential growth is a result of capital expenditures (CapEx) being funneled into automated “Gigafactories.” From a business finance perspective, this scaling reduces the marginal cost of each vehicle, allowing Tesla to maintain industry-leading operating margins even while engaging in aggressive price wars to capture market share.
Regional Revenue Streams: Where the Capital is Generated
Tesla’s sales are not distributed evenly across the globe; rather, they are concentrated in three primary economic hubs: North America, China, and Europe. Each region presents a unique financial profile and regulatory environment that impacts Tesla’s bottom line.
Giga Shanghai and the China Growth Engine
China is arguably the most critical component of Tesla’s financial success. As the world’s largest EV market, China offers a sophisticated supply chain and lower labor costs, which significantly boosts Tesla’s gross margins on vehicles produced at Giga Shanghai.
The sales volume in China is a bellwether for Tesla’s quarterly earnings. When sales dip in the Chinese market due to local competition from companies like BYD, it sends ripples through the global financial markets. Conversely, the high efficiency of the Shanghai plant allows Tesla to export vehicles to Europe and other parts of Asia, optimizing its logistical costs and improving its return on invested capital (ROIC).
North American Resilience and European Expansion
In the United States, Tesla remains the dominant player, often capturing over 50% of the total EV market share. The financial health of the North American division is heavily influenced by federal and state incentives, such as the Inflation Reduction Act (IRA). These tax credits effectively lower the purchase price for consumers without eroding Tesla’s profit margins, a rare “win-win” in corporate finance.
In Europe, the ramp-up of Giga Berlin has allowed Tesla to reduce import duties and shipping costs. By localized production, Tesla has insulated its sales from currency fluctuations and international trade tensions, creating a more stable and predictable revenue stream for long-term investors.
The Financial Mechanics of Delivery Volume
For the institutional investor, the total number of Teslas sold is the denominator for several key financial ratios. It is impossible to analyze Tesla as an investment without understanding how vehicle deliveries translate into revenue, EBITDA, and free cash flow.
Revenue Recognition and Average Selling Price (ASP)
While the total number of units sold is a “headline” figure, the Average Selling Price (ASP) is what determines the quality of those sales. Over the last two years, Tesla has strategically lowered prices to maintain high volume in a high-interest-rate environment.
From a business finance standpoint, this is a calculated trade-off. By sacrificing some immediate margin, Tesla increases its “fleet” size. This is a critical move because Tesla’s long-term financial strategy relies on recurring software revenue—specifically Full Self-Driving (FSD) subscriptions. Every car sold is a potential platform for high-margin software sales, shifting the business model from a traditional hardware manufacturer to a Software-as-a-Service (SaaS) hybrid.
Operational Leverage and Economies of Scale
Tesla’s financial strength is rooted in operational leverage. As the number of units sold increases, the fixed costs (such as factory construction and R&D) are spread across more vehicles. This is why Tesla’s net income grew so dramatically between 2020 and 2023.
The company’s ability to sell millions of vehicles with virtually zero traditional advertising spend is another financial anomaly. By reinvesting what would have been a multi-billion-dollar marketing budget back into engineering and manufacturing efficiency, Tesla has created a cost structure that legacy automakers struggle to replicate. This efficiency is a primary reason why Tesla carries a significantly higher Price-to-Earnings (P/E) ratio than competitors like Ford or General Motors.
Future Projections: The Path to 20 Million Vehicles
Tesla’s leadership has famously set a goal of selling 20 million vehicles annually by 2030. To put this in perspective, that would be roughly double the current output of Toyota or Volkswagen. While critics argue this is an impossibility, the financial roadmap to get there is already being laid.
The Next-Generation Platform and Cost Reduction
The key to the next 15 million sales lies in the “unboxed” manufacturing process and the development of a lower-cost vehicle platform. For Tesla to penetrate the mass-market segments in emerging economies, it must produce a vehicle that can be sold profitably at the $25,000 price point.
From an investing perspective, the success of this platform is the next “make or break” moment. If Tesla can achieve the same margins on a low-cost vehicle as it does on the Model 3, its total addressable market (TAM) expands by several billion people. This would solidify Tesla’s position not just as an automaker, but as a dominant force in the global industrial economy.
Navigating Market Saturation and Competition
As the “early adopter” phase of EV ownership ends, Tesla faces the challenge of market saturation and intensifying competition. In the coming years, the sheer number of Teslas sold will be influenced by the company’s ability to innovate in battery chemistry and energy storage.
Investors must monitor “days of inventory” and “delivery-to-production” ratios. If production begins to significantly outpace deliveries, it indicates a cooling of demand or an overestimation of market appetite. However, as long as Tesla continues to lead in charging infrastructure and software integration, it maintains a “moat” that protects its sales volume and, by extension, its premium valuation.
In conclusion, the question of how many Teslas have been sold is the gateway to understanding the company’s financial health. It represents the successful execution of a high-growth business strategy that has defied conventional automotive economics. For those looking at Tesla through the lens of money and investing, these figures are the pulse of a company that continues to trade on its ability to scale faster and more efficiently than any other manufacturer in history. As the cumulative total climbs toward 10 million and beyond, the financial world will be watching to see if Tesla can maintain its margin-rich dominance in an increasingly crowded field.
aViewFromTheCave is a participant in the Amazon Services LLC Associates Program, an affiliate advertising program designed to provide a means for sites to earn advertising fees by advertising and linking to Amazon.com. Amazon, the Amazon logo, AmazonSupply, and the AmazonSupply logo are trademarks of Amazon.com, Inc. or its affiliates. As an Amazon Associate we earn affiliate commissions from qualifying purchases.