The stock market is a dynamic, ever-fluctuating beast, and few questions ignite more immediate interest—or anxiety—among investors and the financially curious than “how many points did the stock market drop today?” This seemingly simple query, often posed with a mix of trepidation and curiosity, speaks volumes about the constant human desire to gauge the health of our investments and the broader economy. While headlines frequently trumpet significant point declines, especially during periods of high volatility, understanding what these numbers truly signify, why they occur, and how best to respond is far more crucial than the raw figure itself.
For the diligent investor, daily market movements are but a snapshot in a much longer film. Yet, these daily shifts can influence immediate sentiment, trigger automated trading strategies, and serve as early indicators of deeper economic currents. Delving into the mechanics behind a market drop, its various implications, and prudent strategies for navigating such volatility is essential for anyone engaged in personal finance and investing. This article will dissect the often-sensationalized “points drop,” offering an insightful perspective rooted in sound financial principles, and guiding you through the complexities of market dynamics.
Understanding Market Declines: Beyond the Headline Number
When the news cycle blares about a market drop, the immediate focus is almost always on the absolute number of points. However, a superficial reading of this figure can be deeply misleading without proper context. Understanding what “points” represent, their relationship to percentage changes, and which indexes are being referred to is fundamental.
What “Points Drop” Actually Means
A “points drop” typically refers to the decline in the value of a specific stock market index, such as the Dow Jones Industrial Average (DJIA), the S&P 500, or the Nasdaq Composite. These indexes are baskets of stocks designed to represent a segment of the market or the market as a whole. For instance, if the Dow Jones Industrial Average is reported to have dropped by 500 points, it means the aggregate value of its 30 component stocks, weighted by price, has decreased by that numerical amount. It’s not a direct measure of how much money individual investors lost, nor does it mean every stock in the index fell by the same proportion. It’s an arithmetic average or weighted average of price movements.
Why Points Can Be Misleading
The absolute number of points can often create a disproportionate sense of alarm. A 500-point drop in the Dow Jones Industrial Average today, when the index is around 38,000, represents a decline of approximately 1.3%. The same 500-point drop a decade ago, when the Dow might have been around 15,000, would have been a much more significant 3.3% decline. The percentage change is a far more accurate and relevant measure of a market’s performance, as it provides a proportional understanding of the shift relative to the index’s total value. Focusing solely on points without considering the baseline value can lead to exaggerated emotional responses and poor investment decisions.
Key Market Indexes to Watch
To gain a comprehensive understanding of market movements, it’s vital to monitor several key indexes, each offering a different lens on the economy:
- Dow Jones Industrial Average (DJIA): Often simply called “the Dow,” this index tracks 30 large, publicly owned companies based in the United States. It’s price-weighted, meaning stocks with higher prices have a greater influence on the index’s value. Historically significant, it’s often cited in general news.
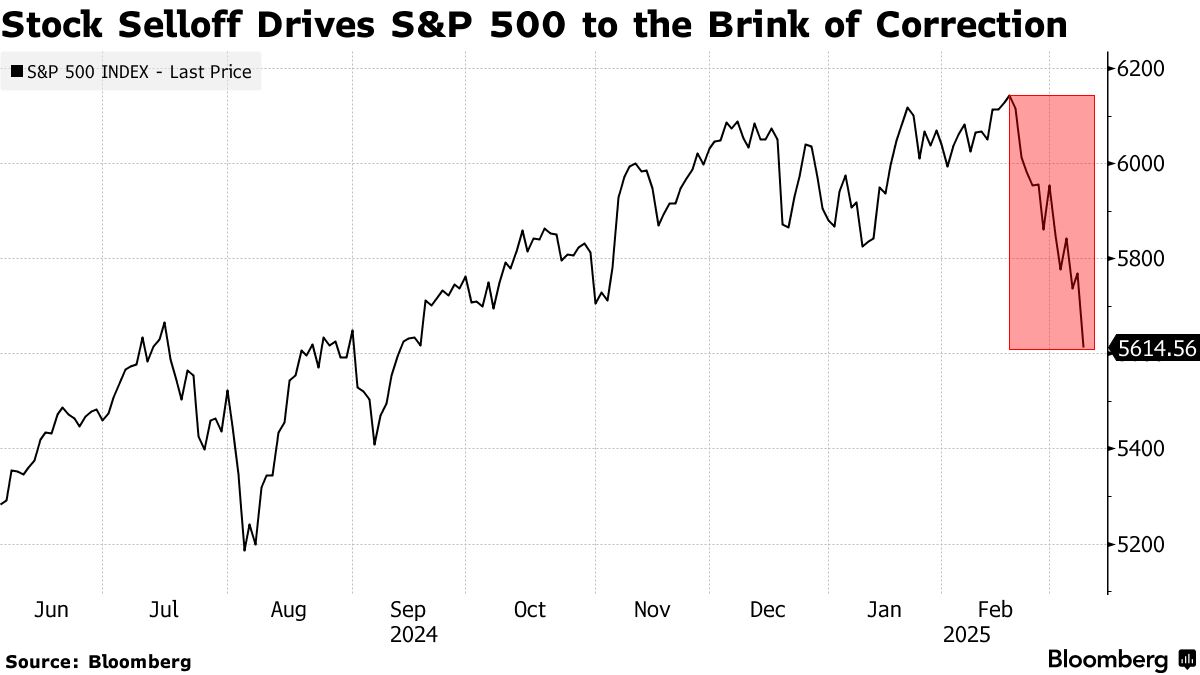
- S&P 500 (Standard & Poor’s 500): This is widely considered the best gauge of large-cap U.S. equities and the overall health of the U.S. stock market. It comprises 500 of the largest U.S. companies by market capitalization and is market-capitalization weighted, meaning companies with larger total market values have a greater impact.
- Nasdaq Composite: This index measures all common equities listed on the Nasdaq stock market. It’s heavily weighted towards technology and growth companies, making it a critical indicator for the tech sector’s performance.
Observing how these different indexes perform provides a nuanced view. A broad market decline will likely affect all of them, but sector-specific issues might see the Nasdaq drop more sharply than the Dow, for example.
The Mechanics Behind a Market Drop
Market drops are rarely singular events caused by one isolated factor. Instead, they are typically the culmination of various interconnected forces, ranging from global economic shifts to investor psychology. Understanding these underlying mechanics is crucial for discerning signal from noise.
Macroeconomic Factors
Broad economic trends and data are often the most potent drivers of market movements.
- Inflation and Interest Rates: Persistent inflation can erode corporate profits and consumer purchasing power. Central banks respond by raising interest rates, which increases borrowing costs for businesses and consumers, potentially slowing economic growth and making future earnings less attractive when discounted to present value.
- Geopolitical Events: Wars, trade disputes, political instability, or major global health crises can create uncertainty, disrupt supply chains, and impact corporate profitability across borders, leading to widespread investor caution and selling.
- Recession Fears: Economic indicators like inverted yield curves, declining manufacturing data, or persistent job losses can fuel fears of an impending recession. Investors typically sell off riskier assets like stocks in anticipation of reduced corporate earnings during an economic downturn.
- Economic Data Releases: Reports on GDP growth, employment figures, consumer confidence, and retail sales can significantly sway market sentiment, indicating the current health and future trajectory of the economy.
Company-Specific News
While macroeconomic factors paint the big picture, specific news relating to major companies, particularly those with significant weight in indexes, can also trigger market drops.
- Earnings Misses and Guidance Cuts: When prominent companies report earnings that fall short of analyst expectations or issue conservative future guidance, it can send shockwaves through their stock prices and ripple through the broader market, especially if the company is a bellwether for its sector.
- Regulatory Issues and Legal Challenges: Antitrust probes, new industry regulations, or significant lawsuits against major corporations can create uncertainty and dent investor confidence in those companies, impacting indexes.
- Industry-Wide Challenges: Issues specific to a particular industry, such as disruptions in supply chains for technology manufacturers or a significant drop in demand for energy, can affect multiple companies within that sector and, by extension, the broader market.
Investor Sentiment and Psychology
Markets are not purely rational entities; human emotion plays a significant role.
- Fear and Panic Selling: Negative news, whether real or perceived, can trigger fear among investors, leading to a cascade of selling as individuals and institutions try to exit positions to avoid further losses. This “panic selling” can accelerate market declines.
- Herd Mentality: Investors often follow the actions of others. If a significant number of market participants start selling, others may follow suit, assuming those selling have superior information or a valid reason, creating a self-reinforcing downward spiral.
- Algorithmic Trading: A substantial portion of market trades are executed by algorithms. These programs are designed to react to specific market signals, news, or price movements. In volatile conditions, they can amplify selling pressure by executing trades rapidly and automatically, sometimes exacerbating drops.
Technical Indicators and Market Structure
Market drops can also be influenced by technical factors and the underlying structure of trading.
- Support and Resistance Levels: Professional traders and algorithms often watch technical support levels. When an index breaks below a significant support level, it can trigger further selling as a new downtrend is perceived.
- Trend Reversals: What might start as a minor dip can evolve into a significant downtrend if key technical indicators signal a reversal from an uptrend.
- Market Liquidity: During periods of intense selling, liquidity can dry up, meaning fewer buyers are available to absorb the selling pressure. This can lead to larger price swings for a given amount of selling, intensifying the drop.

Immediate and Long-Term Implications of Market Drops
While the immediate “points drop” grabs headlines, its true significance lies in its potential immediate and long-term implications for individual investors, the broader economy, and future market opportunities.
Impact on Individual Investors
For many, a significant market drop translates directly into seeing their portfolio value decline.
- Portfolio Value Fluctuations: Retirement accounts (401k, IRA), brokerage accounts, and other investment vehicles will reflect the market’s decline. While unsettling, it’s crucial to remember these are unrealized losses unless assets are sold.
- Psychological Stress: Watching one’s net worth shrink, even on paper, can be incredibly stressful, leading to anxiety and potentially prompting emotionally driven decisions like selling at a loss.
- Potential for “Buying the Dip” or Panic Selling: Market drops present a dilemma. Some investors, driven by fear, might panic sell, locking in losses. Others, with a more long-term view and available capital, might see it as an opportunity to “buy the dip,” acquiring quality assets at a lower price.
Broader Economic Repercussions
Beyond individual portfolios, significant market drops can have wider economic effects.
- Consumer Confidence: A declining stock market can make consumers feel less wealthy, potentially leading to reduced spending, which can further dampen economic growth.
- Corporate Investment: Businesses may become more cautious about expanding or investing in new projects if their stock prices are falling and economic uncertainty looms.
- Wealth Effect: The “wealth effect” suggests that people spend more when they feel wealthier. Conversely, a negative wealth effect from a market downturn can contribute to an economic slowdown.
Opportunity in Volatility
Paradoxically, market volatility and downturns are often the greatest opportunities for astute investors.
- Rebalancing: A market drop is an ideal time to rebalance a portfolio. If certain asset classes have fallen significantly, they might now be underweight, presenting an opportunity to buy more to restore target allocations.
- Dollar-Cost Averaging: For investors consistently contributing to their portfolios (e.g., through monthly 401k contributions), a market drop means their fixed contributions are buying more shares at a lower price, reducing their average cost over time.
- Identifying Undervalued Assets: During a broad market sell-off, even high-quality companies can get dragged down. This creates chances to acquire shares in fundamentally strong businesses at discounted prices, setting the stage for significant long-term returns.
The Role of Diversification
A well-diversified portfolio is an investor’s best friend during market drops. Holding a mix of asset classes (stocks, bonds, real estate, commodities) and diversifying within those classes (different sectors, geographies, company sizes) helps mitigate the impact of a downturn in any single area. While a major market drop will likely affect most equity holdings, diversification can smooth the overall portfolio’s ride and reduce overall risk.
Navigating Market Volatility: Strategies for Investors
Reacting impulsively to daily market fluctuations is a common pitfall for many investors. Instead, a disciplined, long-term approach, underpinned by sound financial planning, is the most effective way to navigate periods of market volatility.
Stay Informed, Not Obsessed
It’s important to understand the major news and economic trends driving market movements, but this should not translate into obsessive daily tracking of every point swing. Differentiate between significant market-moving information and daily market “noise.” Focus on reliable sources and broader economic indicators rather than sensational headlines or social media chatter. Over-monitoring can lead to emotional decisions.
Maintain a Long-Term Perspective
Perhaps the most crucial strategy is to maintain a long-term perspective. Historically, stock markets have always recovered from downturns and gone on to reach new highs. Every major market crash, from the Great Depression to the 2008 financial crisis, has been followed by a period of recovery and growth. For investors with a time horizon of 10, 20, or even 30+ years (e.g., for retirement), daily or even yearly drops are often just blips on the radar. Focus on your financial goals, not the daily ticker.
Rebalance Your Portfolio
Regularly review and rebalance your portfolio, ideally on a fixed schedule (e.g., annually) or when asset allocations drift significantly from your target. If a market drop causes your stock allocation to fall below your desired percentage, it provides an opportunity to buy more stocks at reduced prices to bring it back into alignment. Conversely, during bull markets, you might sell some winning assets to avoid becoming over-allocated to riskier assets.
Dollar-Cost Averaging
For investors contributing regularly to their accounts, dollar-cost averaging (DCA) is an invaluable strategy. By investing a fixed amount of money at regular intervals, you naturally buy more shares when prices are low and fewer shares when prices are high. This strategy removes emotion from the investment process, averages out your purchase price over time, and can be particularly effective during market downturns, as it allows you to accumulate more shares when assets are “on sale.”

Emergency Fund and Debt Management
Before even contemplating investing in the stock market, ensure you have a robust financial foundation. An emergency fund, typically 3-6 months’ worth of living expenses, is critical to avoid being forced to sell investments at a loss during a downturn because of an unforeseen expense. Similarly, managing high-interest debt is paramount, as the guaranteed return of paying off such debt often outweighs potential market gains. A strong financial base provides peace of mind and flexibility during volatile times.
The question “how many points did the stock market drop today?” is more than a simple inquiry about a number; it’s an entry point into a complex world of financial data, economic indicators, and human psychology. While daily point drops can be unsettling, a deeper understanding of their context, the forces driving them, and the proven strategies for navigating them empowers investors to move beyond immediate reactions. By focusing on percentage changes, understanding the macroeconomic landscape, maintaining a long-term perspective, and adhering to disciplined financial practices like diversification and dollar-cost averaging, you can transform perceived threats into potential opportunities and build enduring wealth, regardless of the market’s daily gyrations. The key to successful investing isn’t avoiding market drops, but rather understanding and wisely responding to them.
aViewFromTheCave is a participant in the Amazon Services LLC Associates Program, an affiliate advertising program designed to provide a means for sites to earn advertising fees by advertising and linking to Amazon.com. Amazon, the Amazon logo, AmazonSupply, and the AmazonSupply logo are trademarks of Amazon.com, Inc. or its affiliates. As an Amazon Associate we earn affiliate commissions from qualifying purchases.