
Understanding the employee headcount of a global titan like Google, a subsidiary of Alphabet Inc., extends far beyond mere curiosity. From a business finance standpoint, the number of individuals contributing to a company’s operations is a critical metric, offering deep insights into its operational scale, cost structure, efficiency, and ultimately, its financial health and investment appeal. For analysts, investors, and business leaders, Google’s workforce data is a window into its strategic allocations, productivity drivers, and future growth trajectory within the hyper-competitive technology landscape.
The Scale of Google’s Workforce: A Financial Overview
At its core, a company’s employee count represents a significant portion of its operating expenses, primarily through salaries, wages, benefits, and related overheads. For a company as vast and complex as Google, with its diverse portfolio spanning search, cloud computing, AI, hardware, and ambitious “Other Bets,” its workforce is a massive financial commitment and a strategic asset.

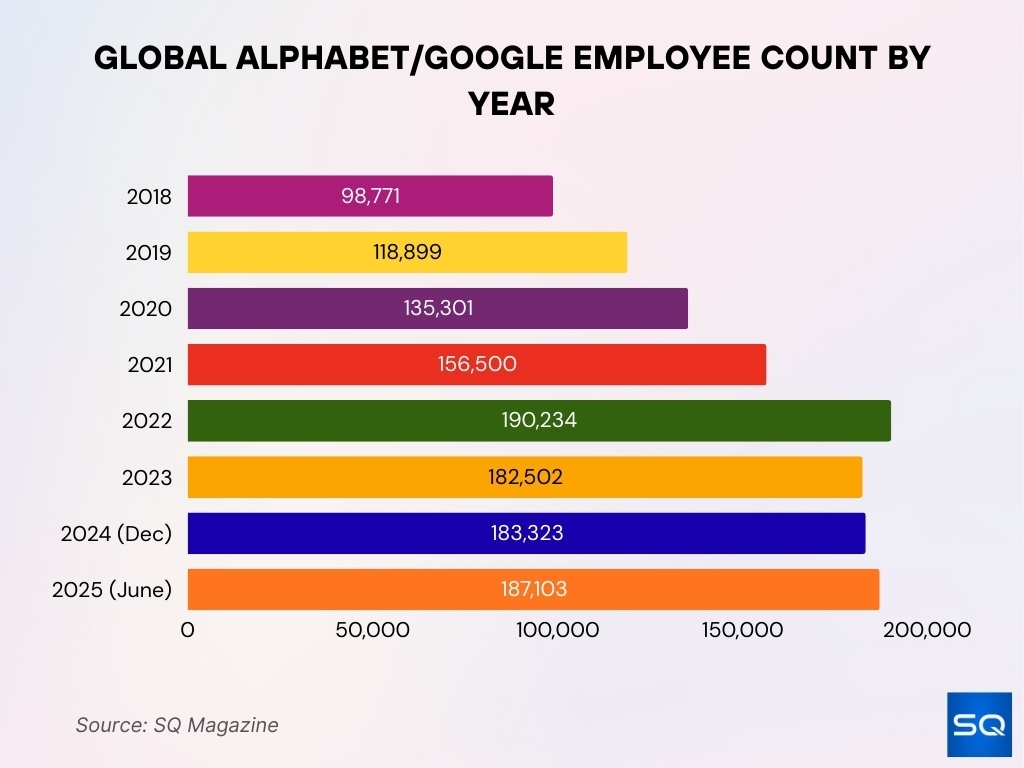
While exact real-time figures fluctuate constantly due to hiring and attrition, Google (as Alphabet Inc.) consistently ranks among the largest employers in the technology sector. Publicly reported figures provide a crucial benchmark. For instance, at the close of 2023, Alphabet Inc. reported a global workforce of approximately 182,500 full-time employees. This figure, though substantial, represented a slight decrease from its peak in early 2023, following strategic workforce reductions and a more disciplined hiring approach. These shifts are not arbitrary; they reflect deliberate financial decisions aimed at optimizing profitability and efficiency in a changing economic climate.
Decoding the Cost Structure
The sheer magnitude of this workforce translates into billions of dollars in annual compensation expenses. Beyond base salaries, Google is renowned for its generous employee benefits, including comprehensive healthcare, retirement plans, stock options, and various perks designed to attract and retain top talent. These non-wage benefits add significantly to the overall “cost per employee.” From a financial reporting perspective, these expenses fall primarily under “Cost of Revenues” (for those involved in service delivery and infrastructure) and “Operating Expenses” (including Research and Development, Sales and Marketing, and General and Administrative costs).
A detailed breakdown of these costs reveals how effectively the company is managing its human capital investments. High compensation costs, while necessary to secure leading expertise, must be balanced against the revenue generated per employee to ensure sustainable growth and profitability.
Employee Count as a Key Business Metric
For the astute financial observer, Google’s employee count isn’t just a number; it’s a dynamic variable intertwined with several core business metrics that dictate a company’s financial performance and market valuation.
Revenue Per Employee (RPE)
One of the most critical metrics derived from employee count is Revenue Per Employee (RPE). This ratio calculates the total revenue generated by the company divided by its total number of employees. A higher RPE generally indicates greater efficiency and productivity from the workforce. For Alphabet, with its multi-trillion-dollar market capitalization and massive revenue streams, tracking RPE helps analysts understand if the company is scaling efficiently or if its growth in headcount is outpacing revenue expansion.
- Impact of RPE: A declining RPE might signal overstaffing, inefficiency, or a shift towards less profitable ventures. Conversely, an increasing RPE, especially when coupled with revenue growth, suggests effective talent deployment, automation gains, or a focus on high-margin products. Investors closely monitor RPE to assess management’s ability to extract maximum value from its human capital.
Profit Per Employee
Beyond top-line revenue, “Profit Per Employee” offers an even more granular view of financial health. This metric (Net Income / Number of Employees) measures how much profit each employee contributes on average. It is a powerful indicator of operational leverage and cost control. In an industry where competition for talent is fierce and salaries are high, maximizing profit per employee is paramount for maintaining healthy margins.
- Strategic Implications: Companies like Google, which invest heavily in research and development (R&D), often see their RPE and Profit Per Employee figures influenced by long-term strategic bets. While these employees may not generate immediate revenue, their work is critical for future product innovation and market leadership, justifying their financial cost over the long term.
Valuation Multiples and Investor Confidence
Employee count also plays an indirect role in how investors value a company. Metrics like Enterprise Value (EV) to Employee, or market capitalization per employee, can be used for comparative analysis within the tech sector. While not a standalone valuation method, these ratios provide context. A company with a relatively low employee count but high valuation might suggest a highly automated, capital-efficient business model (e.g., certain software companies). Conversely, a company with a high employee count relative to its valuation might suggest a more labor-intensive operation, which could carry higher fixed costs and less flexibility.
Investor confidence is often tied to a company’s ability to manage its growth – both in revenue and in headcount – sustainably. Uncontrolled hiring, leading to bloat, can erode investor trust, while strategic workforce adjustments, even layoffs, when communicated effectively and tied to a clear financial rationale, can reassure the market of disciplined management.
Operational Efficiency and Productivity Per Employee
The quest for operational efficiency is a constant for any large corporation, and Google is no exception. Its employee count is a direct input into this equation, reflecting how well the company converts its human resources into valuable products, services, and ultimately, shareholder returns.
Automation vs. Human Capital
Google’s business model, particularly in its core search and advertising segments, is heavily reliant on automation, machine learning, and AI. This allows vast operations to be managed with a relatively smaller workforce compared to traditional industries of similar revenue scale. However, the development, maintenance, and innovation of these sophisticated systems still require highly skilled human capital.

- Optimizing the Balance: The ongoing challenge for Google’s finance and operations teams is to find the optimal balance between investment in automation technologies and investment in human talent. Every incremental hire must demonstrate a clear path to value creation, either by directly contributing to revenue, enhancing product quality, or reducing costs elsewhere in the organization. The recent trend of “doing more with less” in tech, partly fueled by advancements in AI, suggests a future where productivity per employee could rise significantly, even with stable or slightly decreasing headcounts.
Strategic Workforce Allocation
The distribution of Google’s employees across its various segments (Search, Cloud, YouTube, Waymo, Verily, etc.) also speaks volumes about its financial strategy. A significant portion of its workforce is dedicated to Research and Development (R&D) – a crucial investment for a company that thrives on innovation. This allocation demonstrates a commitment to future growth engines, even if these segments may not be immediately profitable.
- R&D Intensity: High R&D spending, often reflected in a large R&D headcount relative to total employees, is a hallmark of growth-oriented tech firms. From a financial perspective, this is a capital allocation decision, weighing immediate profitability against long-term market dominance and competitive advantage. The return on this R&D investment, often measured in future revenue from new products or improved services, is paramount.
Growth, Restructuring, and Financial Impact
Google’s employee numbers have not followed a linear path; they have surged dramatically during periods of rapid expansion and have seen deliberate contractions or slowed growth during economic downturns or strategic realignments. Each of these phases carries significant financial implications.
The Dynamics of Hiring Booms
Historically, Google has undergone periods of aggressive hiring, particularly during major expansion initiatives or the launch of new products/services (e.g., Google Cloud’s rapid growth, or early days of Android). These hiring booms translate into substantial increases in payroll expenses, often preceding the full realization of new revenue streams.
- Investment Phase: From a financial perspective, such periods are “investment phases” where cash is deployed into human capital with the expectation of future returns. Analysts would scrutinize whether these investments are well-justified by the company’s long-term strategic vision and whether the corresponding revenue growth eventually materializes to offset the increased operational costs.
The Rationale Behind Workforce Reductions
The widely reported tech industry layoffs of late 2022 and 2023, including those at Google, underscore the financial discipline that even highly successful companies must maintain. These decisions are rarely taken lightly but are driven by a combination of factors:
- Economic Headwinds: A slowdown in advertising spending, rising interest rates, and broader economic uncertainty often prompt companies to re-evaluate their cost structures. Reducing headcount is a direct way to trim operating expenses and preserve profit margins.
- Post-Pandemic Adjustment: The accelerated digital transformation during the pandemic led to rapid hiring across the tech sector. As economic activity normalized, many companies found themselves overstaffed relative to current demand, necessitating adjustments.
- Efficiency Drives: Even without external pressures, companies routinely seek to optimize efficiency. Reductions can target redundant roles, underperforming teams, or areas where automation can now handle tasks previously performed by humans.
- Investor Pressure: Faced with increased scrutiny on profitability and efficiency, management teams often respond to investor demands for fiscal prudence. Workforce reductions, while challenging, can sometimes be viewed positively by the market as a sign of disciplined leadership focused on shareholder value.
From a financial lens, workforce reductions aim to improve profitability metrics, boost cash flow, and free up capital for other strategic investments. While there are severance costs in the short term, the long-term benefits typically include a leaner, more agile organization with potentially higher revenue and profit per employee.
The Future Workforce Landscape and Investment Implications
Looking ahead, Google’s approach to its workforce will continue to be a crucial determinant of its financial performance and its appeal as an investment. The future of work, marked by AI integration, remote work models, and an ever-evolving skill demand, will shape how Google manages its most valuable asset: its people.
AI and Productivity
The proliferation of advanced AI tools, many developed by Google itself, presents a double-edged sword. On one hand, AI can significantly augment human capabilities, leading to increased productivity and potentially a higher RPE without a proportional increase in headcount. On the other hand, AI may automate certain tasks, leading to the reallocation or reduction of roles that are no longer needed.
- Strategic Upskilling: Google’s financial strategy will need to incorporate substantial investment in upskilling and reskilling its existing workforce to leverage AI effectively. This is a cost, but a necessary one to maintain competitive advantage and avoid talent obsolescence.
Global Talent Pools and Cost Arbitrage
Google’s global footprint allows it to access diverse talent pools, potentially enabling some degree of cost arbitrage by situating operations in regions with lower labor costs. However, the company’s core R&D and strategic functions often remain concentrated in high-cost tech hubs to maintain proximity to innovation ecosystems.
- Optimizing Location Strategy: Finance teams play a crucial role in evaluating the cost-benefit analysis of expanding in different geographies, balancing talent availability, operational costs, regulatory environments, and strategic objectives.
Investor Perspective: Sustainability and Innovation
For long-term investors, Google’s employee strategy signals not just short-term profitability but also its commitment to sustainable innovation. A company that can attract, retain, and productively deploy top talent, while also maintaining fiscal discipline in its workforce management, is likely to be a resilient and growing enterprise. Metrics like employee engagement and attrition rates, though not directly financial, also indirectly influence long-term financial performance by impacting productivity and hiring costs.
In conclusion, the question of “how many employees in Google” opens a detailed financial dialogue. It’s a lens through which we can examine operational efficiency, cost management, strategic investment in human capital, and the complex interplay between workforce dynamics and a company’s bottom line. For Google, as for any mega-corporation, mastering the art and science of workforce management remains fundamental to its sustained financial success and market leadership.
aViewFromTheCave is a participant in the Amazon Services LLC Associates Program, an affiliate advertising program designed to provide a means for sites to earn advertising fees by advertising and linking to Amazon.com. Amazon, the Amazon logo, AmazonSupply, and the AmazonSupply logo are trademarks of Amazon.com, Inc. or its affiliates. As an Amazon Associate we earn affiliate commissions from qualifying purchases.