
For many individual investors, the “stock market” is often synonymous with the household names they see in the news—Apple, Amazon, or Microsoft. However, the reality of the global financial landscape is far more vast and complex. Determining exactly how many companies are in the stock market depends heavily on how you define the “market.” Is it the domestic exchanges of the United States, or does it include the emerging bourses of Southeast Asia and the established giants in Europe?
Understanding the breadth of the stock market is not merely a trivia exercise; it is a fundamental aspect of understanding market liquidity, diversification, and the overall health of the global economy. As of current estimates, there are approximately 58,000 to 60,000 publicly traded companies listed on various exchanges worldwide. To navigate this expansive list, one must dive into the specific exchanges, the indices that track them, and the economic forces that cause these numbers to fluctuate year after year.
The Global Landscape: Measuring the World’s Public Entities
When we look at the stock market from a global perspective, the sheer volume of companies is staggering. According to the World Federation of Exchanges (WFE), which tracks data from over 80 regulated exchanges, the number of listed companies has seen significant shifts over the last decade. While the Western markets have seen periods of consolidation, emerging markets in Asia have fueled a surge in new listings.
The Major Global Hubs
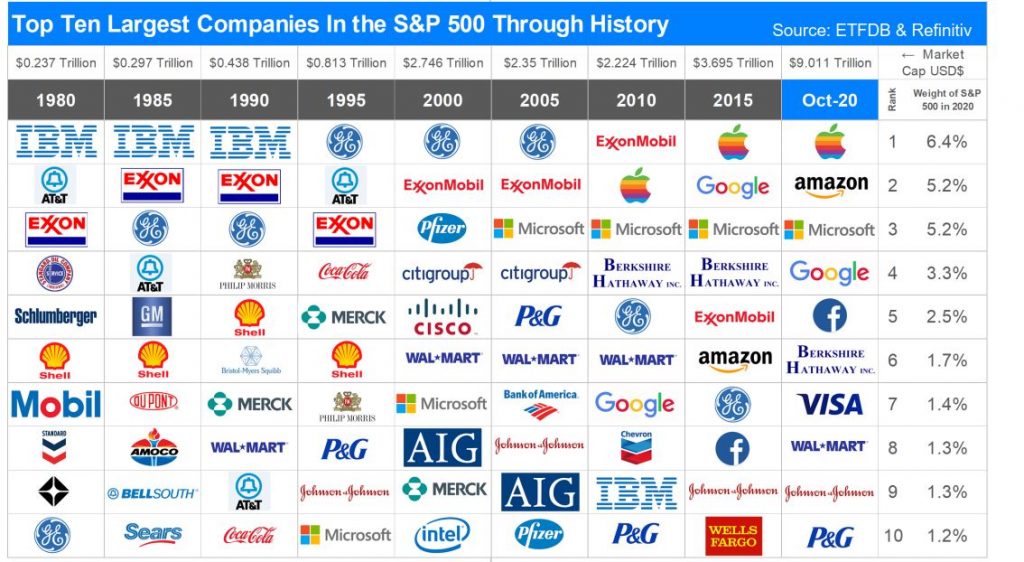
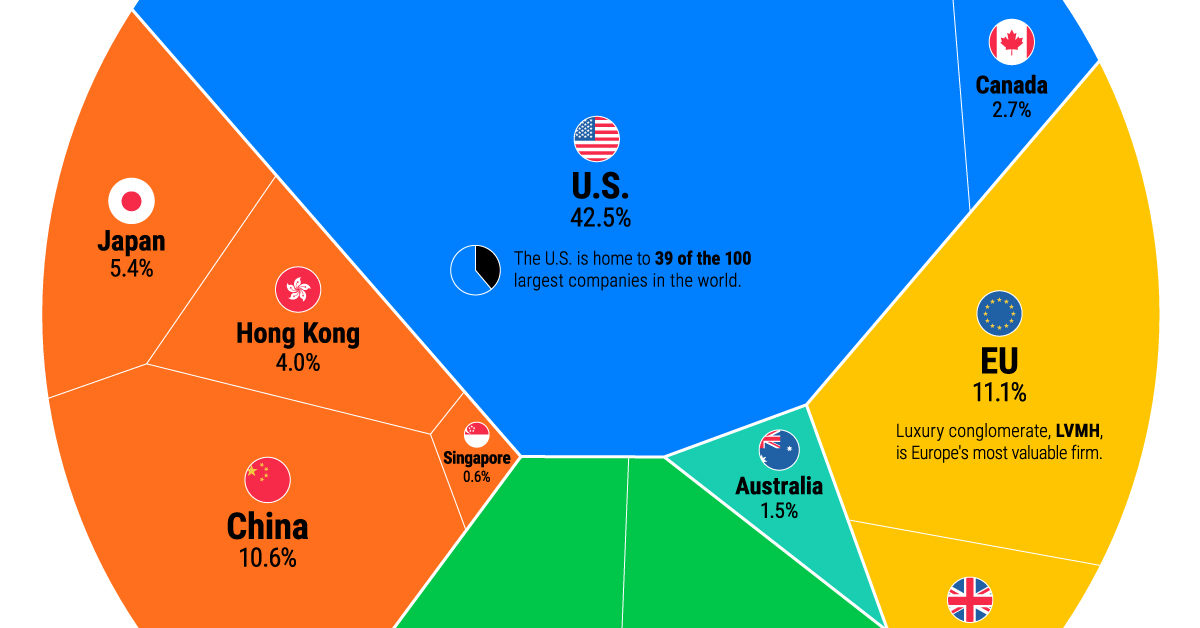
The concentration of public companies is largely distributed across a few major financial hubs. The United States remains the most influential in terms of market capitalization, but in terms of the sheer number of individual listings, other regions are highly competitive.
-
North America: Home to the New York Stock Exchange (NYSE) and the NASDAQ, the U.S. hosts over 6,000 public companies.
-
Asia-Pacific: This region has become a powerhouse for listings. The Japan Exchange Group (JPX), the Shanghai Stock Exchange, and the Shenzhen Stock Exchange collectively host thousands of companies. India’s Bombay Stock Exchange (BSE) is unique in that it has one of the highest numbers of listed entities in the world—over 5,000—though many of these are small-cap stocks with limited liquidity.
-
Europe: The London Stock Exchange (LSE), Euronext, and the Deutsche Börse represent a significant portion of the global total, though the number of listings in Europe has remained relatively stable or slightly declined as private equity becomes a more popular alternative to public markets.
The Difference Between Listed and Traded
It is important to distinguish between a “listed” company and a “traded” company. A listed company has met the specific requirements of an exchange to have its shares available for public purchase. However, many companies may be “delisted” or move to “over-the-counter” (OTC) markets if they fail to meet minimum share price requirements or regulatory standards. When economists discuss the “stock market,” they are usually referring to companies listed on major, regulated exchanges where transparency and reporting standards are highest.
Decoding the U.S. Stock Market Landscape
For most investors reading in English-speaking markets, the U.S. stock market is the primary focus. Despite representing a fraction of the world’s population, U.S. exchanges account for nearly 40% of the total global equity market value.
The Big Two: NYSE and NASDAQ
In the United States, the majority of public activity happens on two primary exchanges:
-
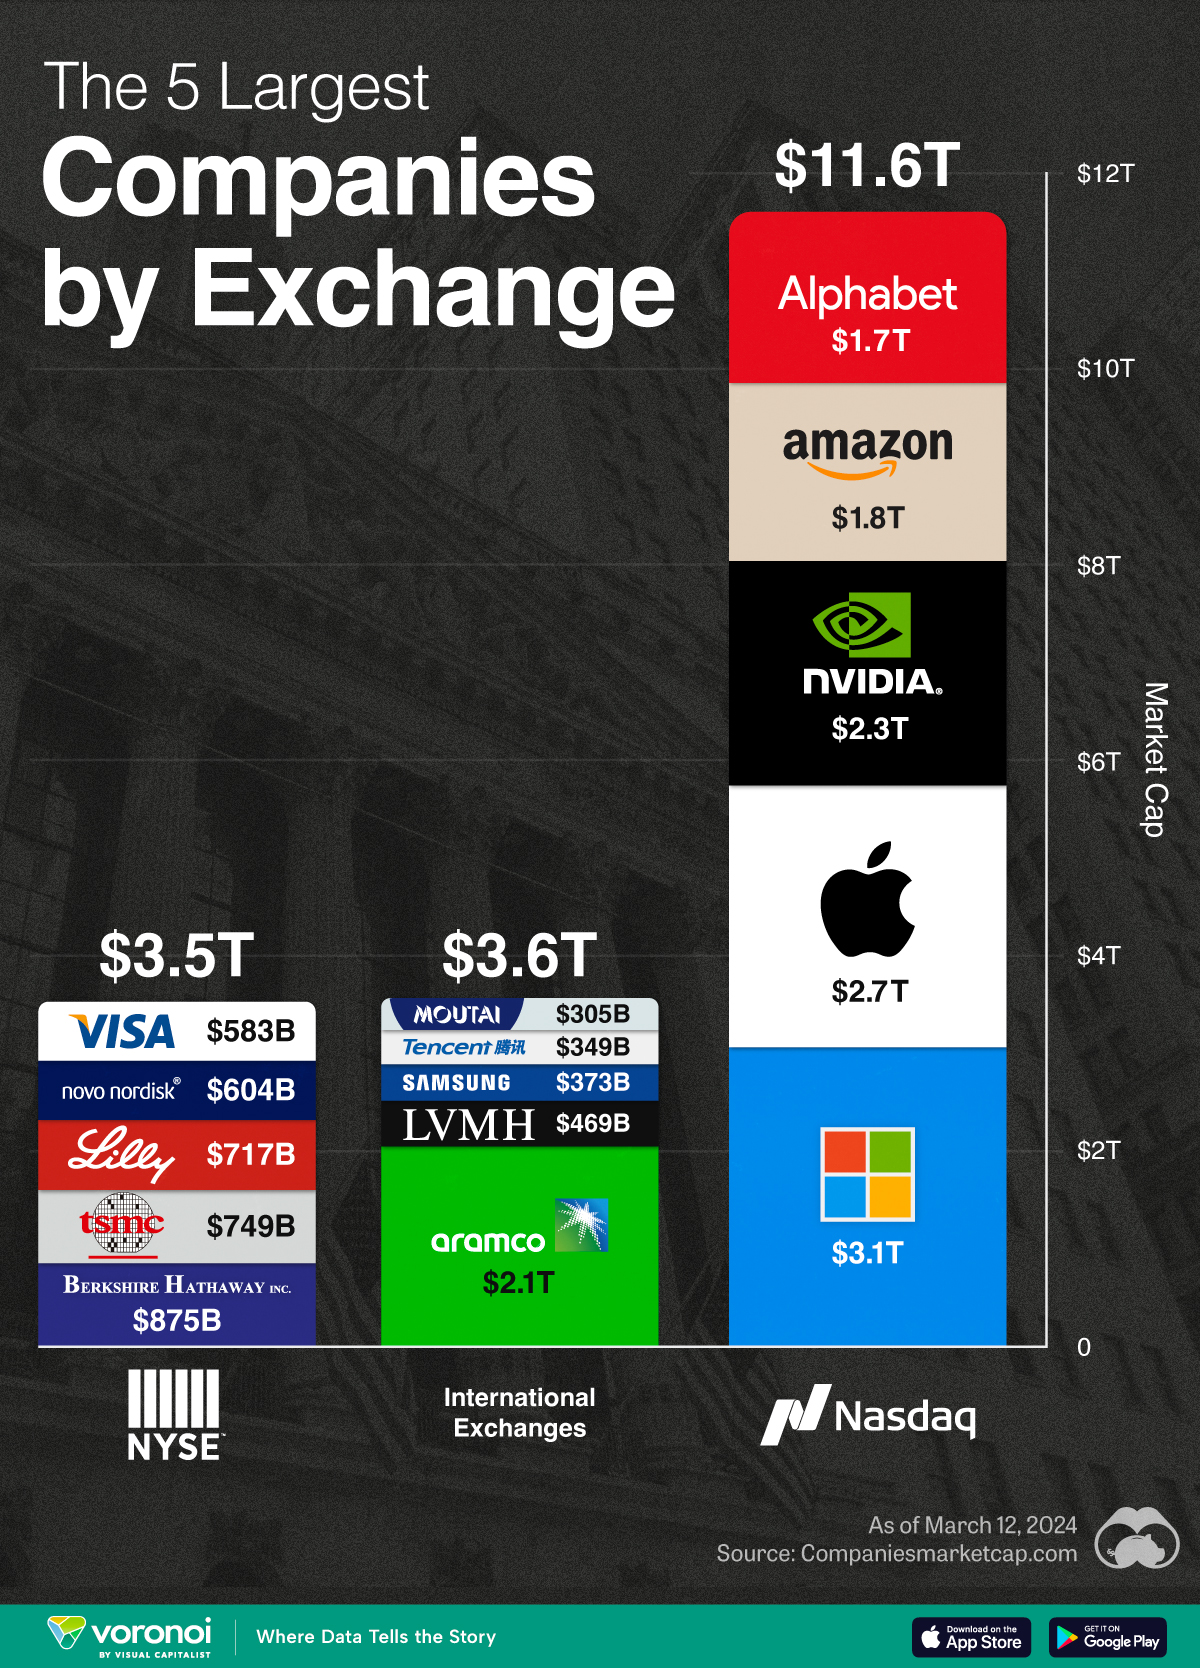
The New York Stock Exchange (NYSE): Known as the “Big Board,” the NYSE is the world’s largest stock exchange by market capitalization. It typically hosts older, more established “blue-chip” companies. There are approximately 2,400 companies listed here.
-
The NASDAQ: Historically known as the home for tech startups, the NASDAQ has grown to rival the NYSE in prestige. It features a larger number of companies—roughly 3,700—ranging from small-cap biotech firms to trillion-dollar tech giants.
The Trend of “The Shrinking Market”
One of the most interesting phenomena in business finance is that the number of public companies in the U.S. is actually significantly lower than it was 25 years ago. In 1996, there were over 8,000 publicly traded companies in the U.S. Today, that number has hovered between 4,000 and 6,000 for several years.
Several factors contribute to this decline:
-
Mergers and Acquisitions (M&A): Larger companies frequently acquire smaller competitors to fuel growth, effectively removing a ticker symbol from the exchange.
-
The Rise of Private Equity: Companies are staying private longer. With an abundance of venture capital and private equity funding available, firms no longer feel the immediate pressure to “go public” to raise capital.
-
Regulatory Costs: The cost of remaining a public company—including Sarbanes-Oxley compliance, quarterly reporting, and investor relations—can be prohibitive for smaller firms.
Understanding the Lifecycle: How Companies Enter and Exit
The number of companies in the stock market is never static. It is a living ecosystem where new entities are born into the public eye and others retire or transition back to the private sector.
The Entry Point: Initial Public Offerings (IPOs)
The primary way a company enters the stock market is through an Initial Public Offering. An IPO allows a private company to raise capital by selling shares to the general public. In “bull market” years, we might see hundreds of IPOs. In “bear market” years, the window often closes as companies wait for better valuations. Recent years have also seen the rise of “Direct Listings” (used by companies like Spotify) and SPACs (Special Purpose Acquisition Companies), which provided alternative routes to the public market.
The Exit: Delistings and Going Private
Conversely, companies leave the market through delisting. This can happen for negative reasons, such as a company falling below the exchange’s minimum requirements or declaring bankruptcy. However, it also happens for strategic reasons. A private equity firm may “buy out” a public company, taking it private to restructure it away from the prying eyes of quarterly earnings reports. Notable examples include Twitter (now X) and Dell (which later returned to the public market).
Indices vs. Exchanges: What Are You Actually Tracking?
Investors often confuse market indices with the total number of companies in the market. When you hear that “the market was up today,” the speaker is usually referring to a specific index, not every single listed company.
The S&P 500
This index tracks 500 of the largest publicly traded companies in the U.S. While it represents only about 10% of the total number of U.S. companies, it accounts for approximately 80% of the total market capitalization. Because it is market-cap weighted, the largest companies have the most significant impact on its movement.
The Russell 3000
If you want a better representation of the “entire” U.S. market, the Russell 3000 is a superior metric. It tracks the 3,000 largest U.S. companies, covering about 98% of the investable U.S. equity market. When people ask how many companies are in the “main” market, this 3,000 figure is often the most accurate representation for an investor.
The Wilshire 5000
Originally intended to track all actively traded U.S. stocks, the Wilshire 5000 Total Market Index is the broadest measure of the U.S. domestic equity market. Interestingly, despite its name, the index currently contains fewer than 3,500 companies, reflecting the long-term trend of market consolidation mentioned earlier.
Why the Total Count Matters for Your Portfolio
For the individual investor, the number of companies available in the stock market has direct implications for portfolio strategy and risk management.
Diversification and Market Breadth
A healthy market is usually a “broad” market. Market breadth refers to how many companies are participating in a market trend. If the S&P 500 is rising, but only five companies (like the “Magnificent Seven”) are responsible for all the gains while the other 495 are flat or falling, the market is considered top-heavy and potentially risky. Monitoring the total count and the performance of smaller-cap companies helps investors understand if a rally is sustainable.
The Opportunity in Small-Caps
Because the majority of financial media focus is on the top 100 companies, there is often untapped value in the thousands of smaller companies that make up the rest of the market. Small-cap and mid-cap stocks (found in indices like the Russell 2000) offer higher growth potential, albeit with higher volatility. Knowing that there are over 5,000 companies beyond the household names allows an investor to look for “alpha”—returns that beat the standard market benchmarks.
The Shift Toward Private Assets
As the number of public companies has decreased in the U.S., more wealth creation is happening in the private sector before a company ever hits the stock exchange. This has led to the democratization of “private equity” through certain financial tools, allowing retail investors to gain exposure to companies that aren’t yet listed on the NYSE or NASDAQ.
Conclusion: A Dynamic and Evolving Number
So, how many companies are in the stock market? If you are looking at the major U.S. exchanges, the number is roughly 6,000. If you are looking at the most liquid and investable U.S. stocks, the number is closer to 3,000. On a global scale, you are looking at a universe of nearly 60,000 options.
While the number of public companies in developed markets has consolidated, the global equity landscape remains vast. For the modern investor, the goal isn’t just to know how many companies exist, but to understand which segment of that market fits their financial goals. Whether you are tracking the 500 giants that dominate the S&P or searching for the next innovator among the thousands of small-cap listings, the stock market remains the most significant engine for wealth creation in the modern economy. Understanding its scale is the first step in mastering its potential.
aViewFromTheCave is a participant in the Amazon Services LLC Associates Program, an affiliate advertising program designed to provide a means for sites to earn advertising fees by advertising and linking to Amazon.com. Amazon, the Amazon logo, AmazonSupply, and the AmazonSupply logo are trademarks of Amazon.com, Inc. or its affiliates. As an Amazon Associate we earn affiliate commissions from qualifying purchases.