
The S&P 500 is widely considered the most accurate barometer of the United States stock market and, by extension, the health of the broader global economy. Comprising 500 of the largest publicly traded companies in the U.S., it captures approximately 80% of the available market capitalization. When investors ask, “How is the S&P 500 doing?” they are essentially asking about the trajectory of corporate America, the resilience of consumer spending, and the effectiveness of monetary policy.
Currently, the index finds itself at a fascinating crossroads defined by high valuations, technological disruption, and shifting macroeconomic narratives. To understand its performance, one must look beyond the daily price fluctuations and examine the underlying drivers: corporate earnings, interest rate expectations, and the concentration of wealth within specific sectors.
Current Performance Trends and Market Drivers
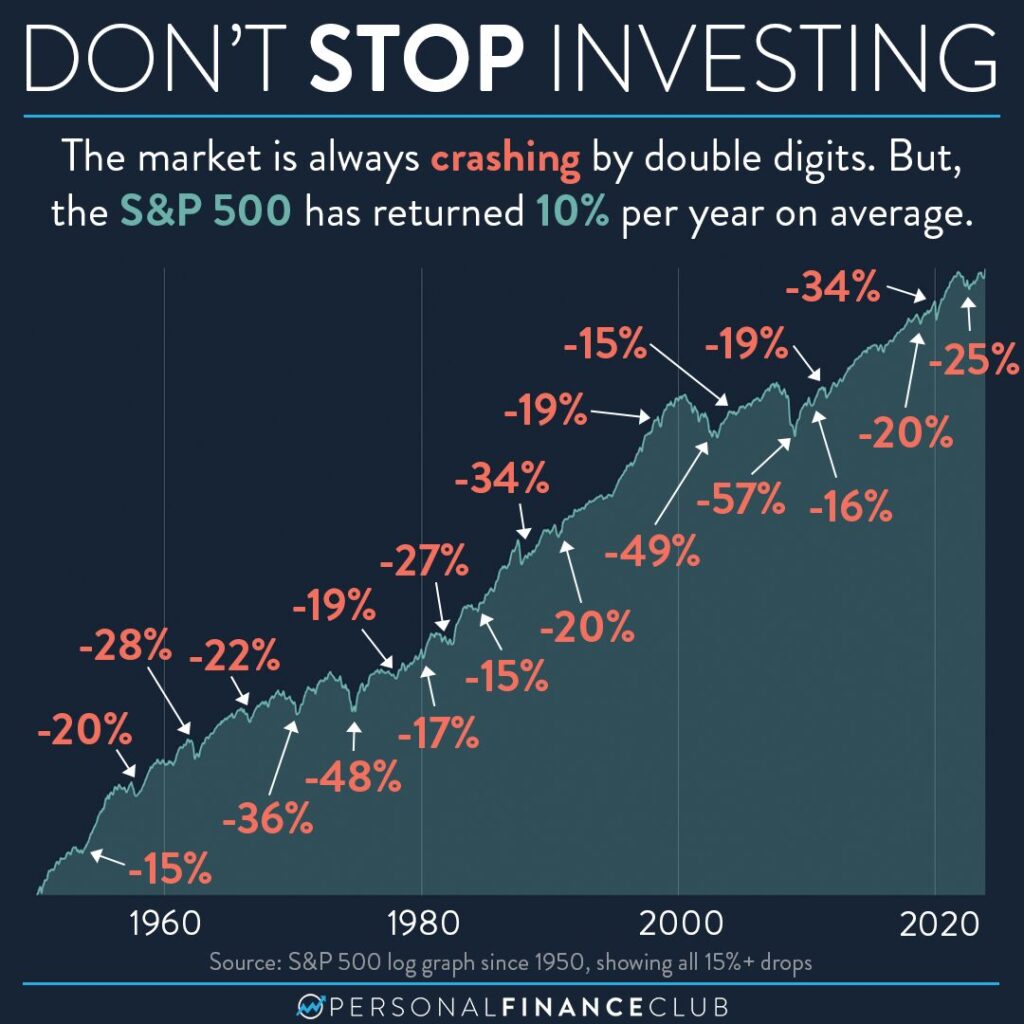
The recent performance of the S&P 500 has been characterized by a notable resilience that has surprised many veteran analysts. Despite fears of a looming recession and the highest interest rates seen in decades, the index has maintained a generally bullish posture. This strength is largely attributed to a few core factors that have acted as pillars for the market.
The Role of Technology and the “Magnificent Seven”
One cannot discuss the current state of the S&P 500 without addressing the massive influence of a handful of mega-cap technology stocks. Often referred to as the “Magnificent Seven”—Apple, Microsoft, Alphabet, Amazon, Nvidia, Meta, and Tesla—these companies have contributed a disproportionate amount of the index’s total gains. Because the S&P 500 is a market-cap-weighted index, the performance of these giants heavily dictates the movement of the entire benchmark.
The surge in artificial intelligence (AI) interest has been a primary catalyst. Investors have flocked to companies that provide the hardware (like Nvidia) and the software infrastructure (like Microsoft and Alphabet) necessary to power the next industrial revolution. While this has driven the index to new heights, it has also led to concerns about market breadth. When only a few stocks are pulling the weight of the other 493, the market becomes more vulnerable to localized volatility within the tech sector.
Inflation and the Federal Reserve’s Pivot
The S&P 500’s performance is inextricably linked to the Federal Reserve’s stance on interest rates. For much of the past two years, the market was weighed down by aggressive rate hikes aimed at cooling rampant inflation. However, as inflationary pressures have begun to moderate, the narrative has shifted toward “higher for longer” or potential rate cuts.
The index tends to perform well when there is clarity. The transition from a period of tightening to a period of stability—or “pause”—historically provides a tailwind for equities. Investors are currently pricing in a “soft landing,” a scenario where the Fed successfully lowers inflation without triggering a deep economic contraction. As long as the labor market remains strong and consumer spending holds up, the S&P 500 continues to find support even in a high-rate environment.
Sector Rotation and Market Breadth
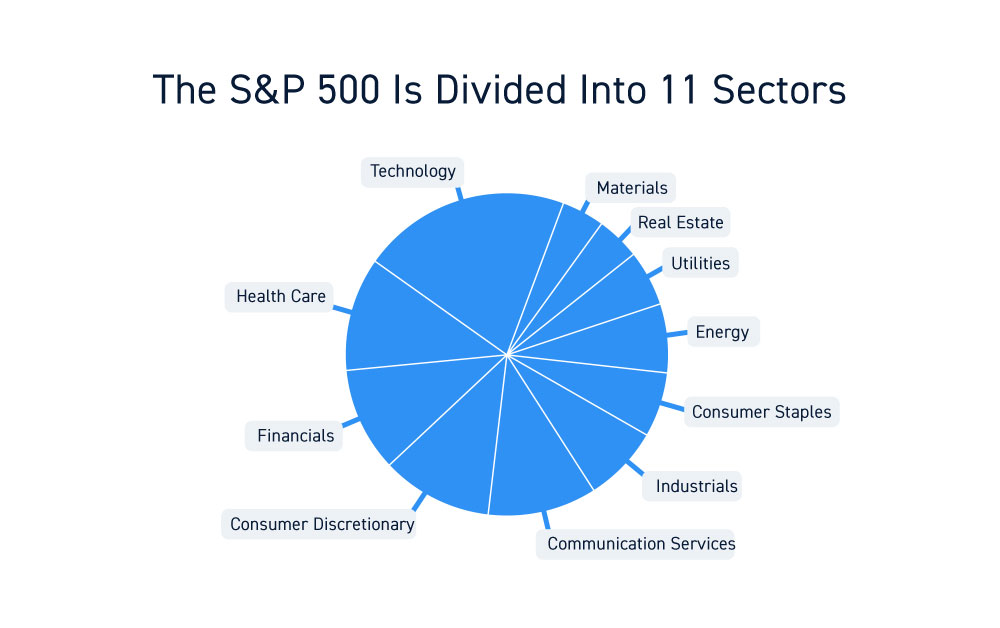
While tech has led the charge, recent months have shown glimpses of sector rotation. This occurs when investors move capital out of high-flying growth stocks and into undervalued areas like Industrials, Financials, or Energy. A healthy market is one where gains are distributed across various sectors. Analysts closely monitor the “equal-weighted” version of the S&P 500 to see if the average company is keeping up with the tech titans. Improving breadth is often seen as a sign of a sustainable bull market.
Analyzing Corporate Earnings and Valuation Metrics
To determine if the S&P 500 is “doing well” in a fundamental sense, we must look at the actual profitability of its constituent companies. Stock prices eventually follow earnings, and the recent earnings seasons have provided a mixed but generally positive outlook.
The Price-to-Earnings (P/E) Ratio Debate
The P/E ratio is the most common metric used to determine if the market is overvalued or undervalued. Currently, the S&P 500’s forward P/E ratio is trading above its 10-year and 20-year averages. To some, this suggests that the market is “expensive” and due for a correction. However, proponents argue that higher valuations are justified because the index is now more heavily weighted toward high-margin, high-growth technology companies than it was in previous decades.
If earnings continue to grow at a pace that justifies these premiums, the index can maintain its current levels. If earnings growth stalls, however, the S&P 500 could face significant downward pressure as valuations “compress” back to historical norms.
Revenue Growth vs. Margin Compression
Profitability isn’t just about how much money a company brings in (revenue); it’s about how much it keeps after expenses (margin). Throughout the recent inflationary period, many S&P 500 companies demonstrated remarkable “pricing power,” passing on increased costs to consumers to maintain their margins.
As inflation cools, the focus is shifting. Investors are looking for organic revenue growth rather than just price increases. Companies that can demonstrate productivity gains—perhaps through the integration of AI or streamlined operations—are being rewarded with higher stock prices. Conversely, companies struggling with rising labor costs or weakening consumer demand are seeing their contributions to the index diminish.
Dividend Trends and Buybacks
Another way to gauge the health of the S&P 500 is through capital returns. Corporate America remains flush with cash, and many companies have continued to increase dividends and engage in share buybacks. Buybacks reduce the total number of shares outstanding, which increases earnings per share (EPS) and often supports the stock price. Even in a volatile market, the commitment to returning value to shareholders provides a “floor” for many of the index’s blue-chip components.
Macroeconomic Influences on the Index
The S&P 500 does not exist in a vacuum. It is the product of the global macroeconomic environment, and several external factors are currently dictating its momentum.
The Resilience of the U.S. Consumer
Consumer spending accounts for approximately two-thirds of the U.S. GDP. Because many of the largest companies in the S&P 500—from Amazon to Walmart to Visa—rely on consumer activity, the health of the household balance sheet is paramount. Despite high interest rates affecting mortgages and credit card debt, the American consumer has remained surprisingly resilient. Low unemployment rates have provided a steady stream of income, allowing the S&P 500 to weather the storm of tighter monetary policy.
Geopolitical Risks and Energy Costs
Volatility in the S&P 500 often stems from events outside of Wall Street. Geopolitical tensions in Eastern Europe and the Middle East have a direct impact on energy prices and global supply chains. Since the S&P 500 includes a significant Energy sector and many multinational corporations, any spike in oil prices or disruption in trade can lead to increased volatility. Investors often view the S&P 500 as a “safe haven” during global turmoil compared to emerging markets, but it is by no means immune to global shocks.
The Impact of AI on Future Productivity
There is a growing belief among economists that we are at the beginning of a massive productivity boom driven by generative AI. If this technology allows companies within the S&P 500 to produce more with less, it could lead to a long-term expansion of profit margins. This “hope” is currently baked into the prices of many stocks. The challenge for the index moving forward is whether these productivity gains materialize fast enough to satisfy investor expectations.
Strategies for Investing in the S&P 500 Today
Understanding how the S&P 500 is doing is only half the battle; the other half is knowing how to position a portfolio in response. Whether the index is at an all-time high or in the midst of a correction, certain principles remain constant for the disciplined investor.
Passive vs. Active Management
The rise of the S&P 500 index fund has revolutionized personal finance. For most investors, a passive approach—simply buying an ETF that tracks the index—has proven to be more effective than trying to pick individual winning stocks. Because the S&P 500 self-cleans (meaning underperforming companies are removed and rising stars are added), it is an inherently adaptive investment.
However, in a top-heavy market dominated by a few tech names, some investors are opting for “equal-weight” ETFs to reduce their exposure to the volatility of the Magnificent Seven. This strategy allows for more participation in the “other 493” companies that may have more room to run if the market breadth expands.
The Power of Dollar-Cost Averaging
Given the current high valuations, some investors are hesitant to put a large lump sum of money into the market. This is where dollar-cost averaging (DCA) becomes invaluable. By investing a fixed amount of money at regular intervals, regardless of the index’s price, investors buy more shares when prices are low and fewer when they are high. This mitigates the risk of “timing the market” poorly and focuses on the long-term compounding of the S&P 500.
Rebalancing and Risk Tolerance
When the S&P 500 performs exceptionally well, it can cause an investor’s portfolio to become “stock-heavy,” exceeding their original risk tolerance. For example, if an investor intended to have a 60/40 split between stocks and bonds, a massive run-up in the S&P 500 might push that ratio to 75/25. Periodically rebalancing—selling some winners to buy assets that haven’t run as much—is a critical discipline to ensure that a market downturn doesn’t result in catastrophic losses.
Future Outlook: What to Expect in the Coming Quarters
As we look toward the future, the S&P 500 remains a tale of two possibilities. On one hand, the potential for a technological renaissance and a “soft landing” could propel the index to unprecedented heights. On the other hand, the risks of persistent inflation, high interest rates, and geopolitical instability remain ever-present.
Analysts will be watching the “yield curve” and manufacturing data closely. If the economy shows signs of a sharp slowdown, the S&P 500 will likely experience a period of consolidation or correction. However, historical data shows that over long horizons, the index has an incredible capacity to recover and set new records.
Ultimately, the S&P 500 is doing what it has always done: reflecting the collective expectations, fears, and innovations of the global marketplace. While the short-term path may be rocky, the index continues to serve as the primary engine of wealth creation for millions of investors worldwide. Its ability to adapt to new economic realities—from the industrial age to the internet age and now the AI age—is why it remains the gold standard for measuring financial progress. Over the long term, the question isn’t just how the S&P 500 is doing today, but how it will evolve to lead the economy of tomorrow.
aViewFromTheCave is a participant in the Amazon Services LLC Associates Program, an affiliate advertising program designed to provide a means for sites to earn advertising fees by advertising and linking to Amazon.com. Amazon, the Amazon logo, AmazonSupply, and the AmazonSupply logo are trademarks of Amazon.com, Inc. or its affiliates. As an Amazon Associate we earn affiliate commissions from qualifying purchases.