
In the realm of finance, numbers are the primary language, but percentages are the grammar that gives those numbers meaning. Whether you are analyzing the performance of a stock portfolio, determining the profitability of a business venture, or simply trying to stick to a household budget, the question of “how do you get a percentage” is foundational. Percentages allow us to normalize data, making it possible to compare a small startup’s growth to a multinational corporation’s expansion, or to understand the true cost of a loan regardless of the principal amount.
Understanding how to derive and apply percentages is not merely an academic exercise; it is a critical skill for wealth preservation and growth. In this guide, we will explore the fundamental mechanics of financial percentages, their application in investment and business, and how they serve as the ultimate tool for personal financial discipline.
The Fundamentals of Financial Percentages
At its simplest level, a percentage represents a fraction of 100. In finance, this “part of a whole” concept is used to express everything from tax rates to market share. However, the calculation involves more than just simple division; it requires an understanding of the relationship between different financial variables.
The Core Formula: Part over Whole
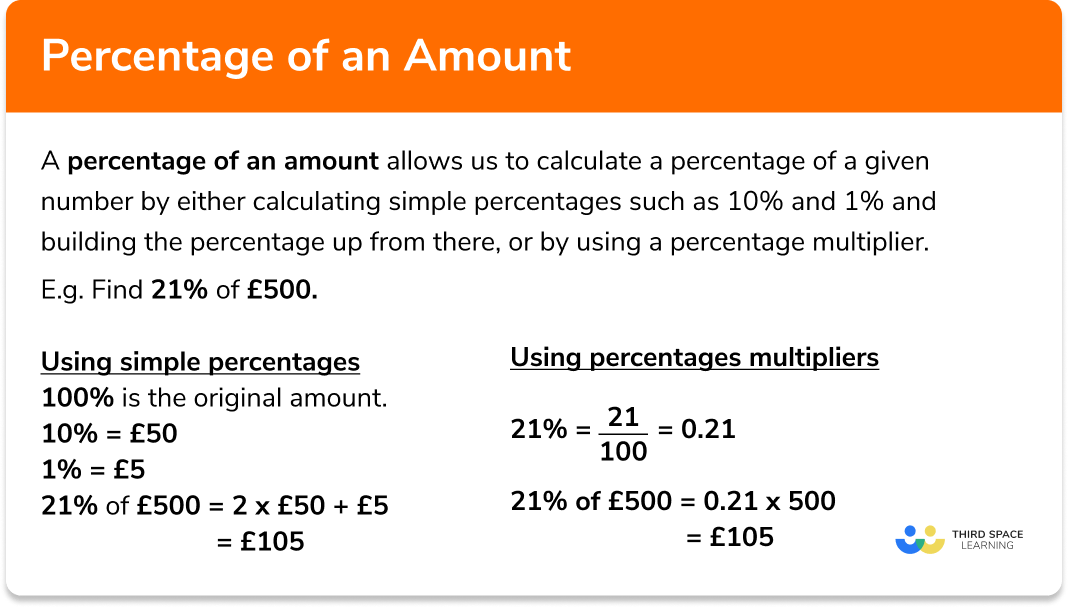
To get a basic percentage, you take the “part” (the specific value you are investigating) and divide it by the “whole” (the total value or the original amount), then multiply by 100.
For example, if you earned $5,000 in dividends from a portfolio worth $100,000, the calculation is $(5,000 / 100,000) times 100 = 5%$. This result tells you your dividend yield. Without the percentage, the $5,000 figure lacks context. Is it a good return? On a $10,000 investment, it would be a staggering 50%; on a $1,000,000 investment, it would be a meager 0.5%. The percentage provides the necessary scale.
Understanding Percentage Increase and Decrease
In the world of investing, we are rarely looking at a static snapshot. We are usually looking at movement. To calculate the percentage change—such as a stock’s growth or a portfolio’s decline—you use the following formula:
[(New Value – Old Value) / Old Value] x 100.
If you bought a share of a company at $150 and it rose to $180, your gain is $30. To find the percentage increase: $(30 / 150) times 100 = 20%$. This is vital for “Money” niche professionals because it allows for an apples-to-apples comparison between different asset classes. A $30 gain on a $150 stock is much more significant than a $30 gain on a $1,000 stock.
Evaluating Investment Performance
When we move from basic math to strategic wealth management, percentages become the primary metric for success. Investors do not just care about how much money they made; they care about the efficiency of their capital.
Calculating Return on Investment (ROI)
ROI is the gold standard for measuring financial efficiency. It follows the percentage change formula but is used to evaluate the total gain or loss relative to the cost. High-net-worth individuals and corporate finance officers use ROI to decide where to allocate their next dollar.
A common pitfall for many is failing to include all costs in the “whole” part of the equation. If you buy a rental property for $300,000 but spend $50,000 on renovations and $10,000 in closing costs, your “whole” is $360,000. If you sell it for $400,000, your percentage return is calculated against the total $360,000 investment, not the initial purchase price. Accuracy in “getting the percentage” ensures that you aren’t overestimating your financial success.
Compound Interest: The Power of Percentage over Time
Perhaps the most famous application of percentages in finance is compound interest. Unlike simple interest, which is calculated only on the principal, compound interest is calculated on the principal plus the accumulated interest of previous periods.
The percentage rate (APY—Annual Percentage Yield) determines the velocity of this growth. Small fluctuations in these percentages lead to massive differences over decades. For instance, a $10,000 investment at a 7% annual return grows to roughly $76,000 in 30 years. At 10%, that same $10,000 grows to over $174,000. Understanding how to calculate these percentages helps investors realize that chasing even a 1% or 2% higher return—or avoiding a 1% management fee—can result in hundreds of thousands of dollars in difference by retirement.

Business Profitability and Margin Analysis
For entrepreneurs and business owners, percentages are the difference between a thriving enterprise and a failing one. Revenue is often a “vanity metric,” while percentage margins represent the “sanity metric.”
Gross vs. Net Profit Margins
A business may bring in $1 million in sales, but that number is meaningless without knowing the margins.
- Gross Profit Margin: This is (Revenue – Cost of Goods Sold) / Revenue. It shows how efficiently a company produces its products.
- Net Profit Margin: This is (Total Revenue – All Expenses) / Revenue. This is the “bottom line.”
If a business has a net profit margin of 5%, it means for every dollar earned, only five cents is kept as profit. By focusing on increasing this percentage—rather than just increasing raw sales—a business owner can become more profitable without the risks associated with rapid scaling.
Markup vs. Margin: Avoiding Common Errors
One of the most frequent mistakes in business finance is confusing markup with margin.
- Markup is the percentage added to the cost to reach a selling price. If an item costs $100 and you sell it for $150, the markup is 50%.
- Margin is the percentage of the selling price that is profit. In the same scenario, the $50 profit divided by the $150 selling price results in a 33.3% margin.
Business owners who aim for a 50% profit margin but mistakenly apply a 50% markup will find themselves short on cash. Understanding the mathematical distinction between these two percentages is vital for pricing strategies and financial health.
Personal Finance Ratios for Wealth Management
On a personal level, “getting a percentage” is about creating a roadmap for financial freedom. Financial advisors often use specific percentage-based benchmarks to evaluate a client’s financial standing.
The 50/30/20 Rule
One of the most effective ways to manage personal cash flow is through a percentage-based budget. This rule suggests allocating:
- 50% of income to Needs (housing, utilities, groceries).
- 30% of income to Wants (entertainment, dining out, hobbies).
- 20% of income to Savings and Debt Repayment.
The beauty of using percentages instead of fixed dollar amounts is that the budget scales with your income. As your salary increases, your lifestyle can expand slightly (the 30%), but your savings (the 20%) also increase proportionally. This prevents “lifestyle creep,” where expenses rise to meet income, leaving the individual with no more net worth than when they earned half as much.
Debt-to-Income (DTI) Ratios
When you apply for a mortgage or a loan, lenders don’t just look at your salary; they look at your DTI ratio. This is your total monthly debt payments divided by your gross monthly income. Most lenders prefer a DTI below 36%, with no more than 28% of that going toward a mortgage. Knowing how to calculate this percentage allows you to see yourself through the eyes of a creditor, helping you manage your borrowing power and interest rate eligibility.
Using Percentages for Strategic Decision-Making
Ultimately, the ability to calculate and interpret percentages leads to better high-level decision-making. It moves a person from a reactive financial state to a proactive one.
Tax Planning and Effective Rates
Taxation is rarely a flat number. Between deductions, credits, and progressive tax brackets, your “marginal” tax rate (the tax on your last dollar earned) is different from your “effective” tax rate (the actual percentage of your total income that goes to the government). By calculating your effective tax rate, you can make informed decisions about contributing to tax-advantaged accounts like a 401(k) or an IRA. If your effective rate is high, the “percentage” value of a tax deduction increases significantly.

Diversification and Asset Allocation
Portfolio management is entirely a game of percentages. An investor doesn’t say, “I have $50,000 in stocks”; they say, “I am 60% allocated to equities.” This percentage-based approach ensures that the portfolio remains balanced. If the stock market performs well and your equity allocation drifts to 75%, you know it is time to rebalance by selling stocks and buying other assets to return to your target percentage. This disciplined approach—driven by the math of percentages—forces you to “buy low and sell high” automatically.
In conclusion, “how do you get a percentage” is a question that opens the door to total financial literacy. Whether you are measuring the growth of a small savings account or the operating efficiency of a corporation, the percentage is the ultimate tool for clarity, comparison, and control. By mastering these calculations, you gain the ability to look past the surface-level numbers and understand the true mechanics of wealth.
aViewFromTheCave is a participant in the Amazon Services LLC Associates Program, an affiliate advertising program designed to provide a means for sites to earn advertising fees by advertising and linking to Amazon.com. Amazon, the Amazon logo, AmazonSupply, and the AmazonSupply logo are trademarks of Amazon.com, Inc. or its affiliates. As an Amazon Associate we earn affiliate commissions from qualifying purchases.