In the realm of personal finance and wealth management, numbers are the language of progress. Whether you are tracking the growth of a retirement account, analyzing the performance of a stock portfolio, or evaluating the success of a small business venture, the ability to calculate and interpret percentage change is one of the most vital skills in your toolkit. While raw numbers tell you the “what,” percentage change tells you the “how much” in relation to where you started. It provides the context necessary to make informed, data-driven decisions that can mean the difference between financial stagnation and exponential growth.
Understanding how to calculate percentage change is more than just a mathematical exercise; it is a fundamental pillar of financial literacy. It allows investors to compare disparate assets—such as a high-growth tech stock and a steady dividend-paying utility—on an even playing field. This guide explores the mechanics of percentage change within the “Money” niche, detailing its applications in investing, budgeting, and long-term financial planning.
1. The Fundamentals of Percentage Change in Financial Contexts
At its core, percentage change measures the relative difference between an initial value and a final value. In the world of money, this is the primary metric used to communicate volatility, growth, and inflation. Without the context of percentage, a $100 gain is ambiguous; it is a monumental success on a $200 investment (50% gain) but a negligible fluctuation on a $1,000,000 portfolio (0.01% gain).
The Core Formula: New vs. Old
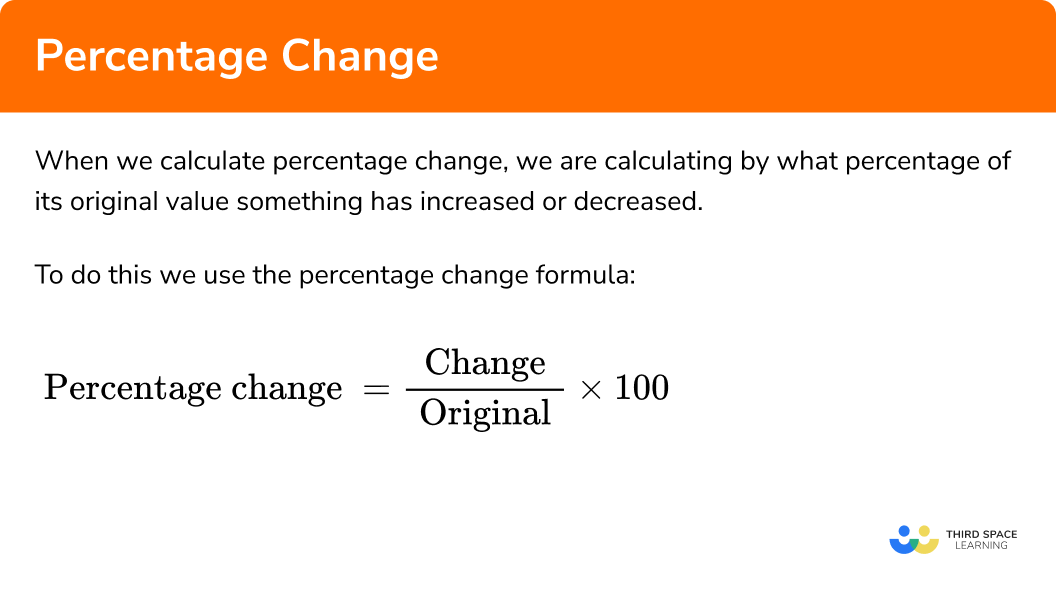
The formula for percentage change is straightforward, yet its implications are profound. To find the percentage change, you subtract the original value (Old) from the new value (New), divide the result by the original value, and then multiply by 100.
Formula: ((New Value - Old Value) / |Old Value|) * 100
In financial terms, this represents your “Return on Investment” (ROI) for a specific period. For example, if you purchased a share of a company for $150 and it is now trading at $180, your calculation would be: (($180 - $150) / $150) * 100 = 20%. This 20% increase provides a clear indicator of the asset’s performance regardless of the specific dollar amount invested.
Distinguishing Between Gains and Losses
Percentage change is a bidirectional metric. A positive result indicates a “capital gain” or appreciation, while a negative result indicates a “capital loss” or depreciation. In personal finance, tracking negative percentage changes is often more critical than tracking positive ones.
Understanding the “Directionality of Change” helps in risk management. If your monthly expenses move from $3,000 to $3,300, that is a 10% increase in your cost of living. Conversely, if a discount reduces a bill from $200 to $150, you have achieved a 25% savings. Recognizing these shifts allows you to adjust your budget dynamically rather than waiting for a year-end review.
2. Measuring Investment Performance and Portfolio Dynamics
For the modern investor, percentage change is the heartbeat of the market. It is used to evaluate the efficacy of a strategy and to compare individual performance against benchmarks like the S&P 500 or the Nasdaq.
Realized vs. Unrealized Gains
When discussing percentage change in investing, it is vital to distinguish between “paper” changes and “actual” changes. An unrealized gain occurs when the market price of an asset you own increases, but you have not yet sold it. If your crypto portfolio shows a 40% increase over the last month, that is an unrealized percentage change.
The calculation remains the same, but the financial implication is different. Professional money managers use these percentages to decide when to “rebalance” a portfolio. If one asset class grows by a significant percentage, it may represent a larger portion of your portfolio than originally intended, increasing your risk exposure. By calculating the percentage change of each asset class, you can systematically sell high and buy low to maintain your target allocation.
The Impact of Compounding and Cumulative Change
One of the most common mistakes in personal finance is the “Addition Fallacy”—the belief that a 10% gain one year and a 10% gain the next year equals a 20% total gain. In reality, percentage changes are multiplicative when they occur over time.
This is the essence of compound interest. If you start with $10,000 and it grows by 10% (to $11,000) and then grows by another 10%, the second 10% is calculated based on the new $11,000 total, resulting in $12,100—a total cumulative change of 21%. Understanding this nuance is essential for long-term retirement planning, as it demonstrates how consistent, small percentage gains lead to massive wealth accumulation over decades.
3. Percentage Change in Business Finance and Budgeting

Beyond the stock market, percentage change is an indispensable tool for managing a business or a household budget. It serves as an early warning system for financial health.
Monitoring Revenue Growth and Overhead Fluctuations
For entrepreneurs and business owners, the “Year-over-Year” (YoY) and “Quarter-over-Quarter” (QoQ) percentage change in revenue are the primary indicators of a company’s trajectory. If revenue increases by 5% but operating expenses increase by 15%, the business is becoming less efficient despite making more money.
By applying the percentage change formula to individual line items in a budget—such as marketing spend, payroll, or raw materials—a business owner can pinpoint exactly where capital is being eroded. For instance, a 12% increase in the cost of goods sold (COGS) might prompt a strategic decision to raise prices or find a new supplier to protect the net profit margin.
Analyzing Inflation and Purchasing Power
On a personal level, percentage change helps individuals understand the “hidden tax” of inflation. Central banks often target a 2% annual inflation rate. If your annual salary increase is only 3%, but the Consumer Price Index (CPI) shows a 5% increase in the cost of living, your “real” income has actually experienced a negative percentage change in terms of purchasing power.
Calculating the percentage change in the price of essential goods (gas, groceries, rent) allows individuals to adjust their lifestyle and savings rates. If the cost of your “market basket” of goods has increased by 8% over the last year, you know that you must find an 8% increase in income or a corresponding 8% decrease in discretionary spending just to maintain your current standard of living.
4. Advanced Applications: Risk Assessment and The Math of Loss
In high-level financial planning, percentage change is used to measure “volatility”—the frequency and magnitude of price swings. This is where the concept of risk is quantified.
Volatility and the Standard Deviation of Returns
Investors look at the average percentage change of an asset over time to determine its risk profile. A stock that fluctuates between -5% and +5% monthly is considered “stable,” whereas one that swings between -30% and +30% is “volatile.”
Understanding these percentages is crucial for “Asset Allocation.” Younger investors might seek assets with high positive percentage change potential, accepting the risk of high negative swings. Conversely, those nearing retirement often shift toward assets with lower, more predictable percentage changes to preserve their capital.
The Asymmetry of Gains and Losses
Perhaps the most important lesson in the “Money” niche regarding percentage change is the “Math of Loss.” Most people assume that if they lose 50% of their money, they only need a 50% gain to get back to even. This is a dangerous mathematical error.
If you have $100 and lose 50%, you are left with $50. To get back to $100, you must gain $50. However, $50 is 100% of your current $50 balance. Therefore, a 50% loss requires a 100% gain just to break even. This asymmetry highlights why risk management—limiting the negative percentage change in your portfolio—is often more important than chasing the highest possible positive change.
5. Tactical Execution: Tools and Best Practices
To effectively manage your money using percentage change, you must move from theoretical understanding to tactical execution.
Leveraging Financial Tools for Automated Tracking
In the digital age, you don’t need to perform these calculations manually with a pencil and paper. Spreadsheet software like Microsoft Excel and Google Sheets are the gold standard for financial tracking. Using the formula =(B2-A2)/A2 (where A2 is the starting balance and B2 is the ending balance) and formatting the cell as a percentage allows for real-time monitoring of any financial metric.
Furthermore, many fintech apps and brokerage platforms provide “time-weighted” and “money-weighted” rates of return. These are sophisticated versions of percentage change that account for the timing of your deposits and withdrawals, giving you a more accurate picture of your personal performance versus the market.
Establishing a Routine of Review
The final step in mastering percentage change is consistency. Successful wealth builders review their financial “vital signs” regularly. This includes:
- Monthly Budget Review: Checking the percentage change in discretionary spending.
- Quarterly Portfolio Rebalancing: Checking if the percentage weight of any one asset has grown too large.
- Annual Net Worth Calculation: Measuring the year-over-year percentage change in total wealth.
By focusing on the percentage change rather than just the raw dollar amount, you gain a clearer, more objective view of your financial health. You move away from emotional reactions to market dips and toward a strategic, mathematical approach to building and preserving wealth. Whether you are aiming for a 7% annual return on your index funds or a 20% reduction in your debt-to-income ratio, the percentage change formula is the compass that will guide you toward your financial goals.
aViewFromTheCave is a participant in the Amazon Services LLC Associates Program, an affiliate advertising program designed to provide a means for sites to earn advertising fees by advertising and linking to Amazon.com. Amazon, the Amazon logo, AmazonSupply, and the AmazonSupply logo are trademarks of Amazon.com, Inc. or its affiliates. As an Amazon Associate we earn affiliate commissions from qualifying purchases.