In the world of finance, data is the language of progress. Whether you are tracking the growth of a startup’s monthly recurring revenue, evaluating the performance of a stock portfolio, or analyzing the rising costs of raw materials in a supply chain, understanding how to compute percentage increase is a fundamental skill. While the mathematical formula itself is straightforward, the implications of these calculations drive multi-million dollar decisions, influence central bank policies, and dictate personal investment strategies.
This guide explores the technical execution of calculating percentage growth and examines its vital role within the “Money” niche—specifically focusing on business finance, personal investing, and economic analysis.
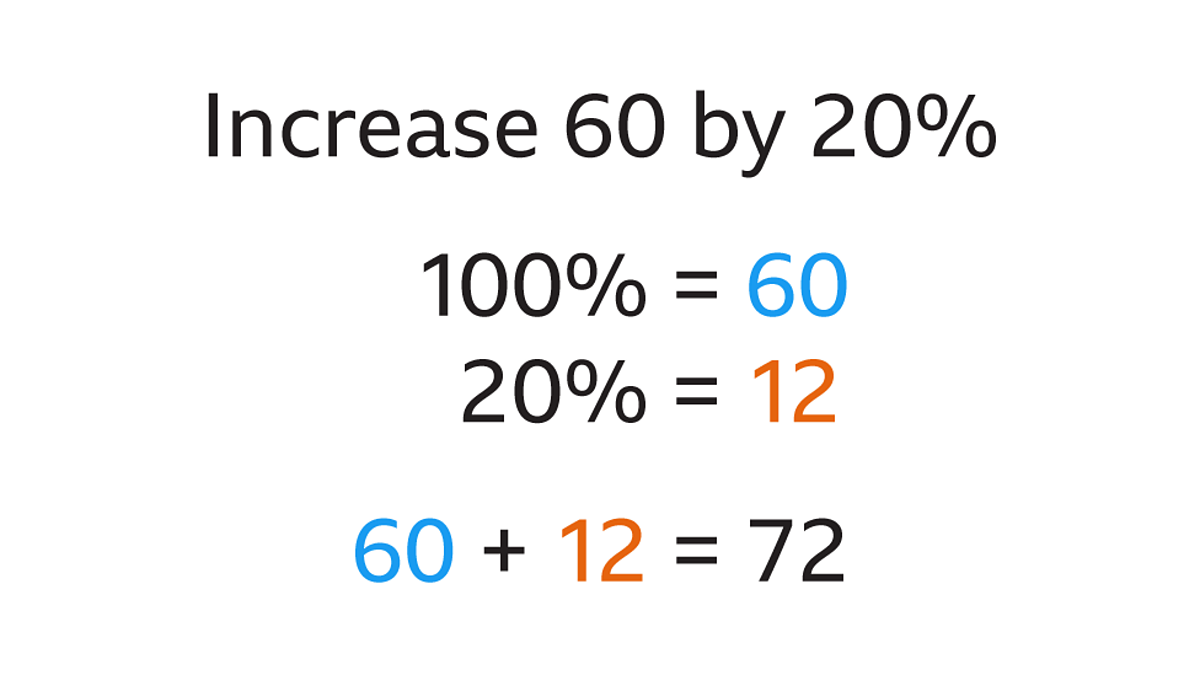
The Fundamental Formula for Calculating Percentage Growth
At its core, a percentage increase represents the relative change between an initial value and a final value, expressed as a fraction of 100. It allows investors and business owners to compare growth across different scales, making it possible to compare a small cap stock to a blue-chip giant on equal footing.
Breaking Down the Components: Old Value vs. New Value
To compute a percentage increase, you must first identify two distinct data points:
- The Original Value (V1): This is the starting point or the “base” amount. In finance, this might be your initial investment or last year’s total revenue.
- The New Value (V2): This is the current or final amount.
The relationship between these two numbers tells the story of growth. If the new value is higher than the original value, you have a positive percentage change, commonly referred to as a percentage increase.
The Step-by-Step Calculation Process
The formula for percentage increase is:
((New Value – Original Value) / Original Value) × 100
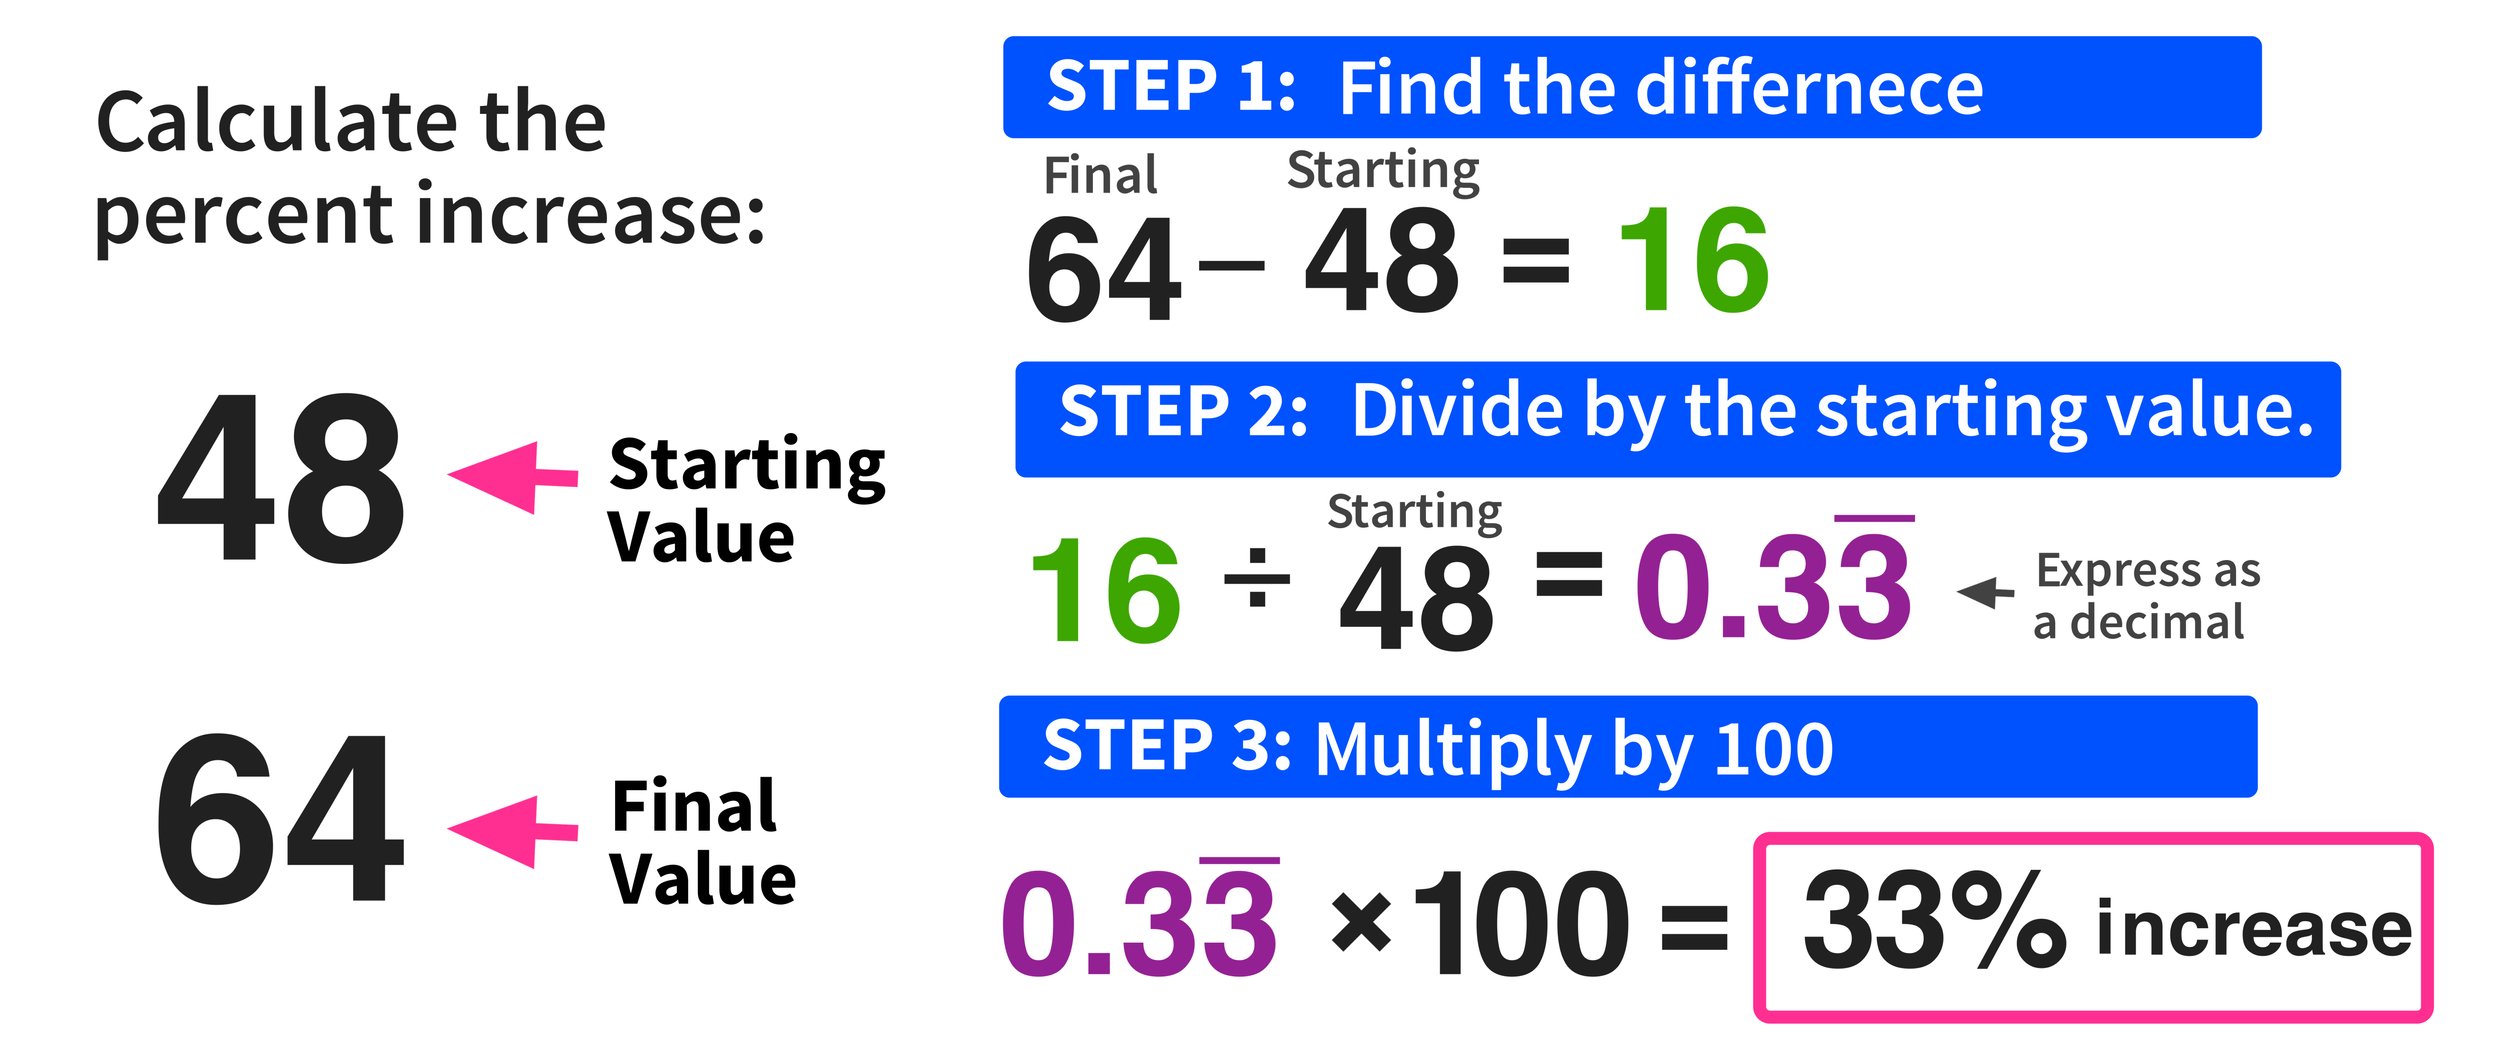
To arrive at the correct figure, follow these three steps:
- Step 1: Find the Absolute Difference. Subtract the original value from the new value. This gives you the “nominal” growth.
- Step 2: Divide by the Original Value. This step is crucial because it contextualizes the growth. A $10,000 increase is massive for a lemonade stand but negligible for a Fortune 500 company. Dividing by the starting point creates a ratio.
- Step 3: Convert to a Percentage. Multiply the resulting decimal by 100 and add the percent symbol (%).
For example, if a business earned $500,000 in revenue in 2022 and $650,000 in 2023, the calculation would be:
($650,000 – $500,000) / $500,000 = 0.30.
0.30 × 100 = 30% increase.
Why Percentage Increase Matters in Personal Finance and Investing
In personal finance, calculating percentage increase is the primary method for assessing the “Return on Investment” (ROI). It moves the conversation away from raw dollars and toward efficiency and performance.
Tracking Portfolio Performance Over Time
Investors rarely look at their gains in a vacuum. If your brokerage account grew by $5,000 this year, you might feel successful. However, if your starting balance was $1,000,000, that is only a 0.5% increase—which likely underperforms even the most conservative savings accounts. Conversely, if your starting balance was $10,000, that $5,000 gain represents a 50% increase, indicating an exceptional investment strategy.
By computing percentage increases, investors can compare the performance of different asset classes—such as real estate, equities, and crypto—to determine where their capital is working the hardest.
Analyzing Compound Annual Growth Rates (CAGR)
While simple percentage increase measures growth between two points, serious investors use these calculations to understand the Compound Annual Growth Rate (CAGR). The CAGR provides a smoothed annual rate of return over a period of time, accounting for the “compounding” effect where gains earn their own gains.
Understanding how to calculate basic percentage increases is the prerequisite for mastering CAGR, which is the gold standard for evaluating long-term wealth building. It allows an individual to see past the yearly volatility of the market and understand the “geometric mean” of their financial progress.
Using Percentage Increase for Business Strategy and Revenue Analysis
For business owners and corporate executives, percentage increase is the ultimate Key Performance Indicator (KPI). It is used to set targets, reward performance, and signal health to external stakeholders and investors.

Measuring Year-over-Year (YoY) and Month-over-Month (MoM) Growth
In business finance, the most common application of percentage increase is the Year-over-Year (YoY) analysis. By comparing the current month’s performance to the same month in the previous year, businesses can account for seasonality. For instance, a retail store might see a 200% MoM increase in December due to holiday shopping, but a YoY calculation will reveal whether this December was actually better or worse than the last.
MoM (Month-over-Month) growth is more common in high-growth sectors like SaaS (Software as a Service) or FinTech. In these industries, a 5% to 10% MoM increase is often the benchmark for a healthy, scaling startup.
Evaluating Profit Margins and Cost Escalation
Percentage increase isn’t always about “good” growth. Businesses also use it to track the rising cost of goods sold (COGS) and overhead. If your revenue increases by 10% but your operational expenses increase by 15%, your business is actually becoming less efficient.
By calculating the percentage increase in expenses, management can identify “margin compression.” This is a scenario where costs grow faster than income, threatening the long-term viability of the enterprise. Monitoring these percentages allows for proactive price adjustments or cost-cutting measures before the business enters a deficit.
Avoiding Common Pitfalls and Misinterpretations
The simplicity of the percentage increase formula often leads to overconfidence, resulting in common errors that can skew financial reporting and investment decisions.
The Difference Between Percentage Points and Percentage Change
One of the most frequent mistakes in financial media and corporate boardrooms is confusing “percentage points” with “percentage increase.”
Suppose an interest rate rises from 10% to 12%.
- This is an increase of 2 percentage points.
- However, the percentage increase of the rate itself is actually 20% (since 2 is 20% of 10).
In a business context, if your market share grows from 20% to 25%, you have gained 5 percentage points, but your business has actually grown its market presence by 25%. Conflating these two terms can lead to massive miscalculations in revenue projections and market analysis.
Understanding the Impact of Negative Starting Values
The standard percentage increase formula fails when the starting value is zero or negative. In business finance, this often happens when a company moves from a net loss (negative income) to a net profit.
If a company lost $10,000 last year and made $10,000 this year, you cannot simply plug those numbers into the standard formula, as it would result in a mathematically confusing result. In such cases, financial analysts typically describe the change in absolute dollar terms or use the absolute value of the denominator, though most professional reports will simply label the growth as “N/A” or “Turnaround” to avoid misleading stakeholders.
Practical Tools and Templates for Faster Financial Computation
While manual calculation is essential for understanding the logic, professional financial environments rely on automation to ensure accuracy and speed.
Excel and Google Sheets Formulas
In the world of business finance, Microsoft Excel remains the dominant tool. To compute percentage increase in a spreadsheet:
- Place the original value in cell A1.
- Place the new value in cell B1.
- In cell C1, enter the formula:
=(B1-A1)/A1. - Format cell C1 as a “Percentage” using the toolbar.
This automated approach allows for “What-If” analysis, where an investor can change the new value to see what percentage increase is required to reach a specific financial goal.
The Role of Financial Calculators in Budgeting
For personal finance, many online tools and mobile apps incorporate percentage increase calculators to help with budgeting. For example, when evaluating a salary offer, a candidate can use these tools to calculate the percentage increase from their current salary to see if the new role covers the increased cost of living in a different city.
Furthermore, internal business dashboards—like those found in QuickBooks or SAP—automatically generate percentage increase reports for every line item in a budget. This allows finance teams to spot “variance,” which is the difference between what was budgeted and what was actually spent, expressed as a percentage.
Conclusion: The Strategic Value of the Percent
Computing a percentage increase is more than a mathematical exercise; it is a critical diagnostic tool in the world of money. For the individual investor, it provides clarity amidst market noise. For the business owner, it provides a roadmap for scaling and efficiency. By mastering the formula and understanding the nuances of how these figures are applied, you gain a sharper perspective on financial health and a more robust ability to project future success. Whether you are aiming for a 10% increase in savings or a 50% increase in corporate equity, the journey begins with this fundamental calculation.
aViewFromTheCave is a participant in the Amazon Services LLC Associates Program, an affiliate advertising program designed to provide a means for sites to earn advertising fees by advertising and linking to Amazon.com. Amazon, the Amazon logo, AmazonSupply, and the AmazonSupply logo are trademarks of Amazon.com, Inc. or its affiliates. As an Amazon Associate we earn affiliate commissions from qualifying purchases.