In the realm of personal finance and wealth management, numbers are the language of progress. Whether you are tracking the growth of a retirement portfolio, evaluating the success of a side hustle, or simply trying to outpace inflation, understanding how your capital moves is paramount. At the heart of this understanding lies a deceptively simple mathematical concept: percentage change.
While most people can look at two numbers and see that one is larger than the other, the ability to calculate and interpret the percentage change between them is what separates passive observers from savvy financial strategists. This metric provides context, allowing you to compare the performance of a $1,000 investment against a $100,000 investment on an equal playing field. This article explores the mechanics of calculating percentage change and its critical application across the landscape of money, investing, and business finance.

The Fundamentals of Percentage Change in Personal Finance
Before diving into complex market analysis, one must master the basic formula. Percentage change measures the degree to which a value has increased or decreased relative to its starting point. In the context of money, this represents your “yield” or your “loss” in relative terms.
The Universal Formula
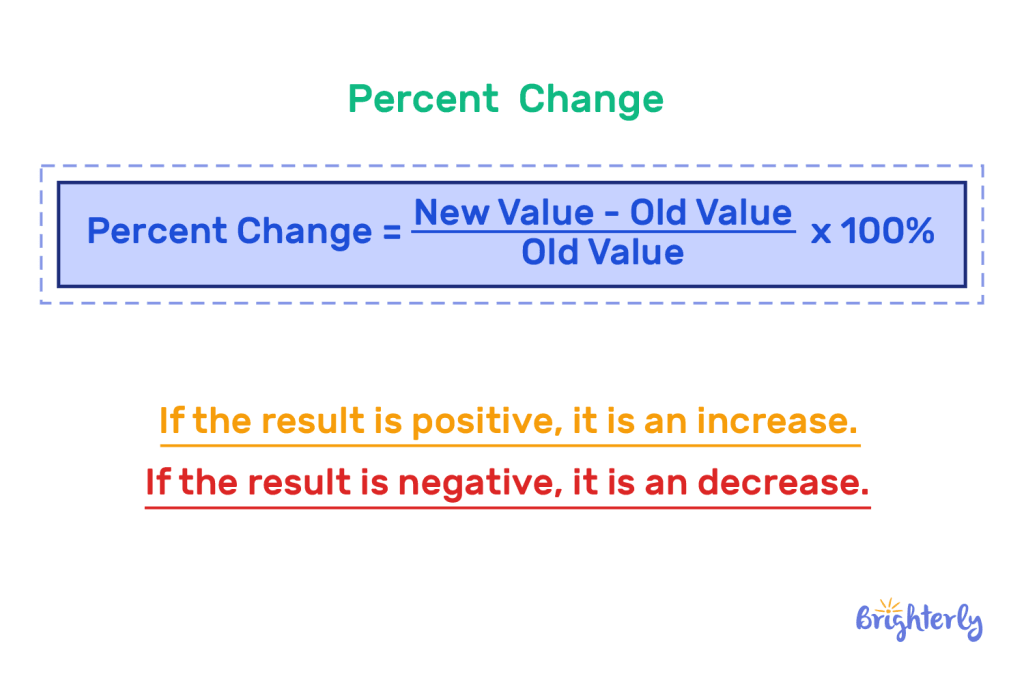
To calculate the percentage change between an original value (the “old” number) and a new value (the “new” number), use the following steps:
- Subtract the original value from the new value (New – Old).
- Divide that result by the original value.
- Multiply the final decimal by 100 to get the percentage.
Formula: [(New Value – Old Value) / |Old Value|] × 100
For example, if you invested $5,000 in a brokerage account last year and it is now worth $5,750, your calculation would be: ($5,750 – $5,000) / $5,000 = 0.15. Multiplying by 100 gives you a 15% increase.
Why Context Matters in Budgeting
In personal budgeting, percentage change is often more informative than absolute dollar amounts. If your monthly grocery bill increases by $50, the impact depends entirely on your baseline. If you were spending $200, that is a staggering 25% increase—a major red flag for your budget. If you were spending $1,000, it is a mere 5% uptick. By tracking the percentage change of your expenses month-over-month, you can identify “lifestyle creep” before it erodes your ability to save.
Monitoring Net Worth Trajectory
Net worth is the ultimate scorecard in personal finance. However, as your wealth grows, the absolute dollar gains become less indicative of your momentum. A $10,000 increase in net worth is monumental for a recent college graduate with $5,000 to their name (a 200% increase), but it is negligible for a retiree with a $2 million nest egg (a 0.5% increase). Calculating the annual percentage change of your net worth ensures you are maintaining a growth rate that aligns with your long-term financial goals.
Analyzing Investment Performance and Market Volatility
In the world of investing, percentage change is the primary tool used to evaluate Return on Investment (ROI) and risk. It allows investors to strip away the noise of share prices—which can range from pennies to hundreds of thousands of dollars—and focus on the actual growth of their purchasing power.
Understanding ROI and Capital Gains
When you buy a stock or a piece of real estate, the percentage change between your purchase price (cost basis) and the current market value tells you how hard your money is working for you. This is essential when comparing different asset classes. You might find that your “boring” index fund increased by 12% over the year, while a “high-growth” individual stock you picked increased by only 8%. Without calculating the percentage change, you might be misled by the sheer dollar volume of the trades rather than the efficiency of the capital.
The Asymmetry of Loss
One of the most critical insights for any investor is the mathematical asymmetry of percentage change. If an asset drops by 50%, it does not need a 50% gain to return to its original value; it needs a 100% gain.
- Initial Value: $100
- 50% Drop: $50
- 50% Gain on $50: $75 (Still down 25% from the start!)
- 100% Gain on $50: $100
Understanding this dynamic through the lens of percentage change helps investors appreciate the importance of downside protection and risk management. It illustrates why avoiding large losses is often more important for long-term wealth than chasing outlier gains.
Comparing Benchmark Performance
Professional investors rarely look at their returns in a vacuum. They use percentage change to compare their portfolio’s performance against a benchmark, such as the S&P 500. If the S&P 500 saw a 10% increase over a period and your portfolio saw an 8% increase, the percentage change tells you that you underperformed the market by 2 percentage points. This “relative change” is vital for deciding whether an active investment strategy is worth the time or fees involved.
Business Finance: Measuring Growth and Scalability
For entrepreneurs, freelancers, and side hustlers, percentage change is the pulse of the business. It is used to track everything from revenue growth to the efficiency of marketing spend.
Year-over-Year (YoY) and Month-over-Month (MoM) Growth
In business, seasonality can distort numbers. A retail business might see a 300% increase in revenue in December compared to November. While impressive, a more valuable metric is the Year-over-Year (YoY) percentage change—comparing December of this year to December of last year. This tells the business owner if the brand is truly expanding or if they are simply experiencing a standard seasonal peak.
Profit Margin Analysis
Revenue is a “vanity metric”; profit is “sanity.” Percentage change is used to monitor the health of profit margins. If your revenue increases by 20% but your operating costs increase by 30%, your business is becoming less efficient despite making more money. By calculating the percentage change in your “Cost of Goods Sold” (COGS) relative to the percentage change in your “Gross Income,” you can pinpoint exactly where your margins are being squeezed.
Scaling the Side Hustle
For those managing a side hustle, time is the most limited resource. Calculating the percentage change in your “Hourly Rate” (Total Profit / Hours Worked) is the best way to determine if a side hustle is worth scaling. If your income increased by 10% but the time required to earn it increased by 50%, the percentage change in your efficiency is negative. This insight allows for data-driven decisions on whether to pivot, automate, or outsource tasks.
Financial Tools and Real-World Applications
While the formula for percentage change is straightforward, the modern financial landscape offers various tools to automate these calculations and provide deeper insights.
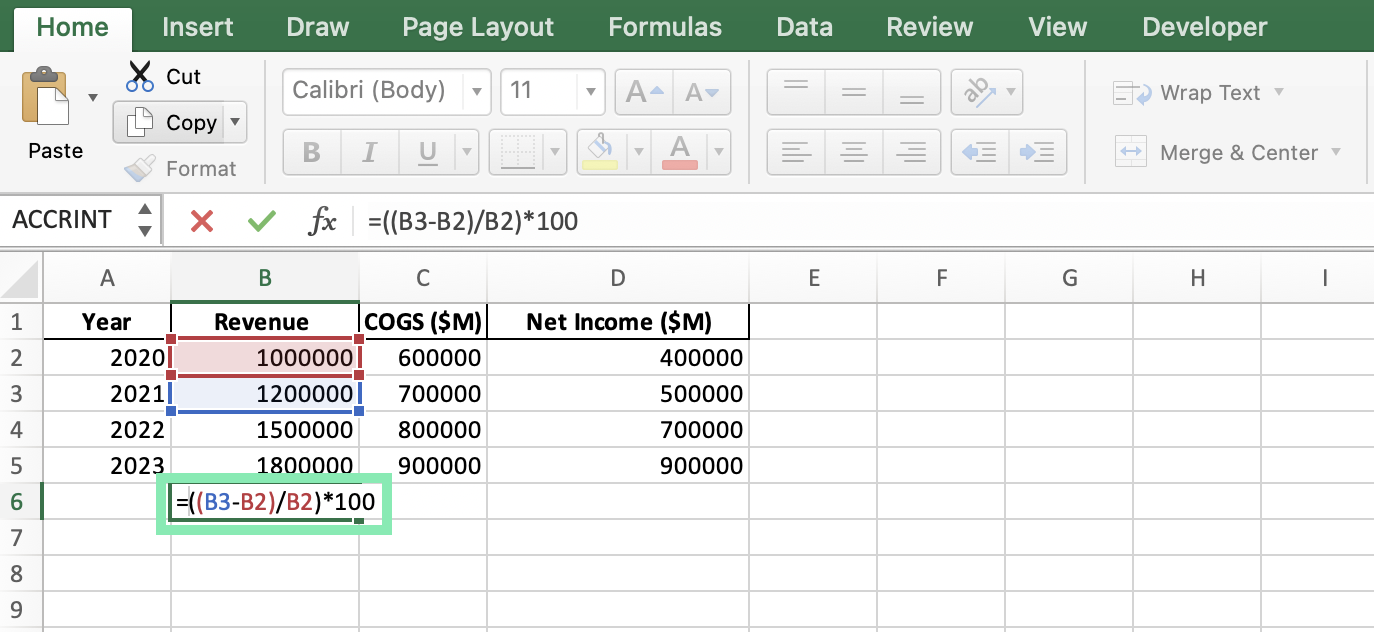
Leveraging Spreadsheets for Financial Tracking
Excel and Google Sheets are the gold standards for financial modeling. To calculate percentage change automatically, you can use a simple cell formula. If your starting balance is in cell A2 and your ending balance is in cell B2, the formula =(B2-A2)/A2 (formatted as a percentage) will give you the instant change. Advanced users can use this to create “Rolling Returns” charts, which show the percentage change over various intervals (e.g., 3-month, 6-month, and 12-month windows), providing a clearer picture of trend lines than a single data point could.
Accounting for Inflation (Real vs. Nominal Change)
A crucial nuance in money management is the difference between nominal percentage change and real percentage change. If your savings account offers a 4% interest rate (nominal change), but inflation is running at 5%, your “real” percentage change in purchasing power is -1%.
To calculate this, you subtract the inflation rate from your nominal return. In an era of fluctuating currency values, failing to account for the percentage change in the Consumer Price Index (CPI) can lead to the “money illusion,” where you feel wealthier because you have more dollars, even though those dollars buy fewer goods and services.
Using Financial Calculators for Debt Reduction
Percentage change is also a powerful motivator in debt management. When using the “Debt Snowball” or “Debt Avalanche” methods, tracking the percentage change in your total debt balance can be more encouraging than looking at the raw numbers. Seeing a 15% reduction in total debt over six months provides a psychological win that fuels the discipline needed to reach total financial freedom.
Conclusion: The Power of Relative Thinking
Calculating the percentage change between two numbers is more than just a math exercise; it is a fundamental skill for financial literacy. It allows you to strip away the distractions of large figures and focus on the underlying health of your finances. Whether you are analyzing a stock’s volatility, measuring the growth of a business, or protecting your savings from the silent erosion of inflation, percentage change provides the clarity needed to make informed, objective decisions.
In the pursuit of wealth, it is rarely the absolute numbers that tell the full story. Instead, it is the rate of change—the velocity and direction of your capital—that determines your ultimate financial destination. By mastering this simple calculation, you gain a lens through which the complex world of money becomes far more manageable and significantly more profitable.
aViewFromTheCave is a participant in the Amazon Services LLC Associates Program, an affiliate advertising program designed to provide a means for sites to earn advertising fees by advertising and linking to Amazon.com. Amazon, the Amazon logo, AmazonSupply, and the AmazonSupply logo are trademarks of Amazon.com, Inc. or its affiliates. As an Amazon Associate we earn affiliate commissions from qualifying purchases.