
Understanding the Consumer Price Index (CPI) is fundamental to grasping the economic health of a nation and its direct impact on personal finances. Often cited in news reports and economic analyses, the CPI is more than just a number; it’s a critical indicator of inflation, a measure of the average change over time in the prices paid by urban consumers for a market basket of consumer goods and services. For anyone navigating personal finance, investing, or simply trying to make sense of the cost of living, knowing how the CPI is calculated provides invaluable insight. This deep dive will demystify the process, revealing the meticulous steps involved and explaining why this economic metric holds such significant weight for consumers, businesses, and policymakers alike.
Understanding the Consumer Price Index (CPI)
Before we delve into the mechanics of its calculation, it’s crucial to establish a solid understanding of what the CPI is, why it matters, and who is responsible for its compilation. This foundational knowledge will contextualize the subsequent technical explanation, making the entire process more digestible and meaningful.
What is the CPI?
The Consumer Price Index (CPI) is an economic indicator that measures the average change over time in the prices paid by urban consumers for a market basket of consumer goods and services. Essentially, it tracks the cost of living for a typical household. The “market basket” is a conceptual collection of goods and services that consumers commonly purchase, ranging from food and housing to transportation, medical care, education, and recreation. By comparing the cost of this same basket of goods and services at different points in time, the CPI can quantify the rate of inflation or deflation. An increase in the CPI indicates inflation – meaning your money buys less than it did before – while a decrease suggests deflation.
Why is the CPI Important?
The importance of the CPI permeates various aspects of the economy and personal finance. For individuals, it directly influences purchasing power; if wages don’t keep pace with the CPI, real income declines. It’s often used to adjust Social Security benefits, government pensions, and even some private-sector wages (through cost-of-living adjustments or COLAs) to maintain living standards.
From a broader economic perspective, the CPI is a primary gauge of inflation, a key factor considered by central banks when setting monetary policy. High inflation, as indicated by a rapidly rising CPI, might prompt a central bank to raise interest rates to cool down the economy, while sustained low inflation or deflation could lead to rate cuts to stimulate growth. Businesses use CPI data to make pricing decisions, negotiate contracts, and plan investments. Economists and analysts rely on the CPI to assess the overall health and direction of the economy, predict future trends, and formulate policy recommendations.
Who Calculates the CPI?
In the United States, the Consumer Price Index is calculated and published monthly by the Bureau of Labor Statistics (BLS), an agency within the U.S. Department of Labor. The BLS is responsible for gathering vast amounts of price data, performing complex statistical analyses, and ensuring the accuracy and integrity of the CPI. This meticulous process ensures that the CPI remains a reliable and objective measure of inflation, free from political influence, and serves as a cornerstone of economic understanding for the public, businesses, and policymakers alike. Similar agencies exist in other countries, such as Eurostat for the Eurozone or Statistics Canada for Canada, each responsible for their respective national inflation measures.
The Core Steps to Calculating the CPI
Calculating the CPI is a sophisticated statistical undertaking that involves several distinct, systematic steps. While the BLS employs advanced methodologies and a vast data collection network, the underlying principle is relatively straightforward: comparing the cost of a fixed set of goods and services over time.
Step 1: Selecting a Market Basket of Goods and Services
The first critical step is defining the “market basket.” This isn’t a literal basket but a representative sample of thousands of goods and services purchased by urban consumers, weighted by their relative importance in household spending. The BLS conducts extensive consumer expenditure surveys to determine what people buy and in what proportions. For example, housing typically represents the largest portion of a household budget, so it receives a higher weighting in the market basket than, say, entertainment or apparel. This basket is periodically updated to reflect changes in consumer spending patterns, new products, and evolving lifestyles, ensuring its relevance. The categories include:
- Food and Beverages (e.g., cereals, milk, coffee, restaurant meals)
- Housing (e.g., rent, homeowners’ equivalent rent, fuels, utilities, furniture)
- Apparel (e.g., men’s, women’s, children’s clothing, footwear)
- Transportation (e.g., new and used vehicles, gasoline, public transportation)
- Medical Care (e.g., prescription drugs, physician services, hospital services)
- Recreation (e.g., televisions, toys, sporting goods, club memberships)
- Education and Communication (e.g., college tuition, internet services, telephone services)
- Other Goods and Services (e.g., tobacco, personal care products, funeral expenses)
Step 2: Collecting Price Data
Once the market basket is established, the BLS begins the arduous process of collecting price data. Every month, BLS data collectors visit or call thousands of retail stores, service establishments, rental units, and offices across various urban areas throughout the country. They record prices for about 80,000 items each month, including specific brands and varieties, to ensure consistency. For example, they don’t just record the price of “milk”; they might record the price of “one gallon of whole milk, Brand X, at Supermarket Y.” This level of detail is crucial for making accurate comparisons over time. Prices are collected for everything from a loaf of bread to a doctor’s visit, a gallon of gasoline, and a monthly rent payment.
Step 3: Determining the Base Period
To make comparisons meaningful, a “base period” is established. The base period is a reference point in time to which current prices are compared. For the CPI, the average prices for a specific three-year period (e.g., 1982-84 for the most commonly referenced CPI-U) are set to an index value of 100. All subsequent CPI values are then expressed in relation to this base. If the CPI in a later period is 120, it means that prices have, on average, increased by 20% since the base period. This normalization allows for easy tracking of price changes over extended periods.
Step 4: Calculating the Cost of the Market Basket
With all the price data collected and the market basket weighted, the BLS calculates the total cost of the market basket for both the current period and the base period. This involves summing the prices of all the items in the basket, weighted by their proportion of typical consumer spending. The formula essentially multiplies the quantity of each item in the basket by its price and then aggregates these values for all items.
Cost of Market Basket = (Price of Item A * Quantity of Item A) + (Price of Item B * Quantity of Item B) + ...
This calculation is done for both the current month and the base period, using the exact same quantities for each item to ensure that any change in the total cost is solely due to price fluctuations, not changes in consumption patterns.
Step 5: Computing the CPI
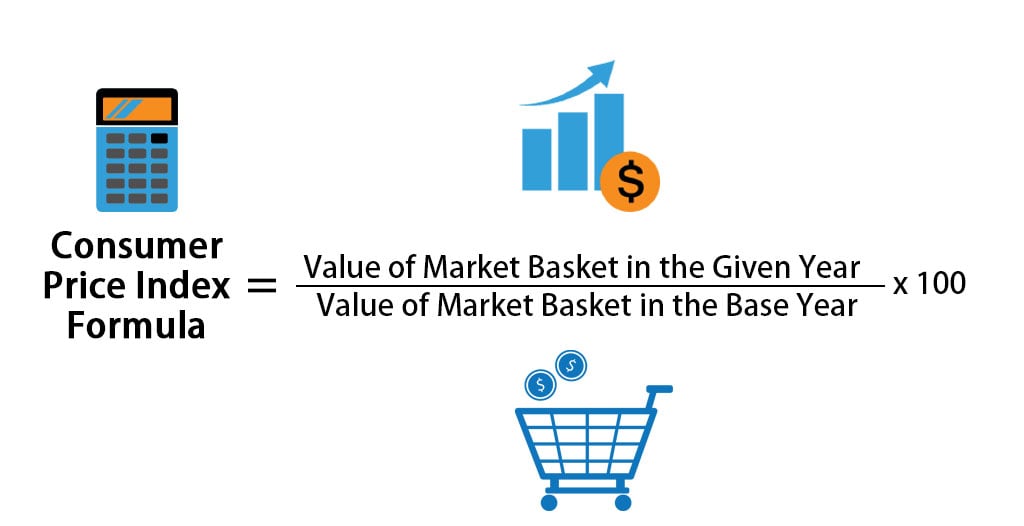
Finally, the CPI for a given period is calculated using a straightforward formula:
CPI = (Cost of Market Basket in Current Period / Cost of Market Basket in Base Period) * 100
Let’s illustrate with a simplified example:
- Assume a base period market basket cost of $200.
- Assume the current period market basket cost is $220.
CPI = ($220 / $200) * 100 = 110

A CPI of 110 means that the cost of the market basket has increased by 10% since the base period. To find the inflation rate between two periods, say from Period 1 to Period 2:
Inflation Rate = [(CPI in Period 2 - CPI in Period 1) / CPI in Period 1] * 100
If the CPI in January was 110 and in February was 112:
Inflation Rate = [(112 - 110) / 110] * 100 = (2 / 110) * 100 ≈ 1.82%
This indicates an approximate 1.82% inflation rate between January and February.
Interpreting CPI Data and Inflation
Calculating the CPI is just the first step; interpreting its movements and understanding the nuances of different CPI metrics are crucial for drawing accurate economic conclusions and making informed financial decisions.
Understanding CPI Fluctuations
The CPI is a dynamic index that fluctuates monthly, reflecting changes in consumer prices. A rising CPI generally signifies inflation, meaning the purchasing power of money is diminishing. Conversely, a falling CPI (or deflation) indicates that prices are decreasing, and money’s purchasing power is increasing. However, interpreting these fluctuations requires context. A sudden spike in the CPI might be due to temporary factors like a supply chain disruption or a surge in energy prices, while a sustained upward trend indicates broader inflationary pressures. Economists often look at annualized rates and trends over several months to get a clearer picture.
Annual vs. Monthly CPI
When the CPI is reported, it can be presented in several ways. The monthly change indicates how prices have changed from the previous month. This provides a very immediate snapshot but can be volatile. More commonly, the annualized change (often referred to as the year-over-year inflation rate) is cited, which compares the current month’s CPI to the CPI from the same month in the previous year. This smoothed-out figure removes seasonal variations and offers a clearer view of the underlying inflationary trend. For example, if the CPI for March 2024 is 3% higher than the CPI for March 2023, the annual inflation rate is 3%.
Core CPI vs. Headline CPI
Another important distinction is between Headline CPI and Core CPI.
- Headline CPI refers to the total CPI, encompassing all the goods and services in the market basket, including volatile items like food and energy. This is the most widely reported figure.
- Core CPI excludes the more volatile food and energy components. The rationale is that food and energy prices can swing wildly due to factors like weather patterns, geopolitical events, or sudden supply shocks, which may not reflect the underlying, longer-term inflationary pressures in the economy. Central banks often pay close attention to Core CPI because it’s considered a better indicator of sustained inflation trends and the effectiveness of monetary policy. While both are valuable, Core CPI helps differentiate transient price spikes from entrenched inflation.
The Impact and Limitations of the CPI
The CPI is an indispensable tool, but like any economic metric, it has its implications and criticisms. Understanding these aspects is vital for a holistic view of its utility.
How CPI Affects Your Finances (Wages, Investments, Spending)
The CPI directly influences the financial well-being of individuals in numerous ways:
- Wages and Salaries: Many employment contracts, particularly in unionized environments or government positions, include Cost-of-Living Adjustments (COLAs) tied to the CPI. If the CPI rises, wages may increase to maintain purchasing power. However, if wages don’t keep pace with inflation, real income effectively decreases.
- Social Security and Benefits: Social Security benefits and some other government assistance programs are indexed to the CPI, meaning their payouts increase annually to offset inflation. This protects beneficiaries from a decline in purchasing power.
- Investments: Inflation erodes the value of savings and investments. If the rate of return on an investment is lower than the inflation rate, the real return is negative, meaning your money buys less over time. Investors must consider inflation when evaluating asset classes like stocks, bonds, and real estate.
- Spending and Borrowing: A high CPI means that the cost of everyday goods and services is rising, making your money less valuable. It also influences interest rates on loans (mortgages, credit cards), as lenders factor in inflation expectations.
Economic and Policy Implications
Beyond individual finances, the CPI guides major economic and policy decisions:
- Monetary Policy: Central banks, such as the Federal Reserve in the U.S., use CPI data as a primary input when deciding whether to raise, lower, or maintain interest rates. Their mandate often includes maintaining price stability, and the CPI is their main tool for measuring that.
- Fiscal Policy: Governments use the CPI to adjust tax brackets, determine the poverty line, and calculate the real value of government spending programs.
- Business Decisions: Businesses monitor the CPI to inform pricing strategies, inventory management, wage negotiations, and capital expenditure planning. They need to understand how inflation will affect their costs and revenues.
Common Criticisms and Limitations
Despite its importance, the CPI faces several criticisms and has inherent limitations:
- Substitution Bias: The market basket is fixed for a period. However, consumers often substitute cheaper goods when prices rise (e.g., buying chicken instead of beef if beef prices surge). The fixed market basket doesn’t immediately capture this substitution, potentially overstating the true cost of living increase. The BLS tries to mitigate this with chained CPI (C-CPI-U) which accounts for substitution.
- Quality Bias: Over time, products improve in quality (e.g., a smartphone today is vastly more powerful than one ten years ago, even if the price is similar). Simple price comparisons don’t account for these quality improvements, which effectively make goods “cheaper” in real terms. The BLS uses “hedonic adjustments” to try and account for quality changes, particularly in electronics and vehicles.
- New Goods Bias: New products and services, especially revolutionary ones, are not immediately included in the market basket, taking time to be integrated. This means the initial price declines that often accompany new technologies (as they become more widely adopted and efficiently produced) are missed, potentially leading to an overstatement of inflation.
- Housing Costs: Measuring housing costs is complex. The CPI uses “owner’s equivalent rent” (OER) for homeowners, which estimates how much rent a homeowner would pay to rent their own home. This indirect measure can sometimes deviate from actual housing market dynamics.
- Representative Sample: While extensive, the market basket represents an “average” urban consumer. It might not accurately reflect the spending patterns and inflation experience of specific demographics, such as rural populations, the elderly, or very low-income households, who have different consumption baskets.
Beyond the Basics: Advanced Considerations
To truly appreciate the complexities and refinements in CPI calculation, it’s worth touching upon some advanced considerations that the BLS incorporates to make the index as accurate as possible.
Hedonic Adjustment
As mentioned, a significant challenge in measuring price changes is accounting for improvements in product quality. A computer bought today might cost roughly the same as one a few years ago, but it offers significantly more processing power, memory, and features. Simply comparing the nominal price would suggest no change, but the consumer is getting much more for their money. Hedonic adjustment is a statistical technique used to estimate the value of these quality improvements. It breaks down goods into their constituent characteristics (e.g., a computer’s processor speed, RAM, hard drive size) and estimates how much each characteristic contributes to the overall price. This allows the BLS to adjust prices downward for quality improvements, preventing the CPI from overstating inflation by treating a higher-quality, same-priced item as simply “unchanged in price.” This method is particularly prevalent for high-tech goods, vehicles, and appliances.
Substitution Bias
While consumers generally substitute cheaper goods for more expensive ones when prices change, the traditional CPI fixed-weight formula initially assumes consumers continue buying the same quantities. This can create an “upper-level substitution bias,” where the CPI overstates the true rise in the cost of living because it doesn’t immediately reflect consumers’ ability to mitigate price increases by changing their purchasing habits. To address this, the BLS developed the Chained Consumer Price Index (C-CPI-U). Unlike the traditional CPI-U, the C-CPI-U uses a formula that accounts for changes in consumer spending patterns more frequently. It incorporates current-period expenditure weights as well as base-period weights, effectively acknowledging that consumers will likely substitute away from items that have become relatively more expensive. The C-CPI-U typically shows a slightly lower inflation rate than the traditional CPI-U, making it a more accurate measure of how consumers actually experience price changes in a dynamic market.

Geographic Variations in CPI
It’s important to recognize that inflation isn’t uniform across an entire country. The cost of living varies significantly from one metropolitan area to another. To reflect this, the BLS publishes CPI data for specific regions and major metropolitan areas (e.g., CPI for New York-Newark-Jersey City, CPI for Los Angeles-Long Beach-Anaheim). While the national CPI provides an aggregate picture, these regional indices offer a more localized perspective, which is particularly relevant for individuals and businesses operating within specific geographic markets. These regional differences arise due to variations in local housing markets, labor costs, state and local taxes, and the availability of goods and services, all of which contribute to different experiences of inflation across the country.
In conclusion, the Consumer Price Index is a meticulously calculated economic indicator, essential for understanding inflation and its pervasive influence on our financial lives. From the careful selection of a market basket to sophisticated adjustments for quality and substitution, the BLS employs rigorous methods to provide a comprehensive and reliable measure. While debates about its perfect accuracy persist, the CPI remains an indispensable tool for individuals, businesses, and policymakers striving to navigate the ever-changing economic landscape.
aViewFromTheCave is a participant in the Amazon Services LLC Associates Program, an affiliate advertising program designed to provide a means for sites to earn advertising fees by advertising and linking to Amazon.com. Amazon, the Amazon logo, AmazonSupply, and the AmazonSupply logo are trademarks of Amazon.com, Inc. or its affiliates. As an Amazon Associate we earn affiliate commissions from qualifying purchases.