
In the dynamic world of personal finance, investing, and business operations, numbers tell a story. But raw numbers alone often lack the context needed for truly insightful decisions. This is where understanding percentage increase becomes not just useful, but absolutely crucial. Whether you’re tracking the growth of your investments, analyzing a pay raise, evaluating sales performance, or simply trying to comprehend inflation, the ability to accurately calculate and interpret percentage increase is a fundamental skill for anyone serious about managing their money effectively. It provides a standardized way to measure change, allowing for meaningful comparisons across different periods, assets, or even companies, regardless of their absolute sizes. Mastering this concept empowers you to make informed choices, spot trends, and assess the true impact of financial shifts on your wealth and well-being.

Understanding the Core Concept: Why Percentage Increase Matters in Finance
At its heart, a percentage increase quantifies the relative change in a value over time, expressing that change as a proportion of the original amount. It moves beyond simply noting a numerical difference and instead offers a normalized view, making it an indispensable tool in financial analysis.
What is Percentage Increase?
Percentage increase is a measure of the growth in a value from an original point to a new point, expressed as a percentage of the original value. For instance, if your investment grows from $100 to $120, the absolute increase is $20. But the percentage increase tells you that your investment grew by 20% of its original value. This relative measure is powerful because it provides a clear, universally understood metric of growth that can be easily compared. Without it, knowing that a company’s profit increased by $1 million might sound impressive, but it’s far more impactful to know if that represents a 1% increase on $100 million in profit or a 50% increase on $2 million. The context provided by percentage is everything.
The Power of Relative Change
While an absolute change (e.g., an increase of $500) gives you a precise numerical difference, it often fails to convey the true magnitude or significance of that change. Relative change, expressed as a percentage, provides this crucial context. Consider two scenarios: a $500 increase in a $1,000 portfolio and a $500 increase in a $100,000 portfolio. In absolute terms, both are the same. However, the first represents a 50% increase, while the second is only a 0.5% increase. The relative change immediately highlights which situation represents more significant growth proportionally. This comparative power is vital for evaluating performance, setting realistic expectations, and understanding the real impact of financial decisions. It helps in benchmarking against industry averages, personal goals, or historical data.
Key Applications in Personal and Business Finance
The utility of percentage increase permeates nearly every facet of financial management:
- Investing: Tracking the annual return on stocks, bonds, mutual funds, or real estate. Comparing the performance of different investment vehicles or fund managers.
- Personal Income: Calculating salary raises, understanding the growth of side hustle income year-over-year, or analyzing the impact of bonuses.
- Business Operations: Measuring sales growth, profit margin increases, customer acquisition cost improvements, or expense reductions. It’s critical for evaluating a company’s health and trajectory.
- Budgeting and Expenses: Monitoring increases in utility bills, groceries, or housing costs to understand the impact on your budget and identify areas for adjustment.
- Economic Indicators: Understanding inflation rates, GDP growth, interest rate changes, and unemployment fluctuations, all of which are commonly expressed as percentages.
By mastering the calculation of percentage increase, you equip yourself with a fundamental analytical tool for navigating and succeeding in your financial journey.
The Simple Formula: Step-by-Step Calculation for Financial Analysis
Calculating percentage increase is straightforward once you understand the underlying formula and apply it systematically. This process is universal, whether you’re dealing with personal investments or corporate earnings reports.
Deconstructing the Formula
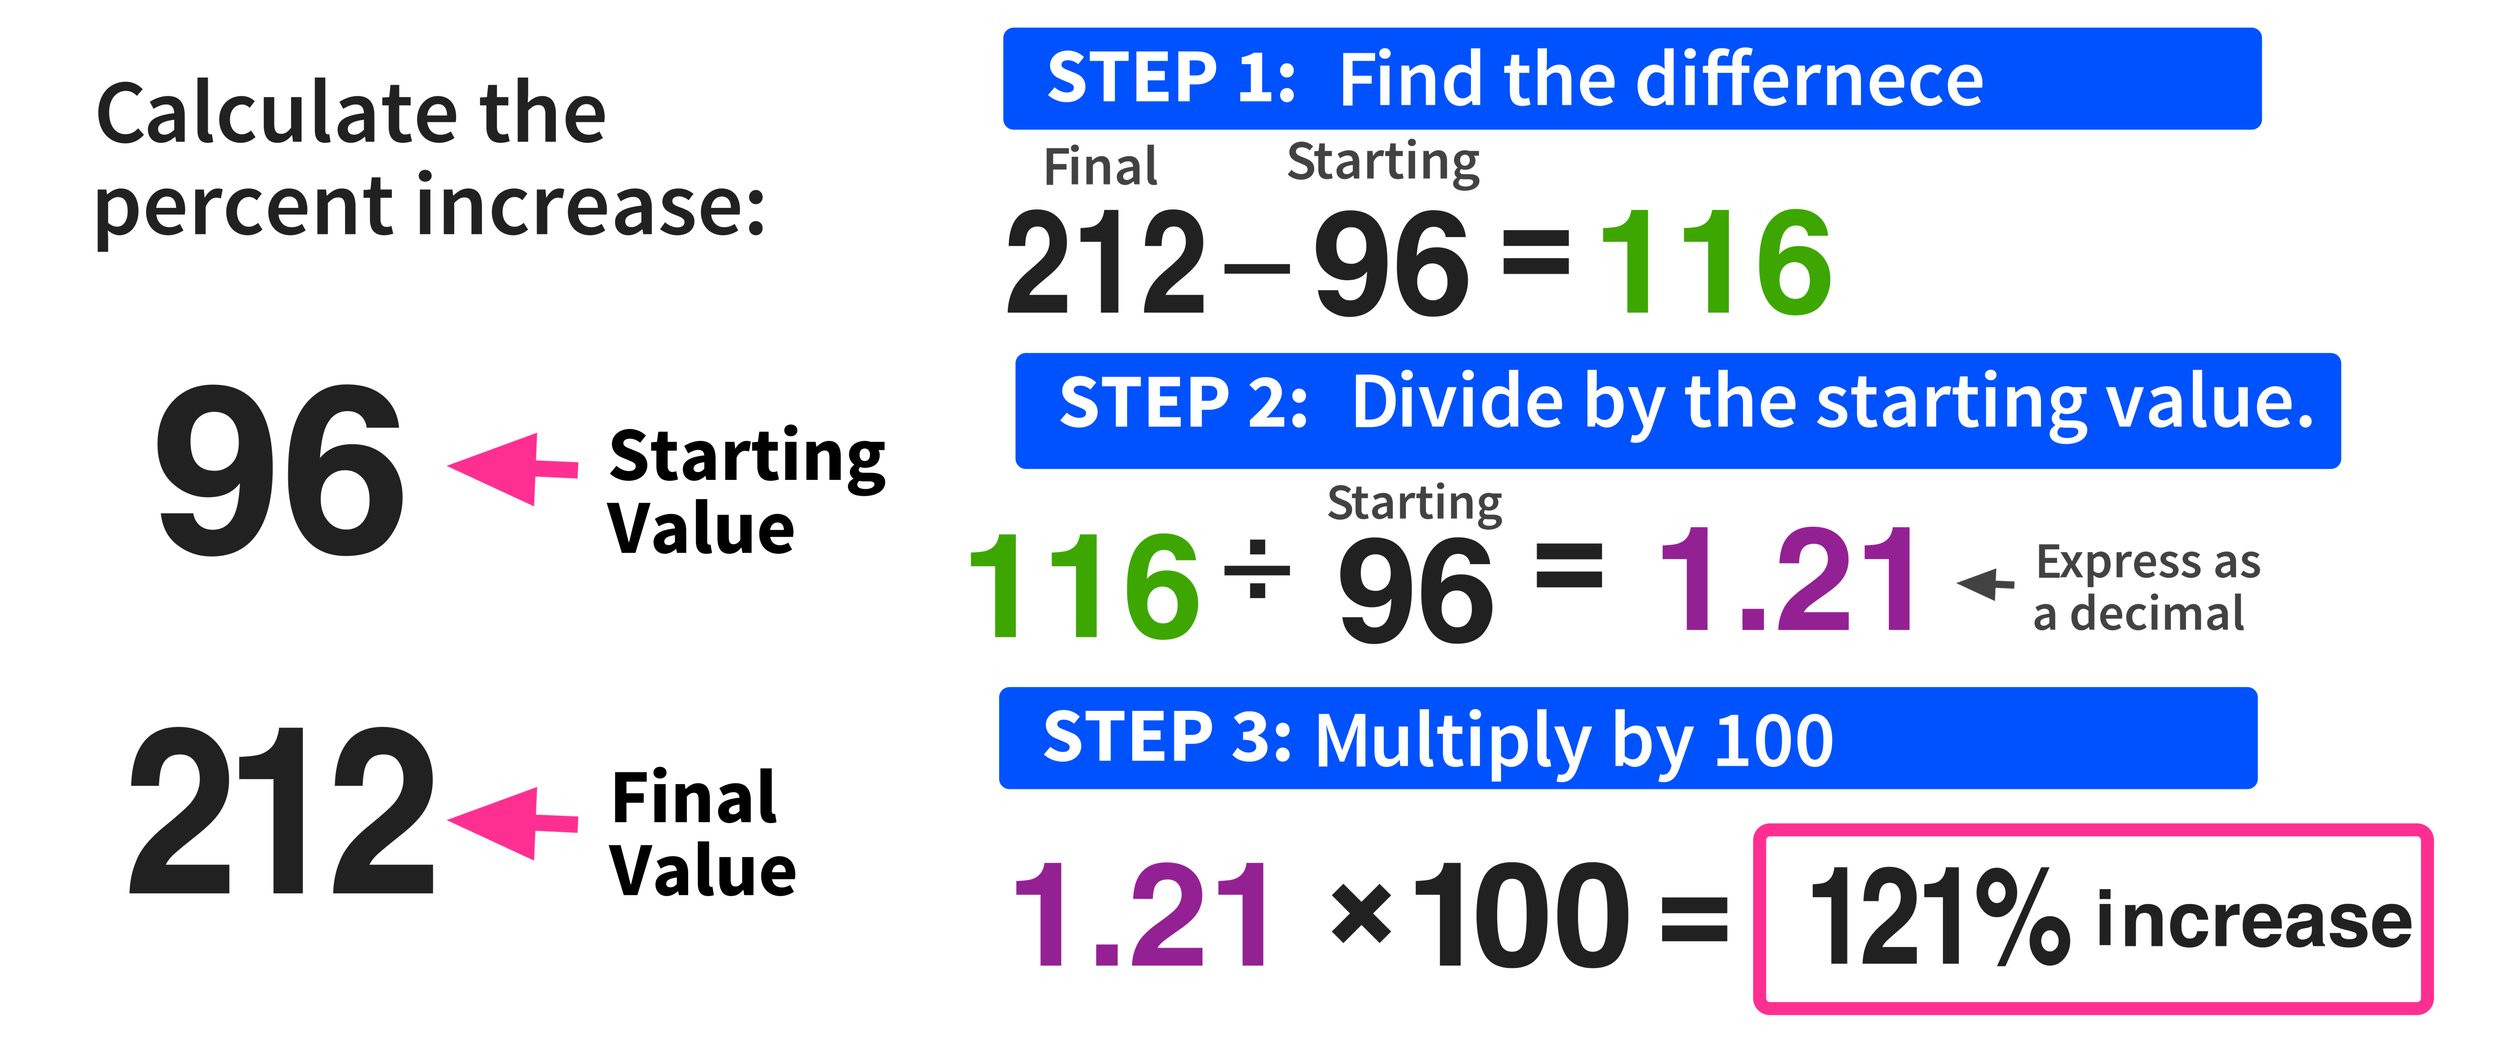
The fundamental formula for calculating percentage increase is:
Percentage Increase = ((New Value - Original Value) / Original Value) * 100
Let’s break down each component:
- New Value: This is the larger, updated amount after the increase.
- Original Value: This is the starting amount before the increase.
- (New Value – Original Value): This part calculates the absolute numerical increase.
- (/ Original Value): Dividing the absolute increase by the original value converts the increase into a decimal representation of the growth relative to the start.
- (* 100): Multiplying by 100 converts this decimal into a percentage.
Step-by-Step Calculation Guide
Let’s walk through an example to solidify the process. Suppose your investment portfolio was worth $50,000 at the beginning of the year and grew to $57,500 by the end of the year.
-
Find the Difference (New Value – Original Value):
Subtract the original value from the new value to determine the absolute amount of the increase.
$57,500 (New Value) – $50,000 (Original Value) = $7,500 (Absolute Increase) -
Divide by the Original Value:
Take the absolute increase and divide it by the original value. This gives you the increase as a decimal.
$7,500 / $50,000 = 0.15 -
Multiply by 100:
Convert the decimal to a percentage by multiplying it by 100.
0.15 * 100 = 15%
Therefore, your investment portfolio experienced a 15% increase over the year. This systematic approach ensures accuracy and consistency in your financial calculations.
Real-World Financial Scenarios: Applying Percentage Increase
The power of percentage increase truly comes alive when applied to practical financial scenarios. It transforms raw data into actionable insights, enabling better decision-making for individuals and businesses alike.
Tracking Investment Growth
One of the most common applications of percentage increase is in evaluating investment performance. Whether you hold stocks, mutual funds, real estate, or any other asset, understanding its growth in percentage terms is vital.
- Example: You bought shares in a company for $1,500. A year later, their value has risen to $1,800.
- Increase = $1,800 – $1,500 = $300
- Percentage Increase = ($300 / $1,500) * 100 = 20%
This 20% return allows you to compare this investment’s performance against other assets, market benchmarks, or your financial goals.

Analyzing Salary and Income Changes
For personal finance, percentage increase is essential for understanding your earning potential and the impact of raises.
- Example: Your annual salary was $60,000, and you received a raise to $63,000.
- Increase = $63,000 – $60,000 = $3,000
- Percentage Increase = ($3,000 / $60,000) * 100 = 5%
Knowing you received a 5% raise provides a clear picture of how your purchasing power might have changed relative to inflation or the general cost of living. It’s also useful for negotiating future compensation.
Evaluating Business Performance
In a business context, percentage increase is a critical metric for assessing various aspects of operational and financial health.
- Sales Growth: A company’s sales revenue grew from $2 million in Q1 to $2.5 million in Q2.
- Increase = $2.5M – $2M = $0.5M
- Percentage Increase = ($0.5M / $2M) * 100 = 25%
This indicates robust growth and can influence marketing strategies, production scaling, and investor confidence.
- Profit Margins: If a company’s net profit increased from $100,000 to $120,000.
- Increase = $120,000 – $100,000 = $20,000
- Percentage Increase = ($20,000 / $100,000) * 100 = 20%
This metric helps in understanding the efficiency of operations and cost management.
Understanding Inflation and Cost of Living
Government agencies and economic reports frequently use percentage increases to communicate changes in economic indicators.
- Inflation: If the Consumer Price Index (CPI) increased from 280 points to 285.6 points over a year.
- Increase = 285.6 – 280 = 5.6
- Percentage Increase = (5.6 / 280) * 100 = 2%
This 2% represents the annual inflation rate, indicating that the cost of a basket of goods and services increased by 2%. This information is crucial for personal budgeting and understanding the eroding power of stagnant income.
Common Pitfalls and Nuances in Financial Percentage Analysis
While the percentage increase formula is straightforward, misinterpretations or specific scenarios can lead to incorrect conclusions. Awareness of these nuances is crucial for accurate financial analysis.
The “Original Value” Trap
The most common mistake is misidentifying the “Original Value.” Always ensure you are dividing by the starting point from which the increase is measured. Forgetting this can lead to calculations that are either percentage decrease or simply incorrect percentages based on the wrong baseline. For instance, if a stock drops from $100 to $50, then rises back to $100, the first drop is a 50% decrease. The subsequent rise from $50 to $100 is a 100% increase, not 50%. The original value for the increase calculation is $50.
Dealing with Zero or Negative Original Values
The percentage increase formula is built on the premise of a positive, non-zero original value.
- Zero Original Value: If the original value is zero, division by zero is undefined, and thus, a percentage increase cannot be calculated in the standard way. For instance, if you had $0 in an account and now have $100, the “percentage increase” is infinite. In such cases, it’s better to state the absolute increase.
- Negative Original Value: While less common in simple growth scenarios, negative original values (e.g., going from a loss of -$100 to a profit of $50) also render the standard percentage calculation problematic for intuitive interpretation. A business going from a -$100,000 loss to a -$50,000 loss has “improved,” but a percentage increase might be misleading or difficult to contextualize. It’s often clearer to discuss absolute change or a change in “profitability” rather than a percentage increase on a negative base.
The Impact of Compounding
Percentage increases often don’t occur in isolation; they can compound over time. A 10% increase year-over-year for five years does not mean a 50% total increase. Instead, the increase in each subsequent year is applied to the new, larger value.
- Example: A $100 investment growing by 10% annually.
- Year 1: $100 * (1 + 0.10) = $110
- Year 2: $110 * (1 + 0.10) = $121
- Year 3: $121 * (1 + 0.10) = $133.10
The total increase over three years is ($133.10 – $100) / $100 * 100 = 33.1%, not 30%. Understanding compounding is vital for long-term financial planning, especially in investments and retirement savings.
Percentage Points vs. Percentage Change
This is a common source of confusion, particularly when discussing rates. A “percentage point” is the simple arithmetic difference between two percentages. A “percentage change” (or percentage increase/decrease) is the relative change of one percentage value to another.
- Example: An interest rate increases from 4% to 5%.
- Percentage Point Increase: 5% – 4% = 1 percentage point.
- Percentage Increase (of the rate itself): ((5 – 4) / 4) * 100 = (1 / 4) * 100 = 25%.
The interest rate itself increased by 25%, but it only went up by 1 percentage point. Always be clear about which metric is being discussed to avoid miscommunication in financial discussions.
Tools and Techniques for Efficient Calculation
While manual calculation is fundamental for understanding, various tools can significantly streamline the process, especially when dealing with complex datasets or frequent calculations.
Leveraging Spreadsheets (Excel/Google Sheets)
Spreadsheets are arguably the most powerful and versatile tools for financial calculations, including percentage increase. Their ability to handle large datasets, automate calculations, and visually represent data makes them indispensable.
- Basic Formula Application:
If your Original Value is in cell A2 and your New Value is in cell B2, the formula for percentage increase would be:
=(B2-A2)/A2*100
You can then drag this formula down to apply it to hundreds or thousands of rows of data, instantly calculating percentage increases for multiple items, periods, or investments. - Formatting: Spreadsheets also allow you to format the result directly as a percentage (e.g.,
=(B2-A2)/A2and then apply the ‘%’ cell format) which can be cleaner. - Visualizations: Once calculated, percentage increases can be used in charts and graphs to visualize trends, compare growth rates, and present financial insights clearly.
Online Calculators and Financial Apps
For quick, one-off calculations or when you don’t have access to a spreadsheet, online calculators and financial apps are incredibly convenient. Many websites offer dedicated “percentage increase calculators” where you simply input the original and new values, and the result is instantaneous.
- Advantages: Speed, ease of use, and accessibility from any device with internet access.
- Disadvantages: Less flexible for bulk calculations or integrating with other financial analyses compared to spreadsheets. Always ensure the calculator source is reputable to avoid errors.
Mental Math Shortcuts for Quick Estimates
While not suitable for precise financial reporting, developing some mental math shortcuts can help you quickly estimate percentage increases, which is useful for on-the-spot assessments or general understanding.
- Estimating 10%: To find 10% of a number, simply move the decimal one place to the left (e.g., 10% of $500 is $50).
- Estimating 1%: Move the decimal two places to the left (e.g., 1% of $500 is $5).
- Using these for approximations: If something increased from $400 to $480, you know the increase is $80. You can quickly see that $40 is 10% of $400, so $80 must be 20%. These quick estimations can help you verify calculator results or quickly grasp the magnitude of a change without needing precise tools.
Mastering these tools and techniques will not only save you time but also enhance the accuracy and depth of your financial analysis, making you a more informed and capable financial decision-maker.
In conclusion, understanding and calculating percentage increase is far more than a simple mathematical exercise; it’s a critical financial literacy skill that empowers individuals and businesses to navigate the complexities of economic growth and change. From evaluating personal investment returns and salary adjustments to analyzing business performance and broader economic trends, the ability to quantify relative change provides invaluable context. By consistently applying the straightforward formula, being mindful of common pitfalls, and leveraging modern tools like spreadsheets, you can transform raw numbers into meaningful insights. This mastery not only clarifies the past but also illuminates potential future trajectories, equipping you to make smarter, more strategic financial decisions that contribute directly to your wealth accumulation and financial well-being. Embrace this fundamental concept, and unlock a clearer, more insightful view of your financial world.
aViewFromTheCave is a participant in the Amazon Services LLC Associates Program, an affiliate advertising program designed to provide a means for sites to earn advertising fees by advertising and linking to Amazon.com. Amazon, the Amazon logo, AmazonSupply, and the AmazonSupply logo are trademarks of Amazon.com, Inc. or its affiliates. As an Amazon Associate we earn affiliate commissions from qualifying purchases.