
In an age driven by data, understanding and interpreting numerical information is paramount. Percentages serve as one of the most powerful and intuitive tools for this purpose, transforming raw numbers into relatable insights. From monitoring software progress bars to analyzing market share, presenting data visually in dashboards, or evaluating performance metrics, percentages are ubiquitous in the technological landscape. Far beyond a simple mathematical concept, the ability to efficiently convert numbers into percentages using various technological tools is a fundamental skill for developers, data analysts, project managers, and even casual users navigating digital interfaces.

This guide delves into the practical, technology-driven methods for converting numbers into percentages. We’ll explore how popular software applications and programming languages handle this seemingly simple operation, ensuring accuracy, clarity, and efficiency in your data presentation and analysis. Whether you’re crunching numbers in a spreadsheet, scripting a data transformation, or designing a user interface, mastering these tech approaches will elevate your numerical communication.
Understanding the Fundamentals: The Logic Behind Percentage Conversion
Before diving into the tools, a brief refresher on the core mathematical principle ensures we’re all on the same page. A percentage represents a fraction of a whole, expressed as a number out of 100. The term “percent” literally means “per hundred.”
The Basic Formula: From Decimal to Percentage
The fundamental conversion process involves two key steps:
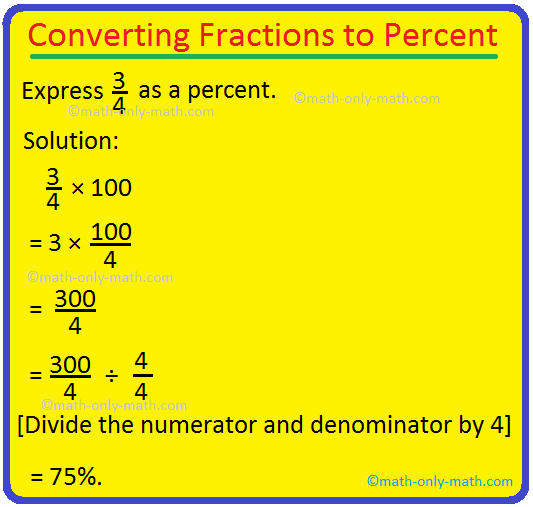
- Divide the “part” by the “whole” (or total): This yields a decimal value. For instance, if you have 25 apples out of a total of 100 apples, the fraction is 25/100, which equals 0.25. If you already have a decimal (e.g., 0.75), this step is already done.
- Multiply the decimal by 100: This converts the decimal into its percentage equivalent. So, 0.25 * 100 = 25%.
This simple mathematical operation forms the bedrock of every technological implementation. While the concept is straightforward, the methods employed by software and programming languages to automate and present these conversions are where the “tech” aspect truly shines.
Why Percentages Matter in Tech Contexts
In the realm of technology, percentages are not just academic exercises; they are vital for:
- User Interface (UI) Design: Progress bars (download status, task completion), battery indicators, loading screens all use percentages to convey progress intuitively.
- Data Analysis and Reporting: Expressing growth rates, market share, error rates, survey results, or resource utilization (e.g., CPU, memory) in a standardized, easily comparable format.
- Software Development: Implementing logic for financial calculations, game scoring, statistical analysis, and performance benchmarking.
- Machine Learning and AI: Reporting model accuracy, precision, recall, or confidence scores.
- Digital Marketing and Analytics: Conversion rates, bounce rates, open rates, click-through rates are all percentage-based metrics.
Understanding these applications underscores the importance of not just knowing how to convert, but how to do it effectively using the right tools.
Leveraging Spreadsheet Software for Percentage Conversion
Spreadsheet programs like Microsoft Excel and Google Sheets are arguably the most common and accessible tools for numerical data manipulation, and percentage conversion is one of their core functionalities. Their intuitive interfaces combine powerful calculation engines with flexible formatting options, making them indispensable for many professionals.
Microsoft Excel and Google Sheets: Step-by-Step
Converting a number to a percentage in a spreadsheet can be done in a few straightforward ways:
-
Direct Formatting (for pre-existing decimals):
- Scenario: You have a decimal value in a cell (e.g.,
0.75in cell A1) and want to display it as a percentage. - Steps:
- Select the cell(s) containing the decimal number.
- Navigate to the “Home” tab on the ribbon (Excel) or “Format” menu (Google Sheets).
- In the “Number” group (Excel) or “Number” sub-menu (Google Sheets), click the “Percentage Style” button (usually represented by a
%symbol). - The number
0.75will instantly display as75%. You can then adjust the number of decimal places as needed using the “Increase Decimal” or “Decrease Decimal” buttons.
- Scenario: You have a decimal value in a cell (e.g.,
-
Using Formulas (for part-out-of-total scenarios):
- Scenario: You have a “part” value in one cell (e.g.,
75in B2) and a “total” value in another (e.g.,100in C2), and you want to calculate and display the percentage. - Steps:
- In an empty cell (e.g., D2), type the formula:
=B2/C2. This will calculate the decimal value (e.g.,0.75). - With cell D2 still selected, apply the “Percentage Style” formatting as described in step 1.
- The cell D2 will now display
75%.
- In an empty cell (e.g., D2), type the formula:
- Scenario: You have a “part” value in one cell (e.g.,
Handling Multiple Data Points with Formulas
When working with large datasets, spreadsheets excel at applying these calculations across many rows or columns efficiently:
- Relative References: If you have multiple rows of “part” and “total” values, you can enter the formula
=B2/C2in D2, then drag the fill handle (the small square at the bottom-right corner of the selected cell) down to apply the formula to subsequent rows. Excel/Sheets will automatically adjust the cell references (e.g., D3 will become=B3/C3). - Absolute References: Sometimes, your “total” might be a fixed value in a single cell (e.g., the overall budget in C1). In such cases, you’d use an absolute reference for the total by adding dollar signs:
=B2/$C$1. This ensures that when you drag the formula, the reference to C1 remains fixed.
Formatting Cells for Clarity and Impact
Beyond basic percentage conversion, spreadsheets offer advanced formatting to enhance data readability:
- Decimal Places: Control precision to avoid misleading numbers (e.g.,
25.34%vs.25%). - Conditional Formatting: Highlight percentages that meet certain criteria (e.g., sales above 80% in green, below 50% in red). This is crucial for quick visual identification of performance trends or anomalies, a staple in dashboards and reports.
- Custom Number Formats: For very specific display needs, you can define custom formats (e.g., showing a percentage sign even for zero, or adding custom text).
Programming Languages: Automating Percentage Calculations
For developers, data scientists, or anyone dealing with automated data processing, web applications, or complex analytics, programming languages offer the ultimate control and flexibility for percentage conversions. Languages like Python and JavaScript are particularly popular for their versatility.
Python: Simple Scripts for Data Transformation
Python is a go-to language for data manipulation due to its clear syntax and powerful libraries.
Here’s a basic function to convert a number to a percentage:
def convert_to_percentage(value, total=1):
    """
    Converts a numerical value (or part of a total) into a formatted percentage string.
    Args:
        value (float or int): The number to convert.
        total (float or int): The total from which the value represents a part. Defaults to 1 if value is already a decimal.
    Returns:
        str: The value formatted as a percentage string (e.g., "25.00%").
    """
    if total == 0:
        return "Error: Total cannot be zero."

    percentage = (value / total) * 100
    return f"{percentage:.2f}%" # Formats to two decimal places

# Example Usage:
# 1. Converting a decimal
decimal_value = 0.75
print(f"Decimal {decimal_value} as percentage: {convert_to_percentage(decimal_value)}")
# Output: Decimal 0.75 as percentage: 75.00%


<p style="text-align:center;"><img class="center-image" src="https://www.vedantu.com/seo/content-images/cd021cdf-0d5e-4714-86db-7762b5b2d08f.png" alt=""></p>


# 2. Converting a part of a total
part = 120
total = 500
print(f"{part} out of {total} as percentage: {convert_to_percentage(part, total)}")
# Output: 120 out of 500 as percentage: 24.00%

# Handling a specific precision requirement
data_point = 0.333333
print(f"More precise decimal: {convert_to_percentage(data_point)}")
# Output: More precise decimal: 33.33%
Python’s f-strings (f"{variable:.2f}%") provide an elegant way to format the output with desired decimal precision. For more complex data handling, libraries like pandas allow you to apply such functions across entire columns of dataframes, similar to how spreadsheets handle ranges.
JavaScript: Dynamic Web Applications and User Interfaces
JavaScript is essential for front-end web development, enabling dynamic calculations and updates in web browsers. It’s perfect for creating interactive forms, dashboards, and real-time progress indicators.
function convertToPercentage(value, total = 1) {
    /**
     * Converts a numerical value (or part of a total) into a formatted percentage string.
     * @param {number} value The number to convert.
     * @param {number} total The total from which the value represents a part. Defaults to 1 if value is already a decimal.
     * @returns {string} The value formatted as a percentage string (e.g., "25.00%").
     */
    if (total === 0) {
        return "Error: Total cannot be zero.";
    }

    const percentage = (value / total) * 100;
    return `${percentage.toFixed(2)}%`; // Formats to two decimal places
}

// Example Usage:
// 1. Converting a decimal
let decimalValueJS = 0.887;
console.log(`Decimal ${decimalValueJS} as percentage: ${convertToPercentage(decimalValueJS)}`);
// Output: Decimal 0.887 as percentage: 88.70%

// 2. Converting a part of a total (e.g., for a progress bar)
let completedTasks = 7;
let totalTasks = 10;
let progressPercentage = convertToPercentage(completedTasks, totalTasks);
console.log(`Progress: ${progressPercentage}`);
// Output: Progress: 70.00%

// Integrating with HTML for dynamic updates:
// Imagine an input field for 'part' and 'total', and a span to display the result.
/*
<input type="number" value="50">
<input type="number" value="200">
<button onclick="updatePercentage()">Calculate</button>
<span></span>

<script>
    function updatePercentage() {
        const part = parseFloat(document.getElementById('partInput').value);
        const total = parseFloat(document.getElementById('totalInput').value);
        const result = convertToPercentage(part, total);
        document.getElementById('resultDisplay').textContent = result;
    }
</script>
*/
The toFixed(2) method in JavaScript is crucial for controlling decimal precision in the output string, similar to Python’s formatting.
Other Languages: R, SQL for Database Analytics
- R: For statistical computing and graphical analysis, R offers robust ways to calculate and present percentages, often within dataframes. It’s common in academic and research settings.
R

# Example in R

part_r <- 75

total_r <- 300

percentage_r <- (part_r / total_r) * 100

print(sprintf("%.2f%%", percentage_r)) # Output: "25.00%"
- SQL: When working with databases, percentages are frequently calculated within queries to generate reports.
sql

-- Example in SQL (e.g., calculating completion rate)

SELECT

    (CAST(completed_tasks AS DECIMAL) / total_tasks) * 100 AS completion_percentage

FROM

    project_progress

WHERE

    project_id = 123;
TheCAST(... AS DECIMAL)is important to ensure floating-point division rather than integer division, which would truncate decimal results.
Specialized Tools and Online Calculators
Beyond general-purpose software and programming, dedicated tools and services exist to simplify percentage conversions, especially for quick lookups or integration into larger systems.
Dedicated Percentage Calculators
Numerous websites and mobile apps are designed specifically for percentage calculations. These tools provide a user-friendly interface to input numbers and instantly receive the percentage, percentage change, or other related values. While they might lack the batch processing power of spreadsheets or the automation of programming, they are excellent for ad-hoc calculations. Examples include PercentageCalculator.net, Omni Calculator, or built-in calculators on operating systems.
Data Visualization Tools and Their Built-in Functions
Modern data visualization platforms like Tableau, Power BI, and Google Data Studio often have built-in functionalities to convert and display numbers as percentages with minimal effort. When you connect your data, these tools typically allow you to:
- Set Data Type: Define a measure as a percentage directly.
- Quick Table Calculations: Apply percentage-of-total calculations with a few clicks.
- Automatic Formatting: Handle the
*100and%symbol automatically based on the chosen format.
These tools are invaluable for creating interactive dashboards where percentages communicate key performance indicators (KPIs) and trends at a glance.
APIs for Real-time Conversion
For applications requiring real-time percentage calculations, especially with external data sources, Application Programming Interfaces (APIs) can be integrated. For instance, a financial API might return stock price changes as percentages directly, or a statistical API could perform complex ratio calculations and deliver the result in percentage format. Developers can leverage these APIs to avoid implementing the calculation logic themselves, ensuring consistency and accuracy with external data providers.
Common Pitfalls and Best Practices in Tech Implementation
While converting numbers to percentages seems simple, several common pitfalls can lead to inaccuracies or misinterpretations. Adhering to best practices, especially within a technological context, is crucial.
Ensuring Data Accuracy and Precision
- Floating-Point Errors: Computers represent floating-point numbers (decimals) with finite precision, which can sometimes lead to tiny inaccuracies (e.g., 0.1 + 0.2 not exactly equaling 0.3). While usually negligible, for financial or scientific calculations, be aware of this and use appropriate rounding.
- Rounding: Decide on the appropriate number of decimal places for your percentage. Too many can clutter, too few can lose important detail. Most business contexts round to two decimal places (e.g.,
25.34%). Use functions likeround()in Python,toFixed()in JavaScript, or formatting options in spreadsheets. - Source Data Integrity: Ensure your raw numbers (the “part” and “total”) are correct before any conversion. Garbage in, garbage out applies rigorously here.
Handling Edge Cases (Zero, Negative Numbers)
- Division by Zero: This is a critical error. If your “total” is zero, the division is undefined. Your code or spreadsheet formulas should handle this gracefully (e.g., return “N/A”, “Undefined”, or display an error message) rather than crashing or showing a
#DIV/0!error.- In Python/JavaScript: Use an
if total == 0:check. - In Excel/Sheets: Use
IFERRORorIF(C2=0, "N/A", B2/C2).
- In Python/JavaScript: Use an
- Negative Numbers: A negative percentage is valid (e.g., a decrease). Ensure your calculation correctly reflects the sign.
(-10 / 100) * 100should yield-10%.
Presentation and Interpretation of Percentage Data
- Context is King: A
5%increase means very different things for a small startup versus a global tech giant. Always provide context when presenting percentages. - Visual Cues: When using data visualization, choose appropriate chart types (e.g., pie charts for parts of a whole, bar charts for comparisons, line charts for trends). Ensure labels are clear and non-ambiguous.
- Avoid Misleading Visuals: Be mindful of chart scales and axes. Manipulating these can drastically alter the perceived impact of a percentage, potentially misleading your audience. Tools should be used ethically.
The ability to efficiently convert numbers into percentages across various technological platforms is more than just a convenience; it’s a critical skill in today’s data-driven world. By understanding the underlying mathematical principle and leveraging the specific functionalities of spreadsheets, programming languages, and specialized tools, you can transform raw data into clear, actionable insights. Adhering to best practices for accuracy, error handling, and thoughtful presentation ensures that your percentage-based communications are both precise and impactful, driving better understanding and decision-making within any technological context.
aViewFromTheCave is a participant in the Amazon Services LLC Associates Program, an affiliate advertising program designed to provide a means for sites to earn advertising fees by advertising and linking to Amazon.com. Amazon, the Amazon logo, AmazonSupply, and the AmazonSupply logo are trademarks of Amazon.com, Inc. or its affiliates. As an Amazon Associate we earn affiliate commissions from qualifying purchases.