
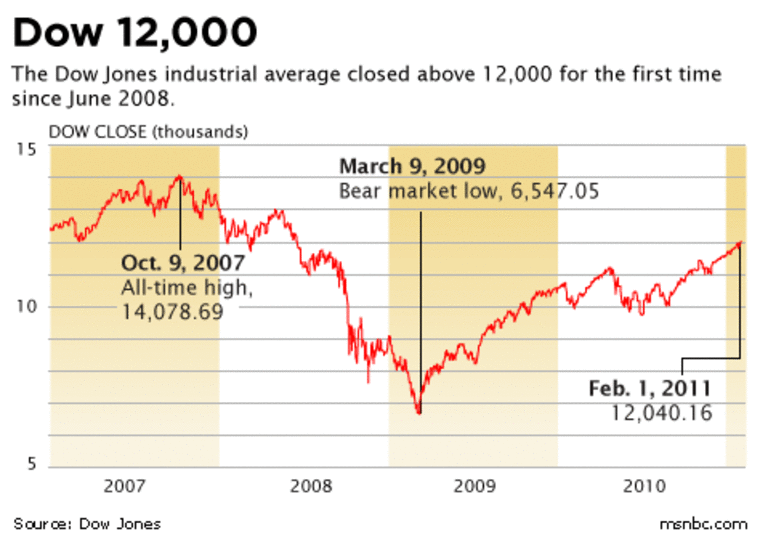
The daily closing bell of the New York Stock Exchange (NYSE) and the Nasdaq is more than just a signal that the trading day has ended. For millions of investors, financial analysts, and institutional traders, the closing price of a stock or an index represents the final consensus on the value of the market for that specific period. When people ask, “How did the stock market close?” they are seeking more than just a green or red number on a screen; they are looking for a pulse check on the global economy, investor sentiment, and the potential direction of future trends.
Understanding the nuances of the market close is essential for anyone serious about personal finance and investing. Whether you are a long-term retirement saver or a sophisticated retail trader, the closing price determines everything from the net asset value (NAV) of mutual funds to the execution of complex algorithmic trades.
The Mechanics of the Market Close
The closing of the stock market is not a single, instantaneous event across all platforms. Instead, it is a highly structured process designed to ensure liquidity and price discovery.
The Closing Auction and Price Discovery
In the final minutes of the trading day, specifically on the NYSE and Nasdaq, a process known as the “closing auction” occurs. This is perhaps the most critical period for price discovery. During this time, buy and sell orders are matched to determine a single price at which the maximum number of shares can be traded. This “closing cross” helps to minimize volatility that might otherwise be caused by a flurry of last-minute orders.
For institutional investors, the closing auction is vital because it allows them to execute large “Market on Close” (MOC) orders. These orders are intended to be executed as close to the official closing price as possible, providing a benchmark that minimizes “slippage”—the difference between the expected price of a trade and the price at which the trade is actually executed.
After-Hours Trading vs. The Official Close
While the official market close happens at 4:00 PM EST, trading does not actually stop. The “after-hours” market allows investors to continue buying and selling securities until 8:00 PM EST. However, it is important to distinguish between the official closing price and after-hours fluctuations.
The official closing price is what is recorded in historical databases and used for financial reporting. After-hours trading typically suffers from lower liquidity and higher spreads, meaning prices can swing wildly based on news that breaks after the bell—such as earnings reports or geopolitical developments. For the average investor, the official close remains the most reliable metric for assessing a portfolio’s daily performance.
Decoding the Factors That Drive Closing Prices
When the market closes significantly higher or lower, it is rarely the result of a single trade. Instead, a complex web of macroeconomic data, corporate performance, and psychological factors converges to push the indices in one direction or another.
Economic Indicators and Fed Policy
The most significant driver of market movement in the modern era is the Federal Reserve’s monetary policy. Investors closely monitor “Fed Speak”—the public comments made by central bank officials—and official interest rate decisions. If the market closes lower following a Fed meeting, it often indicates that investors are concerned about rising interest rates, which can increase borrowing costs and slow corporate growth.
Conversely, a strong close often follows positive economic data, such as a favorable Consumer Price Index (CPI) report showing cooling inflation, or a “Goldilocks” jobs report—one that shows steady employment without overshooting into a territory that would trigger aggressive rate hikes.
Corporate Earnings Reports
Earnings season is a period of intense activity that frequently dictates how the market closes. Large-cap companies, particularly the “Magnificent Seven” (including giants like Apple, Microsoft, and Nvidia), have such massive market capitalizations that their individual performance can lift or drag down the entire S&P 500 or Nasdaq.
When a bellwether company reports earnings that beat analyst expectations and provides strong future guidance, the market often closes on a high note. However, even if a company reports strong profits, a cautious outlook for the next quarter can lead to a late-day sell-off, highlighting the market’s forward-looking nature.
Geopolitical Events and Sentiment
The stock market does not operate in a vacuum. International conflicts, trade negotiations, and political elections all play a role in how the trading day concludes. Geopolitical uncertainty often leads to a “flight to safety,” where investors sell equities and move into defensive assets like gold or U.S. Treasuries, leading to a weak market close. The closing price serves as a barometer for how the global community is reacting to these external pressures in real-time.

Interpreting Market Performance: Red, Green, and Everything in Between
When evaluating how the market closed, it is important to look beyond the surface level of the primary indices. A “green” close for the Dow Jones Industrial Average does not necessarily mean every sector is healthy.
Volatility and the VIX
The CBOE Volatility Index, often referred to as the “Fear Gauge” or the VIX, is a crucial tool for interpreting a market close. If the market closes down and the VIX is spiking, it suggests a high level of panic and uncertainty among traders. If the market closes down but the VIX remains stable, it may simply be a routine “pullback” or profit-taking session. Understanding the relationship between price action and volatility helps investors avoid making emotional decisions based on short-term noise.
Sector Rotations and Market Breadth
Market breadth refers to how many stocks are participating in a market move. A healthy “up” close is one where a majority of stocks across various sectors—healthcare, energy, technology, and consumer staples—are rising. If the market closes higher but only a handful of tech stocks are driving the gains while the rest of the market is flat or down, this is considered “narrow breadth.” Narrow breadth can be a warning sign that the market’s upward momentum is unsustainable and top-heavy.
Experienced investors look at sector rotation to see where the “smart money” is moving. If the market closes with defensive sectors like Utilities and Staples in the lead, it suggests a cautious outlook. If high-growth Technology and Discretionary sectors lead the close, it indicates a “risk-on” sentiment.
Strategies for Investors: Navigating the End-of-Day Fluctuations
The way the market closes can provoke strong emotional reactions, but successful long-term investing requires a disciplined approach to these daily fluctuations.
Avoiding the Noise of Daily Closings
For the individual investor focused on long-term wealth accumulation, the daily close is often more noise than signal. While it is important to stay informed, reacting to every “red” close can lead to overtrading and increased tax liabilities. The most successful investors view the market close through the lens of their long-term financial goals rather than a daily win-loss record.
The “closing price” is most relevant when it triggers a pre-planned strategy. For instance, some investors use “limit orders” that are only executed if a stock hits a certain price by the end of the day. Others use the close to trigger a rebalancing of their portfolio if an asset class has grown to represent too large a percentage of their total holdings.
Dollar-Cost Averaging as a Buffer
One of the most effective ways to mitigate the stress of how the market closes is through dollar-cost averaging (DCA). By investing a fixed amount of money at regular intervals—regardless of whether the market closed at an all-time high or in a correction—investors remove the need to “time” the market close. Over time, this strategy lowers the average cost per share and reduces the impact of daily volatility on the total portfolio.
The Role of Technology and Algorithms in Modern Market Closings
In the modern financial landscape, the final minutes of the trading day are increasingly dominated by high-frequency trading (HFT) and algorithmic models. These programs can execute thousands of trades in milliseconds based on specific technical triggers.
The Rise of “Passive” Closes
A significant portion of the volume at the market close is driven by the rise of passive investing. Index funds and ETFs must track their underlying benchmarks as closely as possible. Since these benchmarks are calculated based on closing prices, these massive funds often execute their trades in the final moments of the day to minimize tracking error. This creates a self-fulfilling prophecy where the market close becomes the most liquid and high-volume part of the day simply because that is when the largest funds are required to trade.

Algorithmic Rebalancing and “Flash” Movements
Because algorithms are programmed to respond to certain price levels, a market close can sometimes see “flash” movements—rapid spikes or drops in the final seconds. This is often the result of “stop-loss” orders being triggered or algorithms reacting to a specific technical “breakout” level. For the retail investor, these movements emphasize the importance of using “limit orders” rather than “market orders” when trading near the close, ensuring that a sudden, temporary price swing doesn’t result in a poor execution price.
The question of “how the market closed” is a gateway to understanding the broader financial ecosystem. It is a reflection of current events, a catalyst for future movements, and a vital data point for managing personal wealth. By looking past the immediate numbers and understanding the mechanics, drivers, and strategies behind the closing bell, investors can move from being passive observers to informed participants in their own financial futures.
aViewFromTheCave is a participant in the Amazon Services LLC Associates Program, an affiliate advertising program designed to provide a means for sites to earn advertising fees by advertising and linking to Amazon.com. Amazon, the Amazon logo, AmazonSupply, and the AmazonSupply logo are trademarks of Amazon.com, Inc. or its affiliates. As an Amazon Associate we earn affiliate commissions from qualifying purchases.