Understanding the current state of the stock market requires more than a passing glance at a ticker tape or a brief notification on a smartphone. When investors ask, “How are stocks doing today?” they are often seeking a snapshot of the collective economic health, the sentiment of global traders, and the potential trajectory of their personal wealth. In the modern financial era, the answer to this question is a complex mosaic of macroeconomic data, corporate earnings, and geopolitical shifts.
To truly grasp how stocks are performing, one must look beyond the immediate green or red numbers and analyze the underlying drivers that dictate market movement. Whether the market is experiencing a bullish rally or a bearish correction, the nuances of today’s performance provide vital clues for tomorrow’s opportunities.
Decoding the Daily Pulse: Key Indices and Market Indicators
The most common way to measure how stocks are doing is by tracking the major indices. These serve as benchmarks, representing different segments of the economy and providing a standardized way to gauge overall performance.
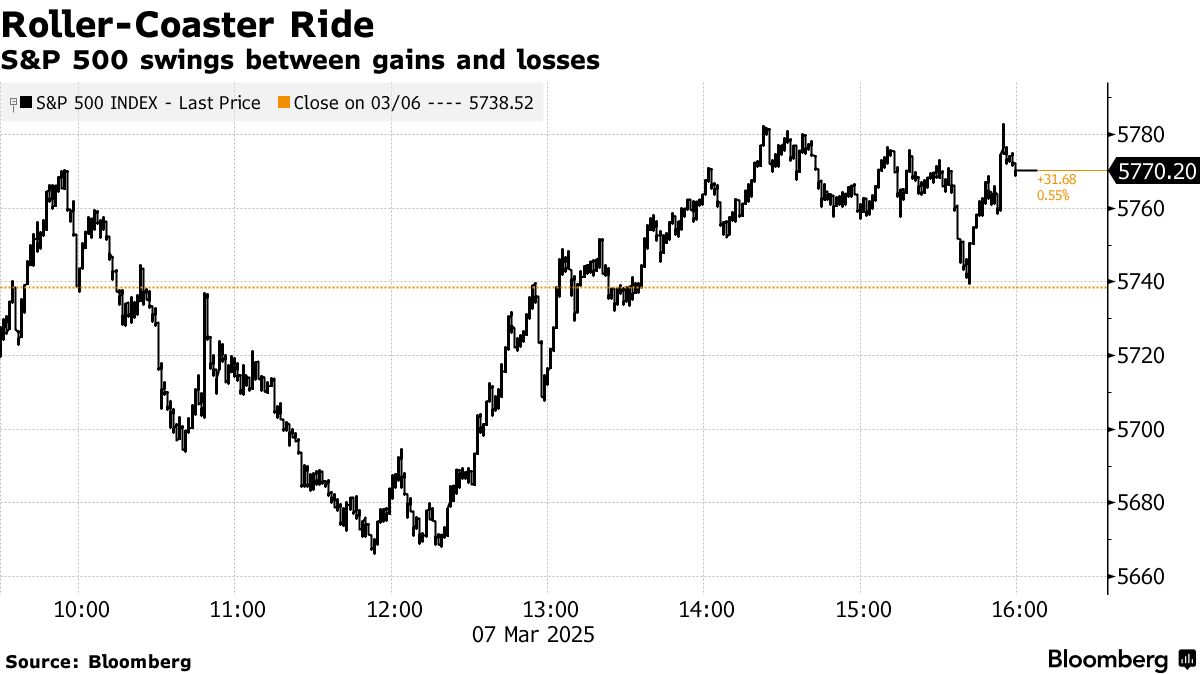
The S&P 500: The Broader Market Health Check
The Standard & Poor’s 500 is widely considered the most accurate reflection of the U.S. stock market. Comprising 500 of the largest publicly traded companies, it covers approximately 80% of the available market capitalization. When the S&P 500 is “up,” it generally signifies that large-cap American business is thriving. Investors look to this index to understand general investor confidence. If the S&P 500 is stagnant or declining while other indices are rising, it often points to a lack of breadth—meaning only a few specific sectors are doing the heavy lifting for the entire economy.
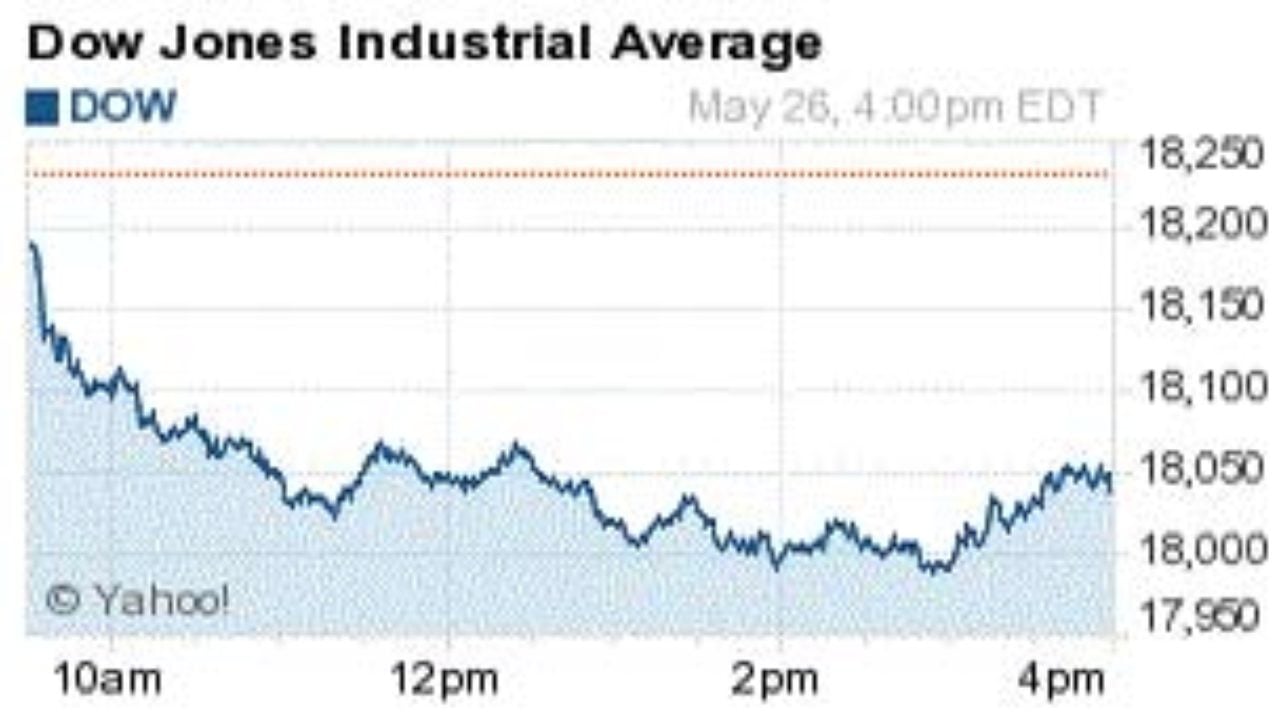
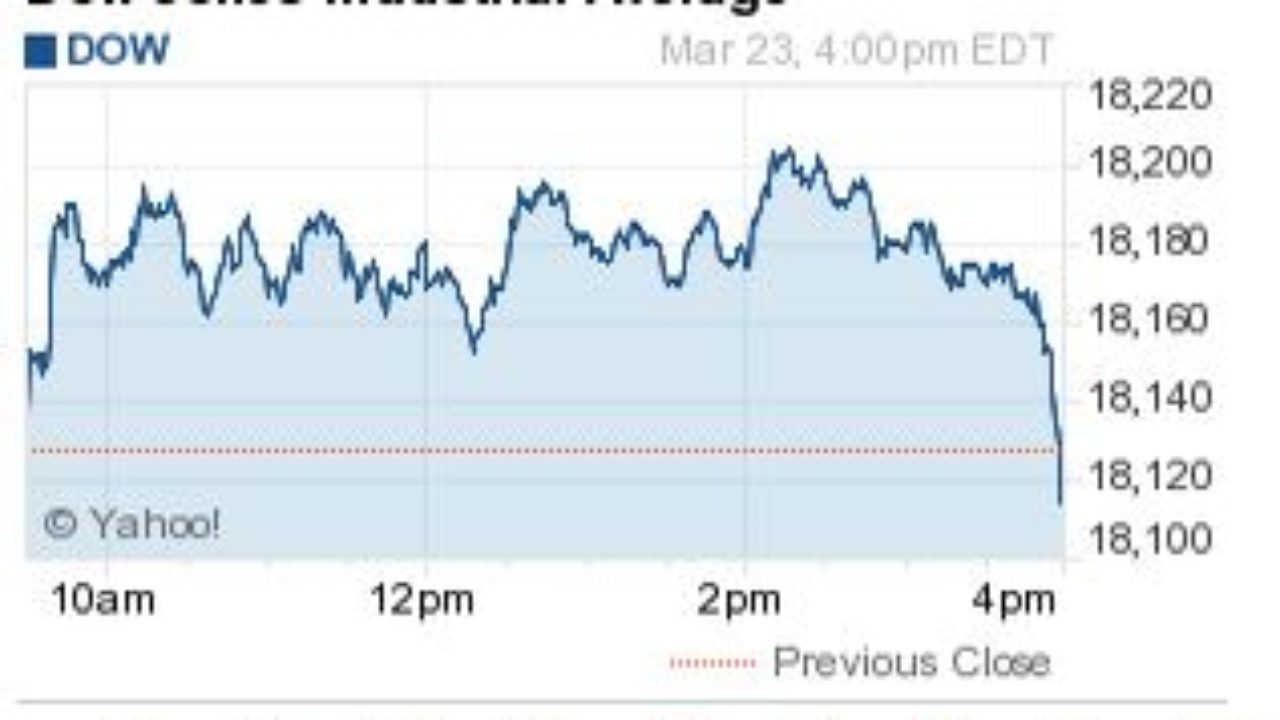
The Dow Jones and Nasdaq: Blue Chips vs. Tech Growth
While the S&P 500 offers breadth, the Dow Jones Industrial Average (DJIA) and the Nasdaq Composite offer specific lenses. The Dow tracks 30 prominent “blue-chip” companies, providing a glimpse into the stability of legacy industries like manufacturing, banking, and retail. Conversely, the Nasdaq is heavily weighted toward the technology and growth sectors. On days when “stocks are doing well” but the Nasdaq is lagging, it usually indicates a rotation out of high-growth tech and into more “defensive” or value-oriented positions. Understanding which index is leading the day helps investors identify where capital is flowing.
Understanding the VIX: The “Fear Gauge”
To understand how stocks are doing, one must also look at the CBOE Volatility Index, or the VIX. Often called the “fear gauge,” the VIX measures the market’s expectation of 30-day forward-looking volatility. A rising VIX often correlates with falling stock prices, as it indicates uncertainty and panic. Conversely, a low or falling VIX suggests a “risk-on” environment where investors feel comfortable putting money into the market. Checking the VIX alongside stock prices provides a more holistic view of whether today’s price movement is driven by conviction or mere speculation.
Drivers of Current Market Movement: Macro and Micro Factors
Stock prices do not move in a vacuum. The performance we see on any given day is the result of a tug-of-war between various economic forces. Understanding these drivers is essential for any investor looking to move beyond surface-level observations.
Interest Rates and the Federal Reserve’s Influence
In the current financial climate, perhaps no single entity influences “how stocks are doing” more than the Federal Reserve. Interest rates are the “gravity” of the financial world; when rates are high, they pull down stock valuations by increasing the cost of borrowing and making fixed-income assets (like bonds) more attractive. Investors today are hyper-focused on the Fed’s “dot plot” and inflation data. A hint of a rate cut can send stocks soaring, while a “hawkish” stance regarding persistent inflation can lead to a sharp sell-off.
Inflationary Pressures and Consumer Sentiment
Inflation remains a primary concern for market participants. The Consumer Price Index (CPI) and Producer Price Index (PPI) are major catalysts for market movement. When inflation data comes in higher than expected, stocks often react negatively because it suggests that the Fed may keep rates higher for longer. Furthermore, inflation impacts corporate margins; if a company cannot pass on rising costs to consumers, its earnings will suffer. Monitoring consumer sentiment is equally important, as consumer spending accounts for nearly 70% of the U.S. economy.
Corporate Earnings: The Bedrock of Valuation
While macroeconomics sets the stage, corporate earnings are the actual performance. During “earnings season,” the question of how stocks are doing is answered company by company. Investors look for “beats” or “misses” relative to analyst expectations. However, the most critical element is often “guidance”—what the company expects to happen in the future. A company could report record profits for the past quarter, but if its management warns of a slowdown in the next six months, the stock price will likely tumble. This reinforces the idea that the stock market is a forward-looking mechanism.
Sector Performance: Where the Capital is Flowing
Not all stocks move in the same direction at the same time. A “flat” day for the overall market can hide significant volatility within specific sectors. Diversification is the key to weathering these shifts.
The Dominance of Large-Cap Tech and AI
In recent years, the story of how stocks are doing has been dominated by the “Magnificent Seven” and the explosion of Artificial Intelligence (AI). Companies involved in semiconductor manufacturing, cloud computing, and AI software have seen unprecedented growth. When these tech giants perform well, they can pull the entire S&P 500 upward, even if the majority of other stocks are struggling. This concentration of wealth in a single sector creates both opportunity and risk, as it makes the broader market more sensitive to tech-specific news.
Defensive Sectors vs. Cyclical Stocks
When the economic outlook is uncertain, investors often move their money into “defensive” sectors such as Utilities, Healthcare, and Consumer Staples. These companies provide essential services that people need regardless of the economy’s state. On the other hand, “cyclical” stocks—such as Travel, Luxury Goods, and Industrials—thrive when the economy is expanding and consumers have high discretionary income. Observing which sectors are outperforming today can tell you a lot about the collective psychology of the market: are investors playing offense or defense?
Emerging Markets and International Diversification
While U.S. markets often take center stage, global stocks play a massive role in a balanced portfolio. Factors such as the strength of the U.S. dollar significantly impact international stocks. A strong dollar makes U.S. goods more expensive abroad and can hurt emerging markets that hold debt in dollars. By looking at international indices like the FTSE 100 or the Nikkei 225, investors can get a broader sense of global liquidity and economic health, which eventually trickles back into the domestic market.
Strategic Analysis: How to React to Daily Fluctuations
For the individual investor, knowing how stocks are doing today is only useful if it informs a better long-term strategy. Reacting emotionally to daily fluctuations is one of the quickest ways to erode wealth.
The Noise vs. The Signal: Avoiding Emotional Trading
The stock market is incredibly noisy. Headlines are designed to provoke a reaction, often using hyperbolic language about “crashes” or “rallies.” A disciplined investor learns to distinguish between “noise” (temporary price movements based on headlines) and “signals” (fundamental changes in economic or company health). If the market is down 1% today because of a single data point, it is likely noise. If it is down 10% over a month because of shifting interest rate cycles, that is a signal that may require a portfolio adjustment.
Dollar-Cost Averaging in Volatile Times
One of the most effective ways to handle the uncertainty of “how stocks are doing” is Dollar-Cost Averaging (DCA). By investing a fixed amount of money at regular intervals, regardless of the stock price, you naturally buy more shares when prices are low and fewer when prices are high. This strategy removes the temptation to “time the market,” which even professional fund managers struggle to do successfully. In a volatile market, DCA turns today’s “bad” performance into a buying opportunity for tomorrow’s gains.
Portfolio Rebalancing and Risk Management
Finally, the daily performance of stocks should serve as a reminder to check your asset allocation. If a specific sector (like tech) has had an incredible run, it might now represent a larger percentage of your portfolio than you originally intended. Rebalancing involves selling a portion of your winners to buy into underperforming sectors that still have strong fundamentals. This “sell high, buy low” approach is counter-intuitive to human emotion but is the cornerstone of professional wealth management.
In conclusion, “how stocks are doing today” is a question with many layers. It is a reflection of current interest rates, corporate health, and the collective hope or fear of millions of investors. By understanding the indices, the macroeconomic drivers, and the importance of sector rotation, you can move from being a passive observer to an informed participant in the global economy. Remember, the market is a marathon, not a sprint; today’s performance is merely one step in a much longer journey toward financial independence.
aViewFromTheCave is a participant in the Amazon Services LLC Associates Program, an affiliate advertising program designed to provide a means for sites to earn advertising fees by advertising and linking to Amazon.com. Amazon, the Amazon logo, AmazonSupply, and the AmazonSupply logo are trademarks of Amazon.com, Inc. or its affiliates. As an Amazon Associate we earn affiliate commissions from qualifying purchases.