
In the landscape of modern real estate investing, the short-term rental (STR) market has evolved from a niche side hustle into a sophisticated asset class. For the savvy investor, the difference between a high-yield property and a financial liability often hinges on the quality of data used during the underwriting process. Among the various tools available to analyze market trends, AirDNA has emerged as the industry standard. However, as capital requirements for vacation rentals increase and interest rates fluctuate, the burning question remains: How accurate is AirDNA, and can you trust its projections for your next major investment?
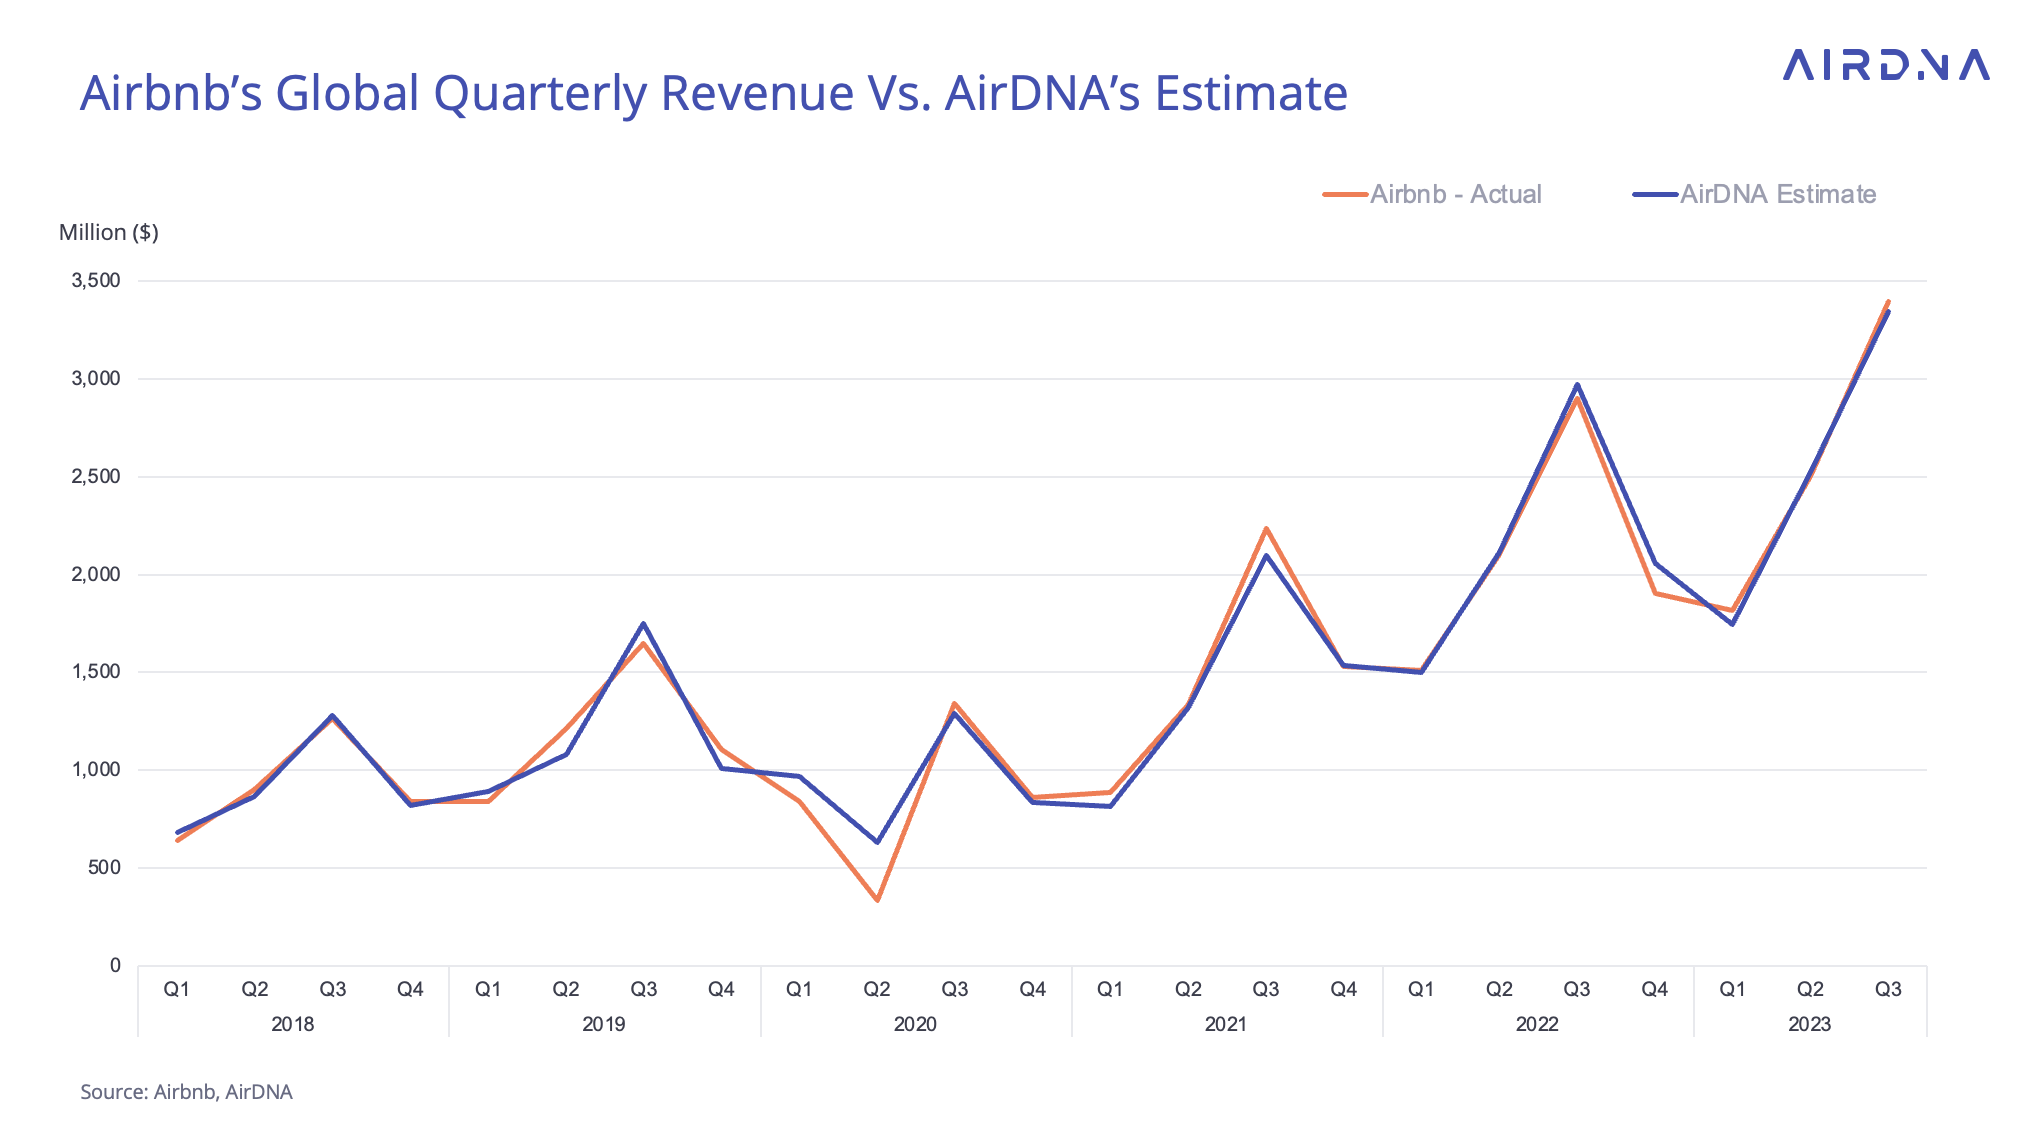
For anyone looking to deploy capital into platforms like Airbnb or Vrbo, understanding the delta between AirDNA’s estimates and actual financial performance is critical. This analysis explores the mechanics of AirDNA’s data, its inherent limitations, and how to use its insights to build a robust financial model for your short-term rental portfolio.
The Mechanics of AirDNA’s Financial Data
To evaluate accuracy, one must first understand the methodology. AirDNA does not have a direct data feed into the bank accounts of every Airbnb host. Instead, it utilizes a sophisticated combination of data scraping and proprietary algorithms to estimate performance.
Data Collection and Market Scraping
AirDNA tracks over 10 million properties globally by scraping the public-facing calendars and pricing of Airbnb and Vrbo listings daily. By monitoring which dates transition from “available” to “unavailable,” the software identifies potential bookings. However, the software must distinguish between a “blocked” day (where the owner is staying at the property or it is closed for maintenance) and a “booked” day (where a paying guest has reserved the stay).
The Role of Artificial Intelligence in Estimation
Since 2014, AirDNA has refined its “Market Score” and “Rentalizer” tools using machine learning. To improve accuracy, the company leverages “partner data”—actual financial performance shared by large-scale property management companies. This “ground truth” data allows AirDNA to calibrate its algorithms, helping the software recognize the difference between a high-value booking and a calendar block. For the investor, this means the data is not just a raw scrape but a statistically modeled projection of revenue, average daily rate (ADR), and occupancy.
Evaluating Revenue Estimation and Occupancy Projections
When a real estate investor performs due diligence, the two most critical metrics are projected revenue and occupancy rates. These figures dictate the potential Return on Investment (ROI) and the Debt Service Coverage Ratio (DSCR) for financing.
Accuracy at the Market Level vs. Property Level
There is a consensus among financial analysts that AirDNA is exceptionally accurate at the macro level. If you are looking at the average revenue for a three-bedroom home in Scottsdale, Arizona, AirDNA’s aggregate data is likely within a 5% to 10% margin of error. The high volume of data points in established markets allows the law of large numbers to smooth out individual anomalies.
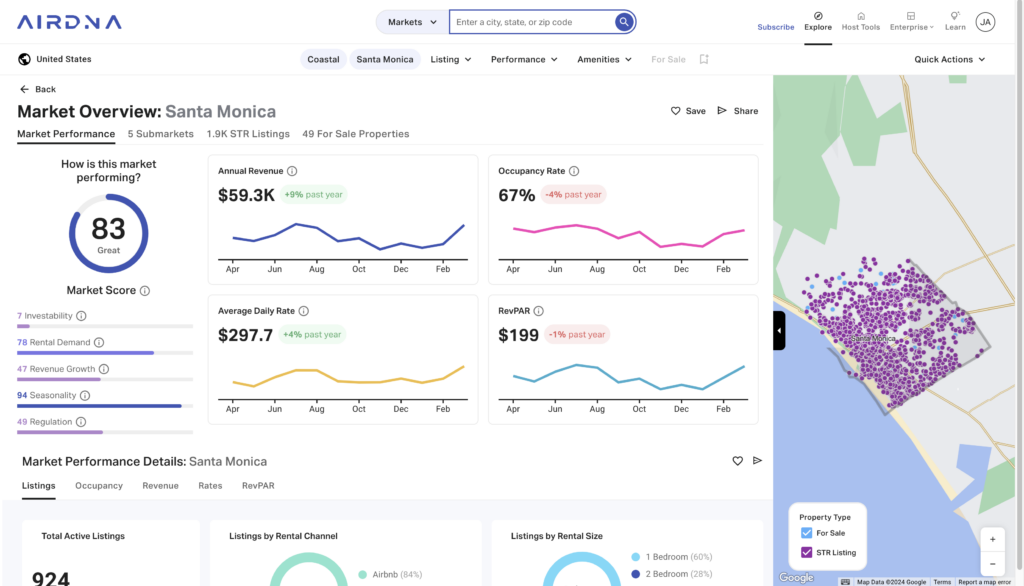
However, accuracy can fluctuate significantly at the individual property level. The “Rentalizer” tool, which provides a revenue estimate for a specific address, is an automated valuation model (AVM). Much like a Zillow Zestimate, it provides a baseline but cannot account for the “intangibles” that drive premium pricing. Factors such as interior design quality, a professional photography suite, or a unique “Instagrammable” amenity (like a custom mural or a high-end coffee bar) can cause a property to outperform AirDNA’s estimates by 20% or more.
The Challenge of “Blocked” Calendars
The most common critique regarding AirDNA’s accuracy involves its occupancy calculations. In markets with high owner usage—such as ski resorts or beach towns—owners often block out several weeks for personal use. If the algorithm misidentifies these blocks as paid bookings, it can artificially inflate the projected occupancy and revenue. Conversely, if a new listing has many blocked dates for setup, the software might underestimate its potential. Investors must look at “Adjusted Occupancy” metrics and compare them against historical local trends to ensure the financial model remains realistic.
Potential Pitfalls: Why the Numbers Might Not Match Your P&L
Financial success in real estate is found in the margins. Relying solely on a single data point without context can lead to “pro-forma blindness,” where an investor buys into a deal based on a software projection that fails to materialize in the Profit and Loss (P&L) statement.
The Impact of Regulation and Supply Shocks
AirDNA’s data is historical. It tells you what happened yesterday, last month, and last year. What it cannot predict with 100% certainty is the sudden entry of new supply or shifts in local zoning laws. If a municipality passes a strict short-term rental ordinance, the “Market Score” may remain high based on historical data, even as the future revenue potential collapses.
Furthermore, “supply saturation” is a financial risk that data tools can sometimes lag in reporting. In 2022 and 2023, many markets experienced an “Airbnbust” narrative where revenue per available room (RevPAR) dropped. This wasn’t necessarily because demand decreased, but because the supply of new listings grew faster than guest demand. Investors must look at the “Active Listings” growth rate on AirDNA to see if the market is becoming over-saturated.
Operating Expenses and Net Cash Flow
AirDNA provides gross revenue estimates, not net income. A common mistake for novice investors is to equate AirDNA’s revenue projection with their take-home pay. Accuracy in “Money” terms requires subtracting:
-
Property Management Fees: (typically 15-30% of gross revenue)
-
Cleaning Fees: While often a pass-through cost, they impact the overall price competitiveness.
-
Maintenance and Utilities: Often 2-3 times higher for STRs than for long-term rentals.
-
Platform Fees: Airbnb and Vrbo take their share before the money hits your account.
-
Taxes: Lodging and occupancy taxes vary wildly by jurisdiction.
Without accounting for these, even a perfectly accurate AirDNA revenue projection will lead to a flawed financial model.
Beyond the Dashboard: How to Stress-Test AirDNA Data
To truly determine how accurate AirDNA is for a specific investment, professional investors use a process called “triangulation.” This involves comparing software data against real-world indicators to stress-test the financial assumptions.
Manual Comping and The “Top 10” Method
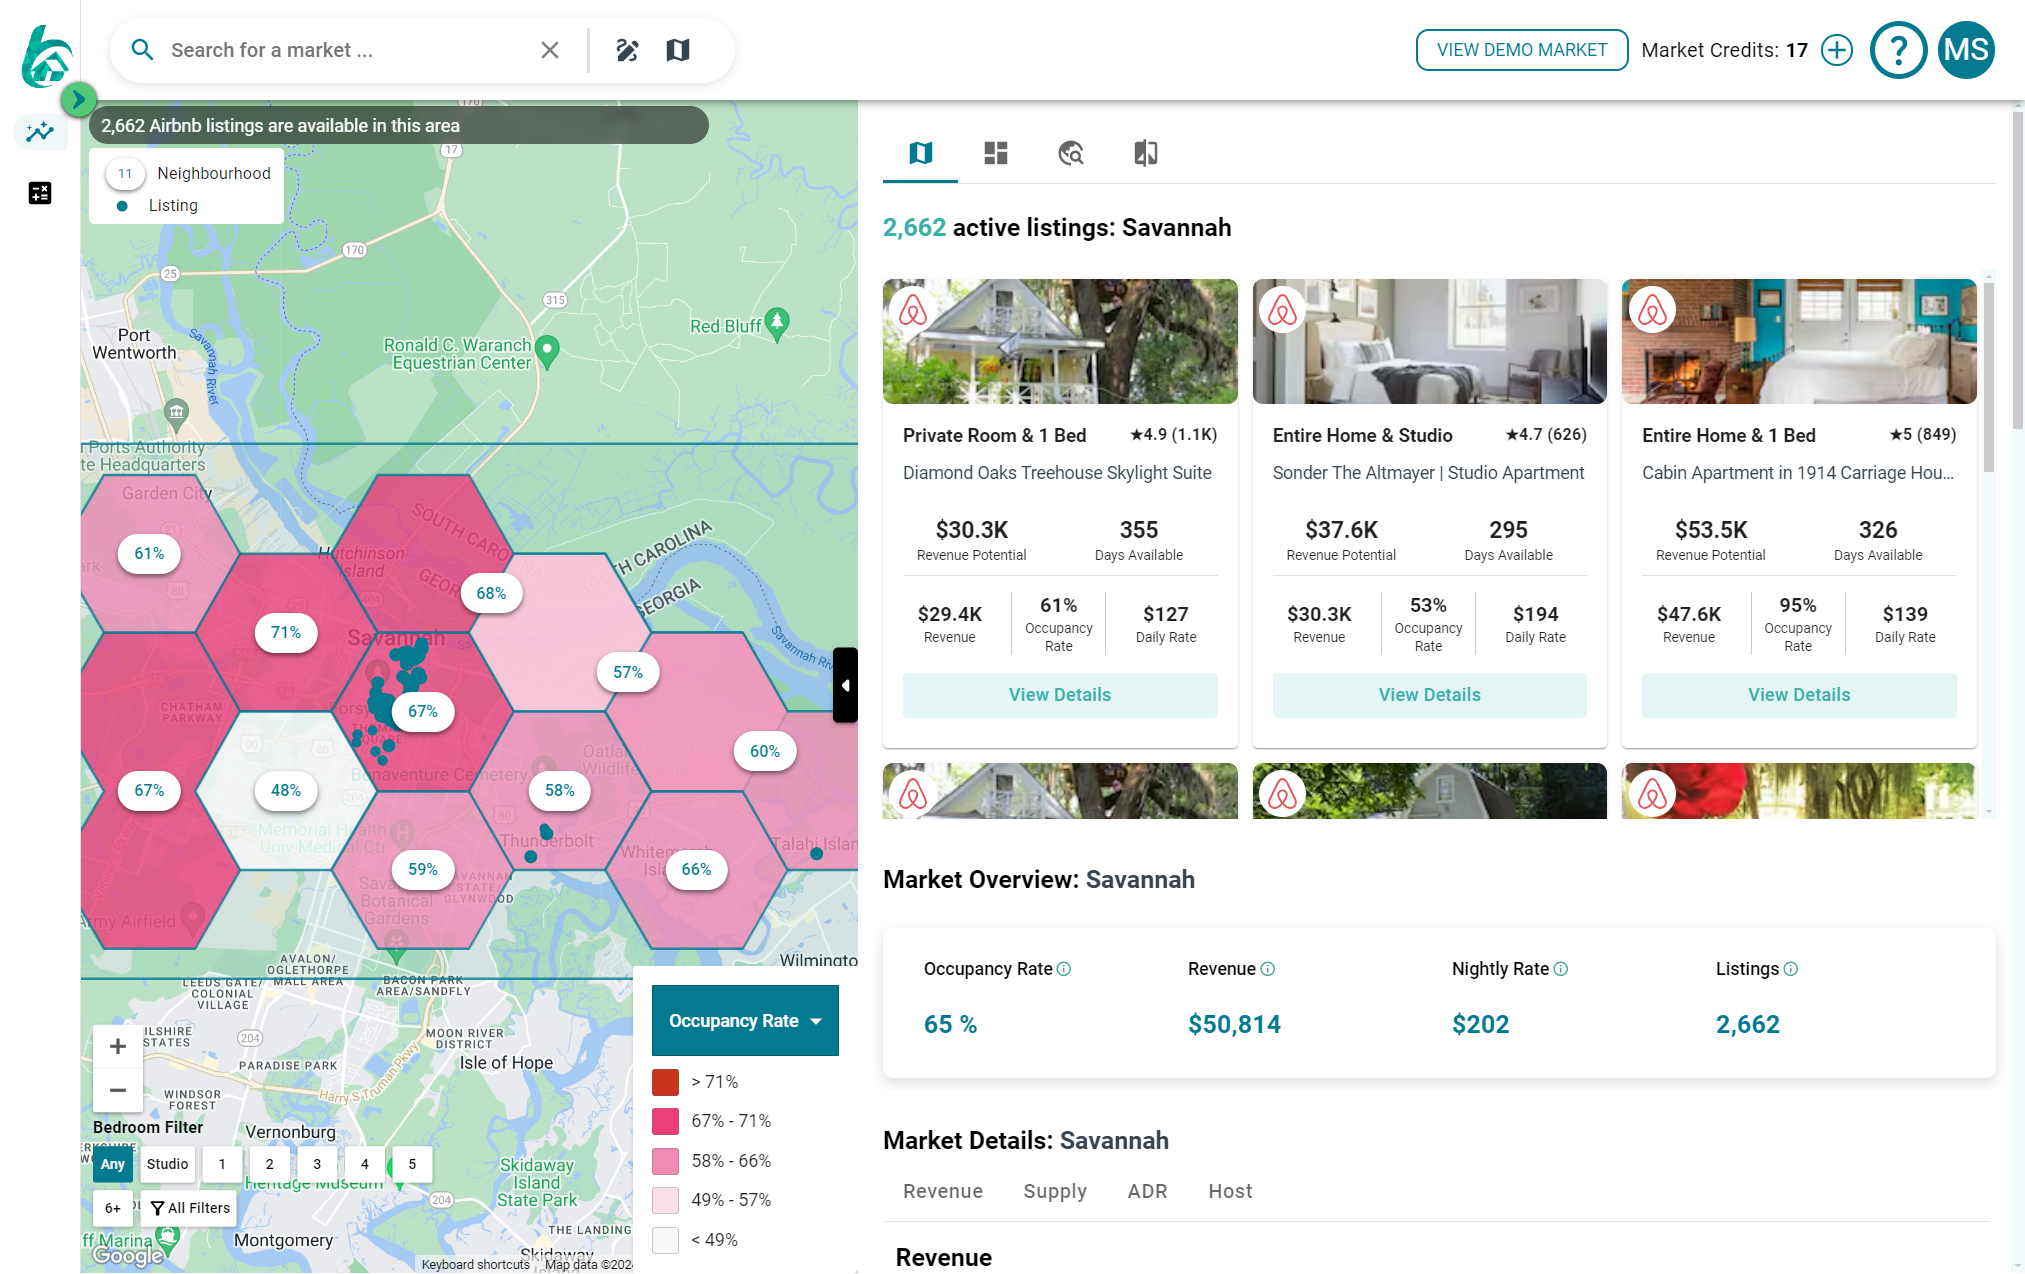
The most reliable way to verify AirDNA’s “Rentalizer” is to perform manual comping. An investor should find the top 10 performing properties in their immediate vicinity that are similar in size, style, and amenity set. By looking at these properties’ actual calendars on Airbnb and Vrbo, an investor can see their current pricing strategy and future availability. If AirDNA says a property will make $80,000, but the top-performing comps in the area are only grossing $65,000, the data is likely being skewed by an outlier.
Evaluating Amenity Premiums
AirDNA is a quantitative tool, but STR investing is increasingly qualitative. The software might not fully grasp the financial upside of a heated pool in a market where only 10% of homes have one. If your investment strategy involves adding high-value amenities, you should expect to exceed AirDNA’s “average” projections. Conversely, if your property is “dated” or lacks a view compared to the market average, AirDNA’s estimate may be overly optimistic.
Seasonal Sensitivity Analysis
A professional financial model should include a “sensitivity analysis”—a “what-if” scenario for different market conditions. What happens to your debt coverage if revenue is 20% lower than AirDNA predicts? What if occupancy drops by 10%? By using AirDNA’s “Best Case” and “Worst Case” percentiles (looking at the 50th, 75th, and 90th percentile of earners), you can build a more resilient investment thesis.
Strategic Decision-Making with AirDNA Insights
Ultimately, AirDNA is a powerful compass, but it is not a GPS. Its accuracy is high enough to be the foundation of a market research strategy, but it should never be the sole factor in a multi-thousand-dollar investment decision.
Using Data for Financing and Partnerships
When pitching a deal to private lenders or partners, AirDNA reports provide a level of professional legitimacy. Showing a “Market Research Report” from a recognized data provider demonstrates that you are not just guessing but are making data-driven decisions. However, the most successful investors present this data alongside a detailed budget that includes capital expenditures (CapEx) and operational reserves.
Identifying Emerging Markets
One of the most accurate uses of AirDNA is identifying “up-and-coming” markets. By tracking the “Year-over-Year Revenue Growth” and “Investability Score,” investors can find areas where home prices are still low relative to the potential rental income. This “Price-to-Rent” ratio is the holy grail of real estate investing, and AirDNA is arguably the best tool on the market for identifying these discrepancies at scale.
In conclusion, AirDNA is remarkably accurate for identifying trends, comparing markets, and establishing a baseline for revenue. It is an essential tool for the modern digital-first investor. However, the accuracy of your financial outcome depends less on the software itself and more on your ability to interpret that data, account for operational costs, and execute a superior guest experience. In the world of short-term rentals, data gets you into the game, but management wins the championship.
aViewFromTheCave is a participant in the Amazon Services LLC Associates Program, an affiliate advertising program designed to provide a means for sites to earn advertising fees by advertising and linking to Amazon.com. Amazon, the Amazon logo, AmazonSupply, and the AmazonSupply logo are trademarks of Amazon.com, Inc. or its affiliates. As an Amazon Associate we earn affiliate commissions from qualifying purchases.