
In an increasingly digitized world, where complex calculations are often delegated to sophisticated software and powerful computers, the humble calculator might seem an anachronism. Yet, among its ranks stands a device that transcends mere arithmetic: the graphing calculator. Far from a simple number-cruncher, this specialized technological tool represents a pivotal bridge between abstract mathematical concepts and tangible visual understanding. It’s a handheld powerhouse, designed not just to compute, but to illustrate, explore, and demystify the intricate world of functions, equations, and data.
At its core, a graphing calculator is an advanced scientific calculator equipped with a larger screen capable of displaying graphs of functions, parametric equations, and polar equations, as well as lists, matrices, and statistical plots. Its genesis marked a significant leap in computational technology, transforming how students and professionals approached complex mathematical and scientific problems. This article delves into the essence of what a graphing calculator is, exploring its evolution, key functionalities, profound impact, and its enduring relevance in the modern technological landscape.
The Evolution and Core Concept of Graphing Calculators
The journey of the graphing calculator is a testament to humanity’s continuous quest for more intuitive and powerful computational tools. It emerged as a necessity, bridging the gap between basic arithmetic devices and full-fledged computers, specifically tailored for the visualization of mathematical relationships.
Beyond Basic Arithmetic: A Leap in Computational Power
Prior to the advent of graphing calculators, students and professionals relied on scientific calculators for complex operations, logarithms, trigonometric functions, and statistical calculations. However, these devices were limited to numerical output. Visualizing a function, understanding its behavior over a range, or finding intersection points required tedious manual plotting on graph paper, a process prone to error and time-consuming. The graphing calculator introduced a paradigm shift by integrating a visual display directly into the computational process. This allowed users to see the mathematical relationships they were exploring, providing a deeper level of comprehension that numerical results alone could not offer. It moved beyond simply telling you what the answer was, to showing you why it was the answer, and how the variables interacted.
A Brief History: From Desktop to Handheld
The concept of graphical computation wasn’t new, but its miniaturization into a portable, affordable device was revolutionary. Early attempts at integrating graphical displays with calculators began in the late 1970s and early 1980s. Casio released the fx-7000G in 1985, widely recognized as the world’s first true graphing calculator. This groundbreaking device featured a small LCD screen capable of displaying functions and data plots. Texas Instruments soon followed suit, and the TI-81, released in 1990, cemented the graphing calculator’s place in classrooms across the globe, particularly in the United States. Hewlett-Packard also contributed significantly with their HP 48 series, known for its Reverse Polish Notation (RPN) input method and powerful capabilities, often favored by engineering professionals.
These early models, while primitive by today’s standards, laid the groundwork for the advanced devices we see now. Their evolution reflects the broader trends in microelectronics: increased processing power, larger and higher-resolution displays, expanded memory, and improved battery life, all packaged into increasingly user-friendly interfaces.
The Fundamental Purpose: Visualizing Mathematical Functions
The core utility of a graphing calculator lies in its ability to take an algebraic expression, an equation, or a set of data points, and transform it into a visual representation on its screen. For instance, inputting y = x^2 doesn’t just calculate points; it draws the iconic parabola, allowing immediate visual inspection of its vertex, symmetry, and behavior as x changes. This visual feedback is critical for:
- Understanding Function Behavior: Identifying intercepts, asymptotes, maxima, minima, and points of inflection.
- Solving Equations Graphically: Finding the intersection points of two functions to determine the solutions to an equation.
- Analyzing Data Trends: Plotting scatter plots, histograms, and box plots to glean insights from datasets.
- Exploring Transformations: Instantly seeing how changing parameters in an equation (e.g.,
y = a(x-h)^2 + k) affects its graph.
This immediate visual correlation between algebraic forms and their geometric counterparts is what makes the graphing calculator an indispensable learning tool and a powerful problem-solving instrument.
Key Features and Functionalities
Modern graphing calculators are sophisticated computing devices packed with an array of features that extend far beyond simple graphing. They are designed to be versatile tools for a wide range of mathematical and scientific disciplines.
Graphical Representation: The Heart of the Machine
The most defining feature, as its name suggests, is the ability to plot graphs. Graphing calculators can simultaneously display multiple functions, allowing for visual comparison and the determination of intersection points. They support various types of graphs, including:
- Cartesian (rectangular) functions:
y = f(x) - Parametric equations:
x = f(t), y = g(t) - Polar equations:
r = f(θ) - Sequences:
u(n) = f(n-1) - Scatter plots and statistical plots: Histograms, box plots, normal probability plots.
Users can adjust the viewing window (zoom in/out, pan), trace along a graph to see exact coordinates, and analyze key features directly from the visual output.
Advanced Mathematical Operations: From Algebra to Calculus
Beyond graphing, these calculators are robust scientific calculators on steroids. They perform all standard arithmetic and scientific functions, but also include:
- Algebraic Manipulation: Solving equations, systems of equations, polynomial roots, matrices operations (addition, subtraction, multiplication, determinants, inverses).
- Calculus Tools: Finding derivatives (numerical and symbolic on some models), definite integrals (numerical and symbolic), limits, and Taylor series expansions.
- Statistics and Probability: Calculating measures of central tendency (mean, median, mode), dispersion (variance, standard deviation), regressions (linear, quadratic, exponential), probability distributions, and hypothesis testing.
- Financial Functions: Time value of money (TVM), cash flow analysis, amortization schedules.
The depth of these functions makes them invaluable for high-level coursework and professional analysis.
Programming Capabilities: Customization and Automation
Many graphing calculators offer built-in programming languages (often a BASIC-like syntax) that allow users to write custom programs. This feature is incredibly powerful for:
- Automating Repetitive Tasks: Creating programs to solve specific types of problems quickly.
- Implementing Complex Algorithms: Writing routines for numerical methods not pre-programmed into the calculator.
- Educational Exploration: Students can create simulations or demonstrate mathematical concepts through interactive programs.
- Personalization: Tailoring the calculator’s functionality to specific user needs or courses.
These programming capabilities transform the calculator from a static tool into a dynamic, adaptable computing environment.
Data Analysis and Statistics: Insights from Raw Numbers
Graphing calculators excel at handling data. Users can input lists of numbers, perform various statistical analyses, and visualize the data in multiple ways. This includes:
- Data Entry and Manipulation: Creating, editing, and sorting lists of data.
- Descriptive Statistics: Quickly calculating sums, means, medians, standard deviations for large datasets.
- Inferential Statistics: Performing t-tests, chi-squared tests, ANOVA, and generating confidence intervals.
- Regression Analysis: Fitting curves (linear, quadratic, exponential, logarithmic, power) to data points to model relationships and make predictions.
This statistical suite makes them essential for science experiments, social science research, and business analysis.
Connectivity and Peripheral Support: Expanding Utility
Modern graphing calculators often feature connectivity options that enhance their utility:
- USB Connectivity: For connecting to computers to transfer data, programs, or update firmware. This also allows for interaction with calculator-specific software that emulates the calculator on a PC, for better screen visibility in classroom settings.
- Unit-to-Unit Cables: To share data and programs directly between two calculators, facilitating collaborative learning.
- Peripheral Ports: Some models support connecting external sensors (e.g., motion detectors, temperature probes, pH sensors) for real-time data collection in science experiments, turning the calculator into a portable data logger and analysis device.
These connectivity features bridge the gap between the standalone calculator and the broader digital ecosystem, enhancing its role as an integrated learning and analysis tool.
Why Graphing Calculators Matter: Benefits and Applications
The impact of graphing calculators extends across educational, professional, and personal spheres, offering distinct advantages that justify their continued relevance.
Enhancing Mathematical Comprehension and Problem-Solving
Perhaps the most significant benefit of graphing calculators in education is their ability to foster a deeper conceptual understanding of mathematics. By allowing immediate visualization of functions and data, they help students:
- Connect Algebra to Geometry: See how equations translate into shapes and vice-versa.
- Test Hypotheses: Explore different values for variables and observe the immediate impact on the graph.
- Reduce Computational Burden: Focus on what a problem is asking and how to solve it, rather than getting bogged down in arithmetic errors.
- Promote Exploration: Experiment with mathematical concepts in a dynamic, interactive way, turning abstract theory into concrete discovery.
- Develop Critical Thinking: Analyze trends, identify anomalies, and interpret graphical information.
This shift from rote calculation to conceptual exploration significantly improves problem-solving skills and long-term retention of mathematical principles.
Indispensable in STEM Education: High School to University
Graphing calculators are a staple in high school mathematics (Algebra, Pre-Calculus, Calculus, Statistics) and science courses (Physics, Chemistry). They are often required for standardized tests like the SAT, ACT, and Advanced Placement (AP) exams, where their use can significantly expedite complex problem-solving. At the university level, they remain valuable tools, particularly in introductory engineering, physics, and advanced mathematics courses, often serving as a reliable backup when more powerful software isn’t readily available or permitted. They provide a common, accessible platform for all students to engage with demanding curricula.
Professional Applications: Engineering, Science, and Finance
While sophisticated software packages are prevalent in professional settings, graphing calculators still find their niche. Engineers use them for quick field calculations, troubleshooting, and verifying results from larger simulations. Scientists employ them for data analysis, statistical modeling, and on-site experimental calculations where a laptop might be impractical. In finance, they are used for complex financial modeling, investment analysis, and actuarial calculations, especially models with multiple variables or requiring graphical representation of financial trends. Their portability and robustness make them ideal for situations where a full computer is overkill or inconvenient.
Bridging Theory and Real-World Scenarios
Graphing calculators allow users to model real-world phenomena and analyze data collected from experiments or observations. For example, students can:
- Graph the trajectory of a projectile to understand quadratic motion.
- Analyze population growth models using exponential functions.
- Study economic trends by plotting supply and demand curves.
- Process sensor data from a physics experiment to derive physical laws.
This ability to connect abstract mathematical theory to tangible, observable events makes learning more relevant and engaging, illustrating the practical power of mathematics and science in understanding the world around us.
Navigating the Landscape: Types and Considerations
The market for graphing calculators, while dominated by a few key players, offers a variety of models, each with distinct features catering to different needs. Moreover, the rise of digital alternatives presents new considerations for users.
Traditional Graphing Calculators: The Workhorses
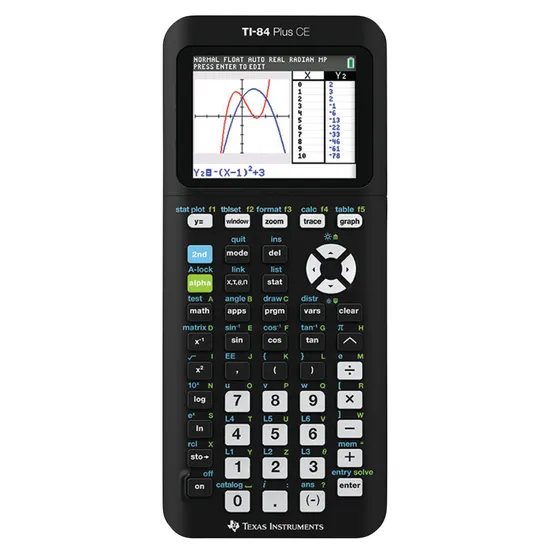
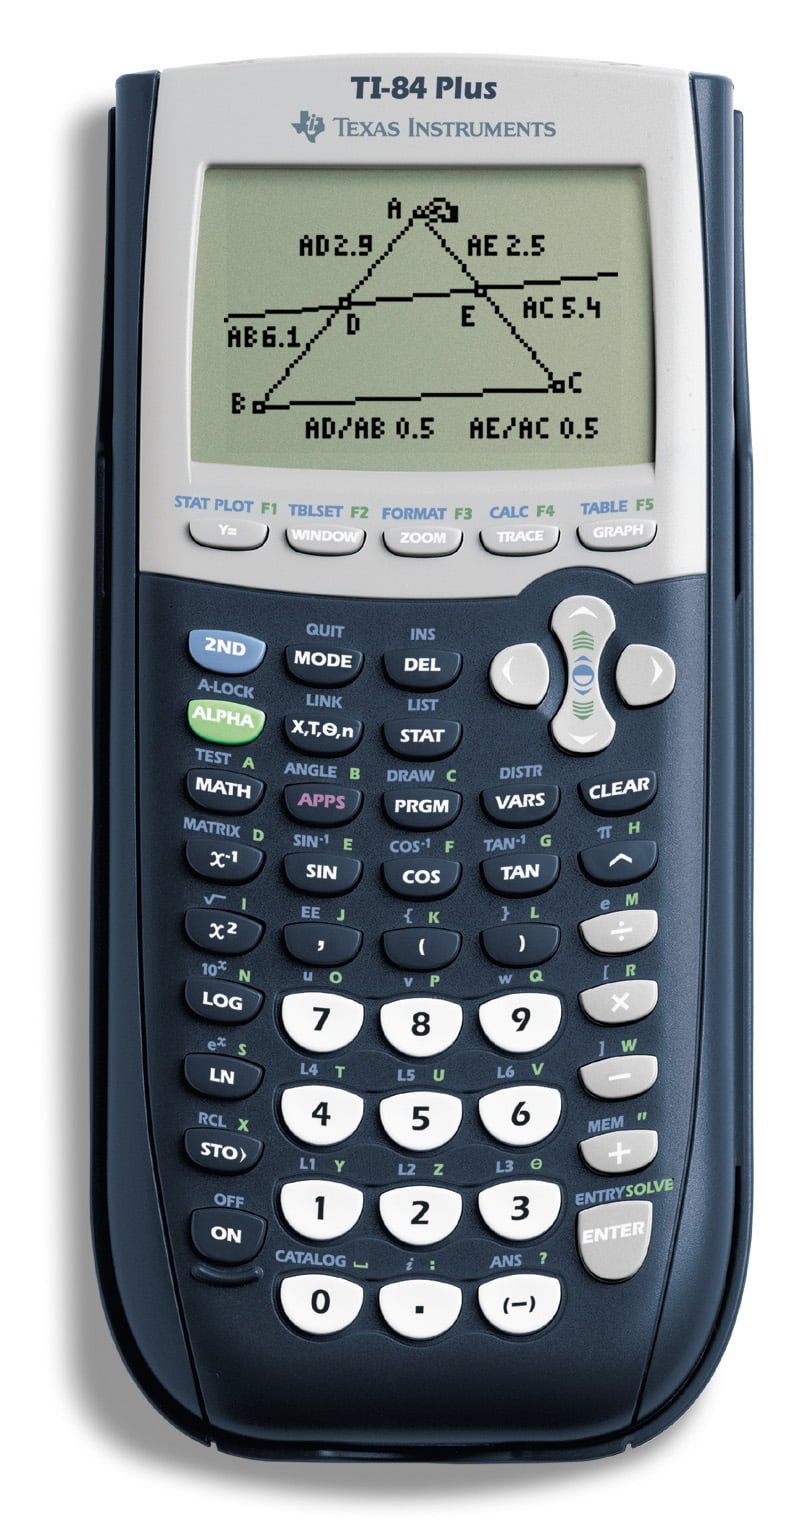
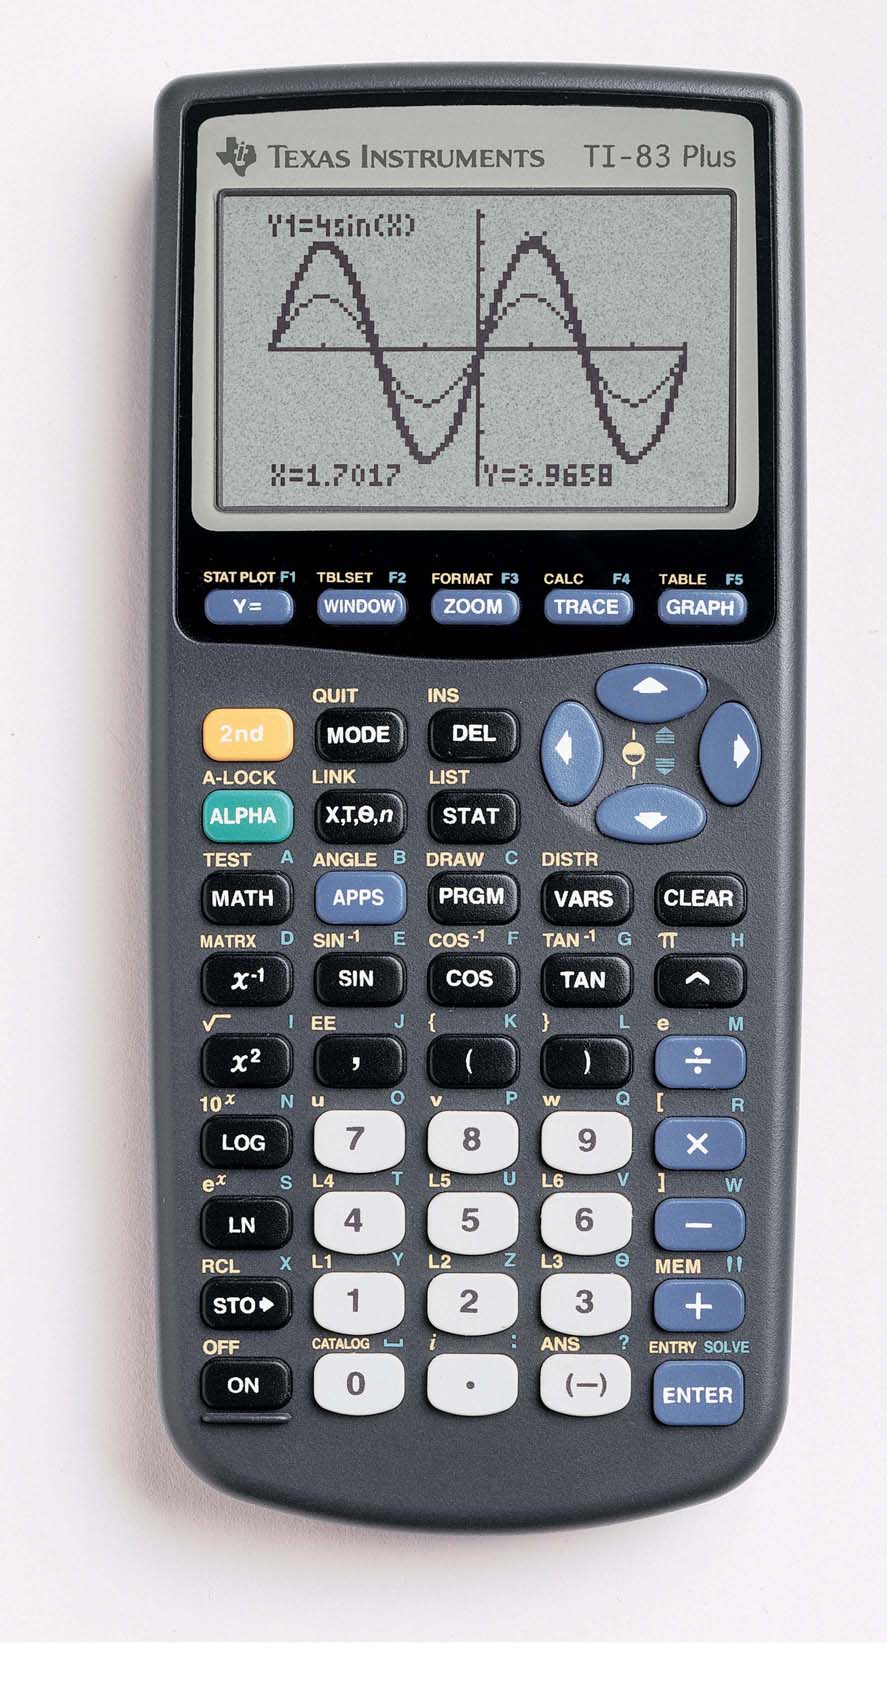
These are the most common type, epitomized by models like the Texas Instruments TI-83 Plus, TI-84 Plus, and the Casio fx-9750GII. They feature monochrome or color screens, robust mathematical and statistical functions, and programming capabilities. They are generally permitted on standardized tests and are a reliable choice for most high school and early college curricula. Their interfaces are well-established, making them easy to learn for new users.
CAS (Computer Algebra System) Calculators: Advanced Symbol Manipulation
CAS calculators, such as the TI-Nspire CX CAS or the HP Prime, represent a significant upgrade. They possess a Computer Algebra System, meaning they can perform symbolic manipulation in addition to numerical calculations. This allows them to:
- Solve equations symbolically: Giving solutions in terms of variables (e.g., solving
ax^2 + bx + c = 0forxusing the quadratic formula). - Perform symbolic differentiation and integration: Providing analytical answers rather than just numerical approximations.
- Simplify algebraic expressions: Factoring, expanding, and combining terms symbolically.
While incredibly powerful for advanced mathematics, CAS calculators are often restricted or entirely prohibited on certain standardized tests (like some sections of the ACT or specific university exams) due to their ability to solve problems analytically without the user showing work. Users must verify test policies before investing in a CAS model.
Modern Alternatives: Software, Apps, and Online Tools
The digital age has brought forth numerous alternatives to dedicated graphing calculator hardware:
- Computer Software: Programs like MATLAB, Mathematica, Maple, and even free tools like GeoGebra or Desmos, offer far greater computational power, visual fidelity, and flexibility than handheld calculators. These are standard in higher education and professional fields.
- Smartphone and Tablet Apps: Many apps emulate graphing calculator functionality (e.g., “Graphing Calculator by Mathlab” or “Desmos Graphing Calculator”). These are convenient and often free or low-cost, leveraging the powerful hardware and high-resolution screens of mobile devices.
- Online Graphing Tools: Websites like Desmos.com or WolframAlpha provide instant graphing and computational capabilities directly in a web browser.
While these alternatives offer significant advantages in terms of power and accessibility, they often lack the exam compatibility and the distraction-free, dedicated environment of a physical graphing calculator, which can be crucial for focused study and testing.
Choosing the Right Tool for the Task: Factors to Consider
Selecting a graphing calculator (or an alternative) involves several considerations:
- Course Requirements: The most critical factor. What models are explicitly required or permitted by your school or specific exams?
- Features Needed: Do you need basic graphing, advanced calculus, statistics, programming, or CAS functionality?
- User Interface: Some prefer button-heavy traditional interfaces; others prefer touchscreens or menu-driven systems.
- Budget: Prices vary significantly, from basic models to high-end CAS calculators.
- Durability and Battery Life: Important for a device intended for years of use and often taken to exams without charging.
- Future-Proofing: While a basic model might suffice now, consider if a more advanced model could serve you longer through various academic levels.
The Future of Computational Tools: Graphing Calculators in a Digital Age
The role of the graphing calculator continues to evolve in a world increasingly dominated by powerful computers and AI. While some predict its obsolescence, its unique position as a dedicated, exam-approved, and distraction-free mathematical tool ensures its continued relevance, albeit with necessary adaptations.
Integration with Digital Learning Environments
Future graphing calculators are likely to integrate more seamlessly with digital learning platforms. This could involve enhanced connectivity for uploading assignments, downloading course materials, and collaborative learning features. Emulators and online versions will become even more sophisticated, offering identical functionality to physical devices for remote learning and accessibility. The focus will shift from just raw computation to becoming a central part of a holistic learning ecosystem.
The Balance Between Dedicated Hardware and Software Solutions
The debate between dedicated hardware and software solutions will persist. For standardized testing and environments where internet access or other device use is restricted, physical graphing calculators will remain essential. However, for exploration, deep analysis, and professional work, software on computers or tablets will continue to dominate due to their superior processing power, larger displays, and broader functionality. The future likely holds a coexistence, with each serving distinct purposes and user needs. Innovation in hardware will focus on improved user experience, better displays, longer battery life, and possibly even more specialized functionality tailored to specific STEM fields.
Accessibility and Continuous Innovation
As technology advances, graphing calculators will likely become more accessible, potentially incorporating features for visually impaired users or those with other learning challenges. Continuous innovation will see improved processors, more intuitive interfaces, and new applications that leverage their core strengths. Whether through enhanced touchscreens, integrated sensor capabilities, or refined educational content, graphing calculators will continue to adapt, reinforcing their role not just as calculating devices, but as powerful instruments for mathematical discovery and scientific exploration.
In conclusion, a graphing calculator is much more than a device for calculations; it is a pedagogical tool, a problem-solving aid, and a window into the visual splendor of mathematics. Its enduring presence in education and various professional fields attests to its unparalleled ability to bridge the abstract and the concrete, empowering users to understand, analyze, and innovate in an increasingly complex world.
aViewFromTheCave is a participant in the Amazon Services LLC Associates Program, an affiliate advertising program designed to provide a means for sites to earn advertising fees by advertising and linking to Amazon.com. Amazon, the Amazon logo, AmazonSupply, and the AmazonSupply logo are trademarks of Amazon.com, Inc. or its affiliates. As an Amazon Associate we earn affiliate commissions from qualifying purchases.