
In today’s data-driven world, the ability to visualize complex information clearly and effectively is no longer a luxury but a fundamental skill. Whether you’re a seasoned data scientist, a budding machine learning engineer, a curious analyst, or simply someone looking to make sense of datasets, Python’s Matplotlib library stands out as an indispensable tool. As a core component of the Python scientific computing ecosystem, Matplotlib empowers users to create static, animated, and interactive visualizations with remarkable flexibility and precision. This comprehensive guide will walk you through the process of installing matplotlib.pyplot, its most widely used module, ensuring you’re ready to transform raw data into insightful graphs and charts.

Our journey will cover everything from understanding what Matplotlib is and why it’s so crucial, to preparing your environment, executing the installation, verifying its success, and troubleshooting common issues. By the end of this article, you’ll not only have Matplotlib successfully installed but also a deeper appreciation for its role in enhancing productivity and decision-making across various technological domains, from AI tools to business analytics.
Understanding Matplotlib and Its Core Component: Pyplot
Before we dive into the mechanics of installation, let’s establish a clear understanding of what Matplotlib is and why matplotlib.pyplot is so central to its functionality.
Matplotlib is a comprehensive library for creating static, animated, and interactive visualizations in Python. It’s designed to be as powerful and flexible as MATLAB, providing a familiar interface for many users coming from scientific computing backgrounds. Its extensive feature set allows you to generate plots, histograms, power spectra, bar charts, error charts, scatter plots, and much more, with just a few lines of code. The library integrates seamlessly with other essential Python libraries like NumPy (for numerical operations) and Pandas (for data manipulation), forming the backbone of many data analysis workflows.
The true workhorse for most users within Matplotlib is the matplotlib.pyplot module. Think of pyplot as Matplotlib’s state-based interface. It provides a MATLAB-like collection of functions that make Matplotlib easy to use for creating simple plots. Each pyplot function makes some change to a figure: for example, creates a figure, creates a plotting area in a figure, plots some lines in a plotting area, decorates the plot with labels, etc. When imported, pyplot is typically aliased as plt for brevity and convention, allowing you to call functions like plt.plot(), plt.xlabel(), plt.title(), and plt.show() to build and display your visualizations efficiently.
In an age dominated by data and the rapid evolution of AI tools, the ability to effectively communicate findings is paramount. Matplotlib, through pyplot, bridges the gap between complex datasets and human understanding. It allows developers and researchers to visually identify patterns, anomalies, and relationships that might be hidden within rows and columns of data. This visual insight directly contributes to better decision-making, more effective model debugging in machine learning, and clearer presentation of research findings, thereby significantly boosting productivity in any tech-oriented role.
Preparing Your Environment: Prerequisites for Installation
A smooth installation process begins with a well-prepared environment. Matplotlib, like most Python libraries, relies on a few core components being correctly set up on your system. Taking the time to ensure these prerequisites are met will save you significant troubleshooting later on.
Python Installation
The fundamental requirement for installing Matplotlib is, naturally, Python itself. Matplotlib is a Python library, meaning it needs a Python interpreter to run. It’s generally recommended to use a relatively recent version of Python (e.g., Python 3.8 or newer) to ensure compatibility and access to the latest features and security updates.
To check if Python is already installed on your system and to verify its version, open your terminal or command prompt and type:
python --version
or, if you have multiple Python versions, you might need to use:
python3 --version
If Python is not installed, or if you have an outdated version, you can download the latest stable release from the official Python website (python.org). The installation process is straightforward across Windows, macOS, and Linux, but remember to check the “Add Python to PATH” option during installation on Windows, as this simplifies command-line usage.
Ensuring Pip is Up-to-Date
Pip is Python’s package installer, a crucial tool for managing third-party libraries like Matplotlib. It handles downloading, installing, and uninstalling Python packages from the Python Package Index (PyPI) and other indexes. An outdated version of pip can sometimes lead to installation failures or dependency issues.
To check your pip version, use the following command in your terminal:
pip --version
It’s always a good practice to ensure pip itself is up-to-date. You can upgrade pip to its latest version using the following command:
python -m pip install --upgrade pip
This command uses the python -m flag, which is generally recommended for running pip, as it ensures you’re using the pip associated with your currently active Python interpreter, especially when multiple Python versions are installed.
The Importance of Virtual Environments
One of the most critical best practices in Python development, especially when dealing with multiple projects and diverse dependency requirements, is the use of virtual environments. A virtual environment is an isolated Python environment that allows you to install packages for a specific project without interfering with other projects or the global Python installation. This prevents “dependency hell,” where different projects require conflicting versions of the same library.
There are two primary tools for creating virtual environments:
venv: Built into Python 3. It’s lightweight and perfect for most standard Python projects.- Conda: A package and environment manager often used with Anaconda or Miniconda distributions. Conda is particularly popular in the data science community because it can manage packages written in any language, not just Python.
Using venv (recommended for general Python projects):
-
Create a virtual environment: Navigate to your project directory in the terminal and run:
python -m venv myenv(Replace
myenvwith a descriptive name for your environment, e.g.,matplotlib_env). -
Activate the virtual environment:
- On Windows:
bash

.myenvScriptsactivate
- On macOS and Linux:
bash

source myenv/bin/activate
- On Windows:
Once activated, your terminal prompt will typically show the environment’s name (e.g., (myenv)), indicating that any packages you install will be contained within this isolated environment.
Using Conda (if you have Anaconda/Miniconda installed):
-
Create a Conda environment:
conda create --name myenv python=3.9(Replace
myenvand3.9with your desired name and Python version). -
Activate the Conda environment:
bash

conda activate myenv
For the remainder of this guide, we’ll assume you’ve activated a virtual environment, as this is the most robust and recommended approach for managing your Python projects and dependencies, ultimately contributing to a more organized and productive development workflow.
Step-by-Step Installation of Matplotlib
With your environment prepared and (ideally) a virtual environment activated, you’re ready to install Matplotlib. The process is straightforward, primarily relying on pip or conda.
Standard Installation via Pip
The most common and recommended way to install Matplotlib, especially after activating a virtual environment, is using pip. When you install Matplotlib, pip will automatically handle its dependencies, most notably NumPy, which is a fundamental library for numerical computation in Python and a core requirement for Matplotlib.
To install Matplotlib, simply run the following command in your activated virtual environment’s terminal:
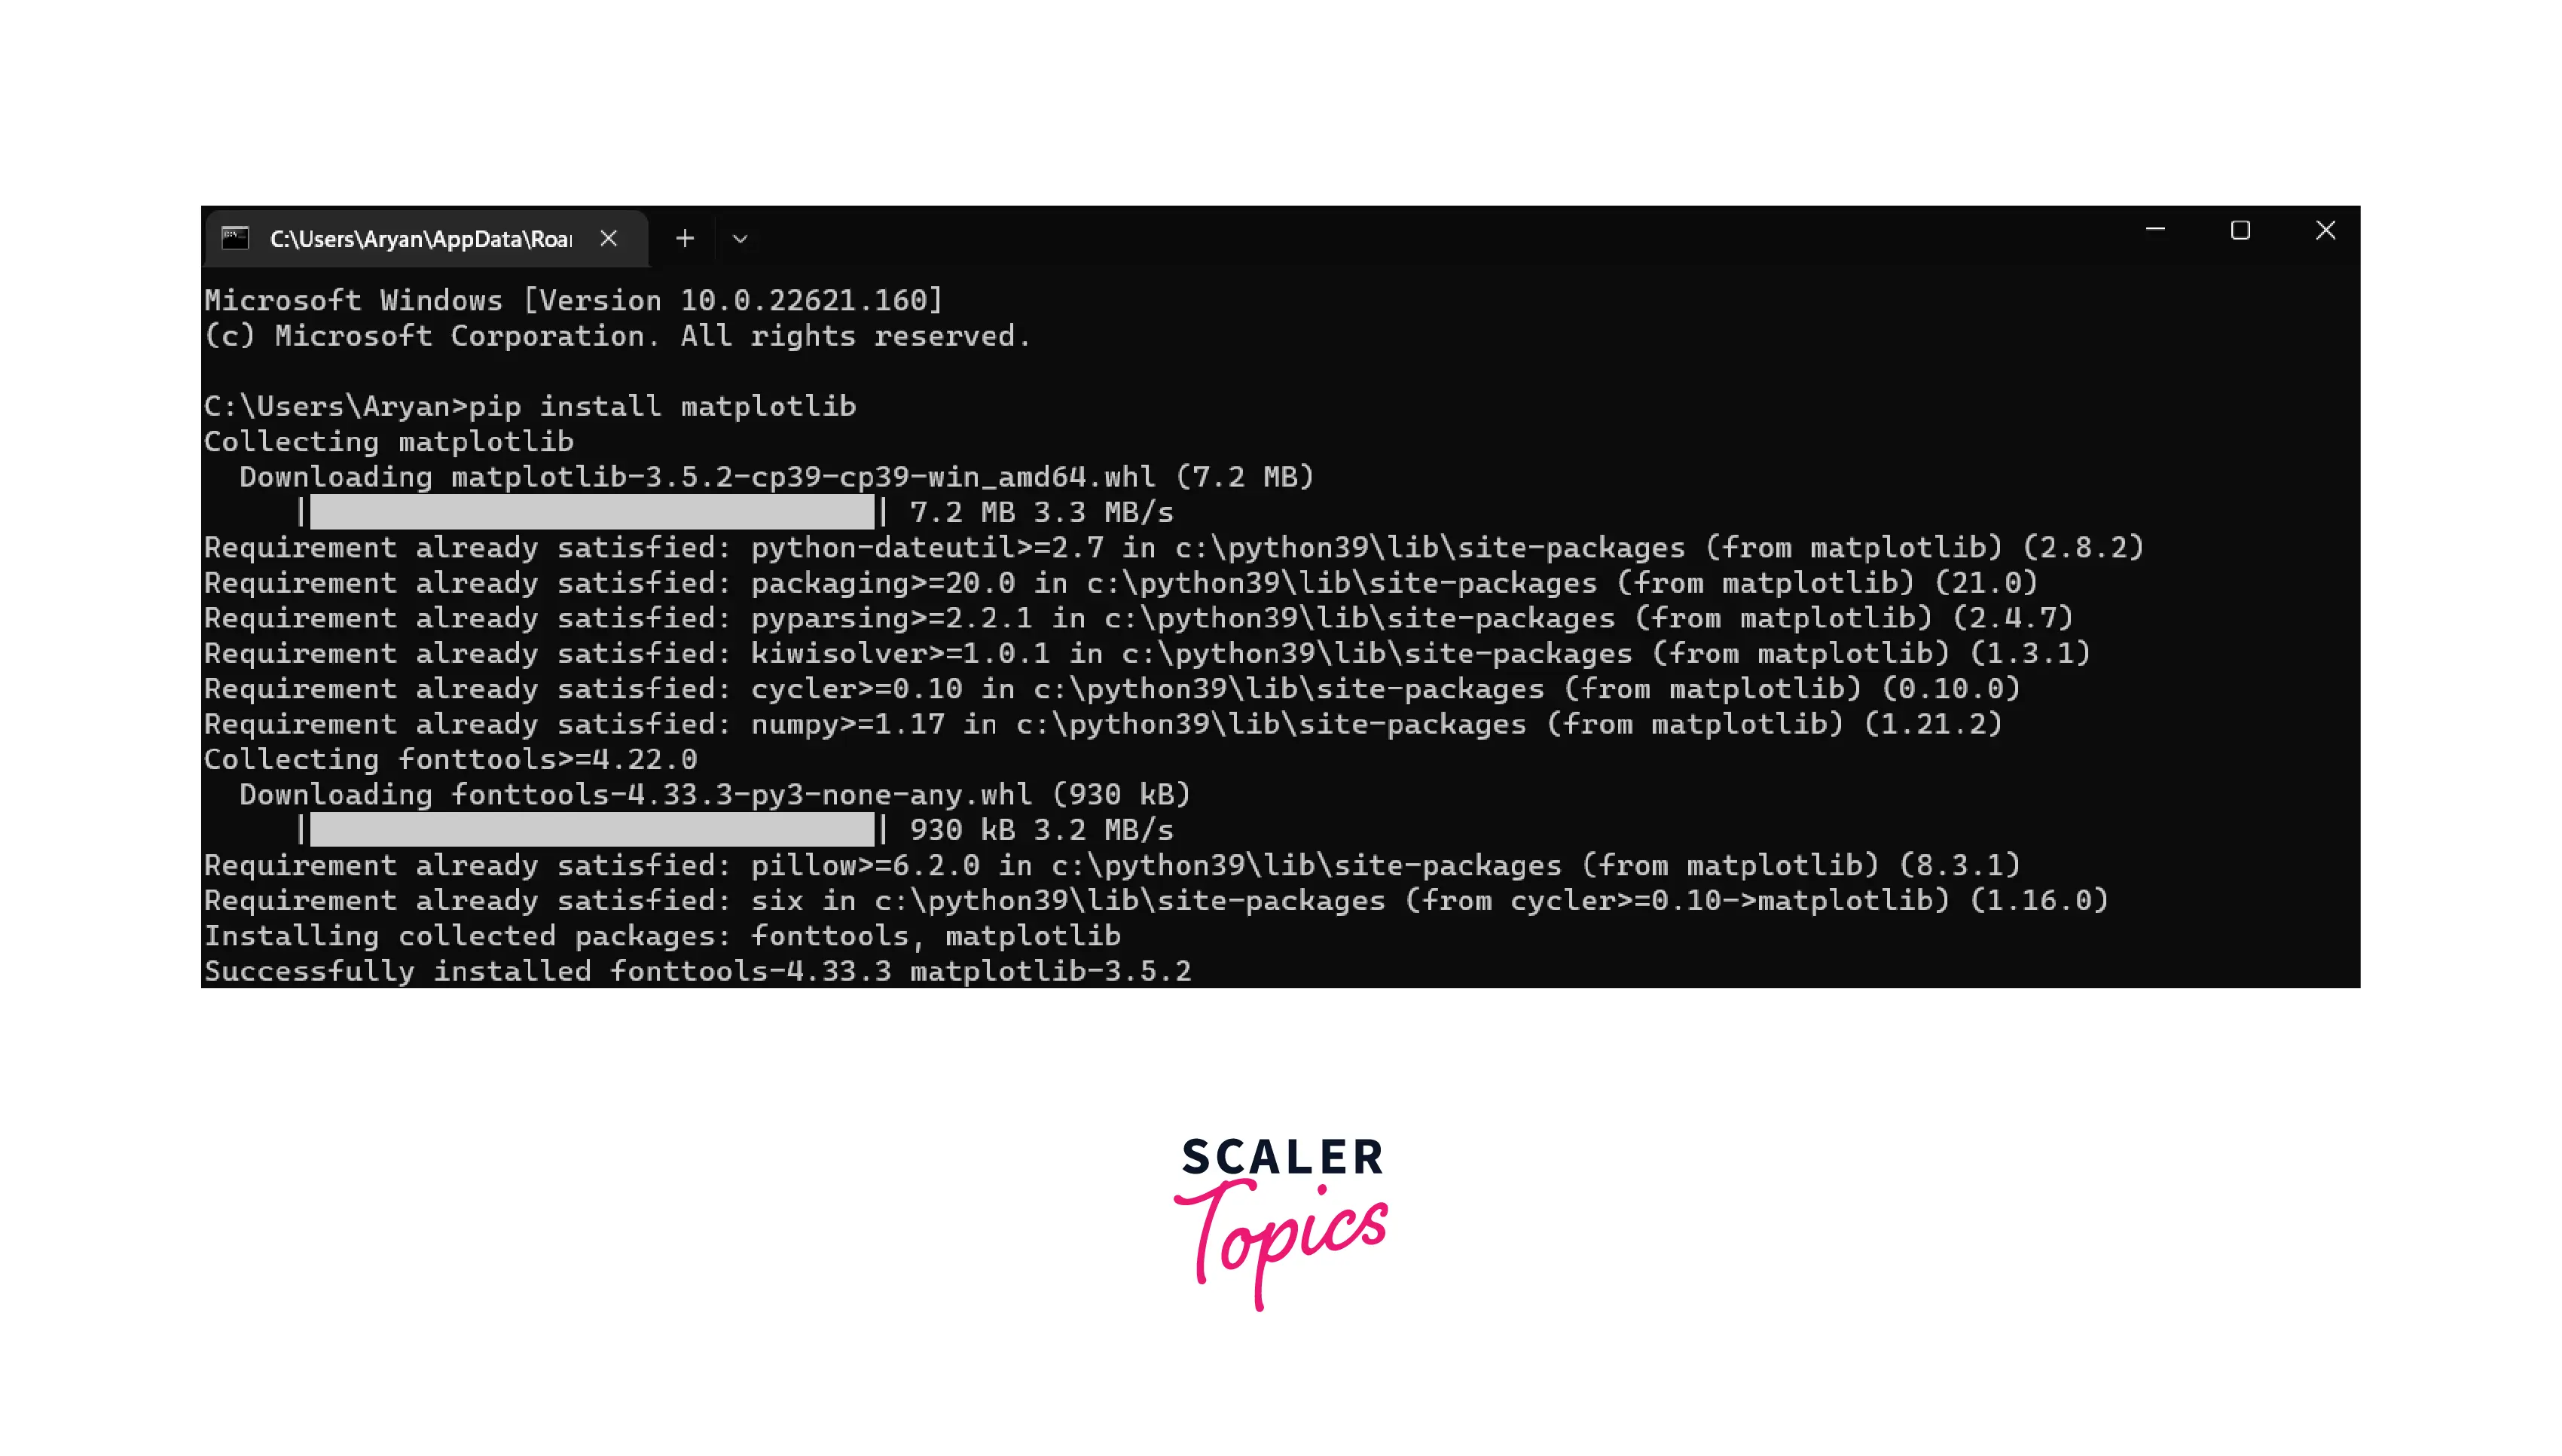
pip install matplotlib
Upon executing this command, you’ll see a series of messages indicating that pip is downloading Matplotlib and its dependencies, then installing them. This process might take a moment, depending on your internet connection and system speed. Once complete, you should see a message confirming successful installation.
Installing a specific version:
Sometimes, you might need to install a particular version of Matplotlib for compatibility with existing code or other libraries. You can do this by specifying the version number:
pip install matplotlib==3.7.1
(Replace 3.7.1 with the desired version number.)
Installing with Specific Backends (Optional but Good Practice)
Matplotlib uses “backends” to render plots. These backends can be either non-interactive (for generating image files like PNG, JPEG, PDF) or interactive (for displaying plots in a GUI window). By default, Matplotlib will try to find and use an available GUI backend (like TkAgg, Qt5, or WXagg) if you have one installed.
If you plan to create interactive plots, you might need to ensure a suitable GUI backend is installed. Matplotlib allows you to install common backends as “extras” alongside the main package. For example, to install Matplotlib with support for the PyQt5 backend (a popular choice for interactive applications):
pip install matplotlib[qt5]
Or, to install with support for all available backends (though this will download more packages and isn’t usually necessary unless you specifically need all of them):
pip install matplotlib[all]
For server environments where no graphical display is available, or if you strictly want to generate image files without displaying them, Matplotlib will automatically default to a non-interactive backend (like ‘Agg’). You can also explicitly set a non-interactive backend within your Python script using matplotlib.use('Agg') before importing pyplot. This is a common practice in web development frameworks or automated report generation where a GUI is neither desired nor available.
Installing in a Conda Environment (for Anaconda/Miniconda users)
If you’re using Anaconda or Miniconda, conda is your preferred package manager. Conda environments are particularly beneficial for data science applications as they handle not only Python packages but also system-level dependencies (like C/C++ libraries) that some scientific packages require.
To install Matplotlib in an active Conda environment:
conda install matplotlib
Conda will resolve all dependencies and prompt you to proceed with the installation. Type y and press Enter to confirm. Conda’s dependency resolution is often more robust than pip’s for complex scientific packages, making it an excellent choice for those deeply involved in data analytics, machine learning, and AI tool development.
Verifying Your Matplotlib Installation
After the installation process completes, it’s crucial to verify that Matplotlib, and specifically matplotlib.pyplot, has been successfully installed and is accessible to your Python interpreter. This step confirms that you’re ready to start visualizing data.
Simple Python Script Verification
The easiest way to verify the installation is to run a small Python script or interact with the Python interpreter directly.
-
Open your Python interpreter:
In your activated virtual environment’s terminal, typepython(orpython3) and press Enter. This will open the Python interactive shell. -
Import
matplotlib.pyplot:
At the Python prompt (>>>), type:import matplotlib.pyplot as pltIf this command executes without any
ModuleNotFoundErroror other error messages, it means Matplotlib is correctly installed andpyplotis available. -
Run a basic plotting example:
To further confirm that everything is working, let’s create and display a very simple plot. Continue in the Python interpreter:plt.plot([1, 2, 3, 4], [10, 20, 25, 30]) plt.xlabel('X-axis Label') plt.ylabel('Y-axis Label') plt.title('My First Matplotlib Plot') plt.show()Upon executing
plt.show(), a new window should pop up displaying a simple line plot with the data points(1,10),(2,20),(3,25), and(4,30), along with the specified labels and title. This confirms that Matplotlib’s plotting capabilities and its backend are functioning as expected. If no window appears, or if you get an error related to GUI backends, refer to the troubleshooting section below.Note: In some integrated development environments (IDEs) like Jupyter notebooks or Spyder, plots might be displayed inline or within a specific pane rather than a separate window.
Checking Matplotlib Version
You can also programmatically check the version of Matplotlib that has been installed. This can be useful for debugging or ensuring you have a specific version for project compatibility.
In your Python interpreter or a script, after importing matplotlib:
import matplotlib
print(matplotlib.__version__)
This will print the installed version number of Matplotlib, giving you concrete confirmation of your setup.
Common Issues and Troubleshooting
While the installation process is generally smooth, you might encounter some issues. Here are some common problems and their solutions, designed to help you quickly get back on track and maximize your productivity.
Pip Not Found or Permission Errors
- “pip” not found: This usually means
pipis not in your system’s PATH.- Solution: Use
python -m pipinstead of justpip. This explicitly tells Python to run thepipmodule associated with your current Python installation, which is generally safer and more reliable. Ensure Python itself is in your PATH.
- Solution: Use
- Permission denied: On Linux/macOS, if you try to install packages globally without proper permissions, you might see “Permission denied” errors.
- Solution: Always use virtual environments. If you must install globally (not recommended), use
sudo pip install matplotlibon Linux/macOS (but be aware this can lead to system-wide dependency issues). On Windows, run your command prompt or PowerShell as an administrator.
- Solution: Always use virtual environments. If you must install globally (not recommended), use
Dependency Conflicts
Occasionally, installing Matplotlib might conflict with existing package versions, especially if you’re not using a virtual environment or if your environment is already cluttered.
- Symptoms: Error messages during installation mentioning specific package versions (e.g.,
numpyrequiresXbut you haveY). - Solution:
- Use a fresh virtual environment: This is the best preventive measure. Start with a new, empty virtual environment.
- Uninstall and reinstall: If a conflict arises in an existing environment, you might need to uninstall the conflicting packages and Matplotlib, then reinstall Matplotlib, allowing pip to install compatible dependencies.
bash

pip uninstall matplotlib numpy other_conflicting_package

pip install matplotlib
- Conda’s strength: Conda is generally better at resolving complex dependency trees and might be a superior choice if you frequently face such issues in data science projects.
Backend Issues (e.g., “no display name” or plots not showing)
If plt.show() doesn’t display a plot window or you encounter errors like _tkinter.TclError: no display name and no $DISPLAY environment variable (common on Linux servers), it indicates an issue with the graphical backend.
- Scenario 1: No GUI backend installed or recognized.
- Solution: Ensure you have a GUI toolkit installed that Matplotlib can use. For example, if you’re on Windows/macOS/Linux desktop,
pip install matplotlib[qt5](or[tk],[wx]) will install the necessary PyQt5 libraries (or Tkinter/wxPython) alongside Matplotlib. - On Linux, if you’re running headless (without a desktop environment), you might need an X server running or to install an X server (like
xorg-xauthorxvfb) and set up SSH X forwarding (ssh -X user@host).
- Solution: Ensure you have a GUI toolkit installed that Matplotlib can use. For example, if you’re on Windows/macOS/Linux desktop,
- Scenario 2: Running on a server without a display.
- Solution: If you intend to generate plots as image files (e.g., PNG, JPEG) without displaying them interactively, you need to use a non-interactive backend. Add the following lines at the very beginning of your Python script, before importing
matplotlib.pyplot:
python

import matplotlib

matplotlib.use('Agg')

import matplotlib.pyplot as plt
The ‘Agg’ backend creates high-quality raster images, perfect for saving plots to files.
- Solution: If you intend to generate plots as image files (e.g., PNG, JPEG) without displaying them interactively, you need to use a non-interactive backend. Add the following lines at the very beginning of your Python script, before importing
Outdated Pip or Python
As mentioned earlier, running older versions of Python or pip can lead to compatibility issues with newer Matplotlib releases.
- Solution: Regularly update both Python and pip. For Python, consider using a version manager like
pyenv(Linux/macOS) or installing the latest stable release from python.org. For pip, usepython -m pip install --upgrade pip.
By systematically addressing these common challenges, you can ensure a smooth Matplotlib experience, allowing you to focus on the exciting aspects of data visualization and exploration.

Conclusion
Installing Matplotlib.pyplot is your gateway to a powerful world of data visualization in Python. From intricate scientific plots to engaging business graphics, Matplotlib provides the tools to communicate insights effectively, making it an invaluable asset for anyone working with data. By following the steps outlined in this guide – from preparing your environment with Python and an up-to-date pip, to leveraging the isolation of virtual environments, executing the installation via pip or conda, and verifying its success – you’ve laid a solid foundation for your data exploration journey.
Remember, the ability to visualize data is a cornerstone of modern technological fields, driving advancements in AI tools, enhancing software development processes, and providing critical clarity in complex datasets. With Matplotlib installed and ready, you’re now empowered to transform raw numbers into compelling narratives, uncovering patterns, identifying trends, and making informed decisions that propel innovation and productivity. Dive in, experiment with different plot types, and unleash the full potential of your data with Matplotlib!
aViewFromTheCave is a participant in the Amazon Services LLC Associates Program, an affiliate advertising program designed to provide a means for sites to earn advertising fees by advertising and linking to Amazon.com. Amazon, the Amazon logo, AmazonSupply, and the AmazonSupply logo are trademarks of Amazon.com, Inc. or its affiliates. As an Amazon Associate we earn affiliate commissions from qualifying purchases.