In the intricate world of finance, numbers speak volumes, but their true meaning often remains obscured until they are translated into a universal language: percentages. From evaluating investment returns and dissecting budget allocations to understanding loan interest and gauging business growth, percentages serve as indispensable tools for financial literacy and strategic decision-making. They transform raw, often disparate figures into comparable, actionable insights, enabling individuals and businesses alike to make informed choices.
This guide delves into the fundamental mechanics of calculating percentages between two figures, elucidates their widespread financial applications, and equips you with the knowledge to wield this powerful mathematical concept with confidence and precision. Whether you’re a novice navigating your first budget or an experienced investor analyzing market trends, mastering percentage calculations is a cornerstone of financial acumen.

Understanding the Core Concept: Why Percentages Matter in Finance
At its heart, a percentage represents a proportion or a share of a whole, expressed as a fraction of 100. The term “percent” literally means “per hundred” or “out of one hundred.” This standardization to a base of 100 makes percentages incredibly valuable in financial contexts because they provide a common ground for comparing quantities that might otherwise be incomparable.
The Ubiquity of Percentages in Financial Decision-Making
Think about the myriad ways percentages permeate our financial lives. When you see an interest rate on a savings account, a discount on a new purchase, a property tax rate, or the performance of your retirement portfolio, you’re looking at percentages. They are the language of financial comparison, allowing us to:
- Compare different opportunities: Which investment offers a better return? Which loan has a lower annual percentage rate (APR)?
- Track progress over time: How much has my salary increased? By what percentage did my business revenue grow this quarter?
- Allocate resources effectively: What percentage of my income should go towards housing, savings, or debt?
- Assess risk and reward: What is the probability of a market downturn, expressed as a percentage?
Without percentages, we’d be left with raw numbers that are often too abstract to provide meaningful context. For instance, knowing you saved an extra $50 this month is good, but knowing you increased your savings rate by 10% from last month provides a more powerful metric for trend analysis and goal tracking.
Bridging Raw Numbers to Actionable Insights
The real power of percentages lies in their ability to bridge the gap between absolute figures and actionable insights. An increase in profit of $10,000 for a small business means one thing, but if that represents a 200% growth from the previous year, it signifies remarkable success. Conversely, if it’s only a 1% increase for a multi-billion dollar corporation, it might indicate stagnation. Percentages provide the necessary context, helping us interpret the magnitude and significance of changes and differences. They allow us to normalize data, making it easier to identify trends, benchmark performance, and make strategic adjustments.
Avoiding Common Misinterpretations
While powerful, percentages can also be easily misinterpreted if not applied correctly. A common pitfall is misunderstanding the “base” or “whole” from which the percentage is derived. For example, a 50% discount followed by a 50% increase does not result in the original price. The base changes. Similarly, when comparing percentage changes, it’s crucial to ensure that the initial values are comparable. Understanding the specific context and the underlying raw numbers is paramount to drawing accurate conclusions from percentage calculations.
The Fundamental Formulas for Percentage Calculation
Mastering percentage calculations begins with understanding a few core formulas. These foundational equations are the building blocks for virtually all financial analyses involving proportions and changes.
Calculating a Percentage of a Whole
This is perhaps the most basic percentage calculation. It answers questions like: “What is 20% of $500?” or “If I earned $3,000 and paid $300 in taxes, what percentage of my income went to taxes?”
Formula:
- Part / Whole x 100 = Percentage
Example 1 (Finding the part):
To find 20% of $500:
- (20 / 100) x $500 = 0.20 x $500 = $100
So, 20% of $500 is $100.
Example 2 (Finding the percentage):
If your income is $3,000 and you paid $300 in taxes:
- $300 (Part) / $3,000 (Whole) x 100 = 0.10 x 100 = 10%
So, 10% of your income went to taxes.
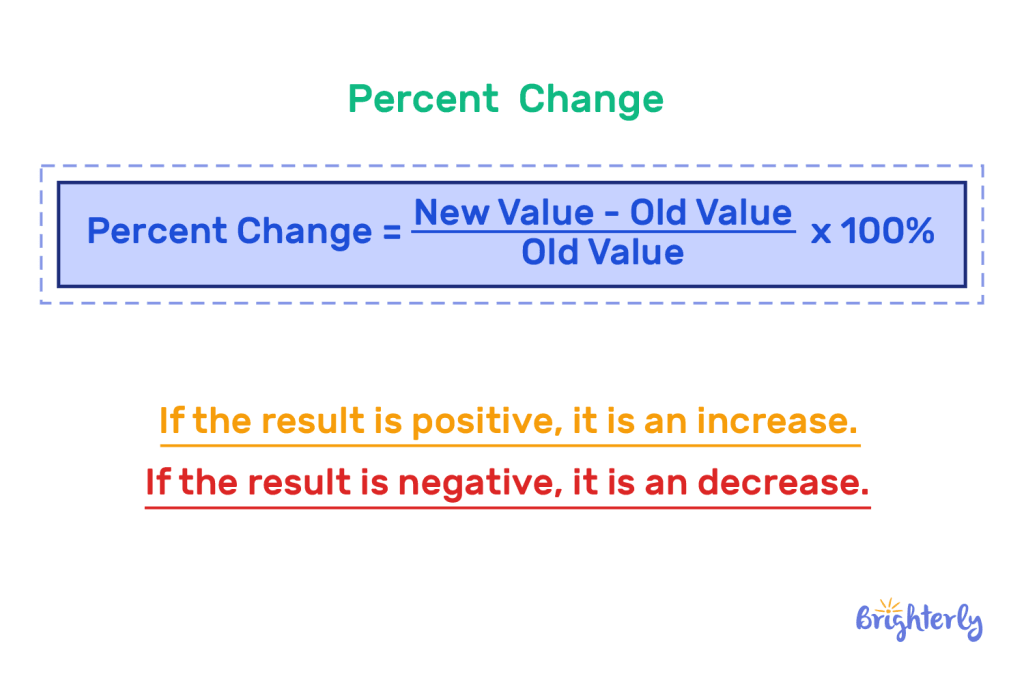
Determining Percentage Change (Increase or Decrease)
This calculation is vital for tracking growth, depreciation, inflation, and investment returns. It tells you how much a quantity has increased or decreased relative to its initial value.
Formula:
- ((New Value – Old Value) / Old Value) x 100 = Percentage Change
Example (Increase):
Your investment grew from $10,000 to $12,000.
- (($12,000 – $10,000) / $10,000) x 100
- ($2,000 / $10,000) x 100 = 0.20 x 100 = 20% increase.
Example (Decrease):
The value of your car decreased from $20,000 to $18,000.
- (($18,000 – $20,000) / $20,000) x 100
- (-$2,000 / $20,000) x 100 = -0.10 x 100 = 10% decrease. (The negative sign indicates a decrease).
Finding the Percentage Difference Between Two Numbers
While percentage change calculates change relative to an old value, percentage difference is often used when there isn’t a clear “old” or “new” value, or when you want to express the difference relative to their average. However, in many financial contexts, people use “percentage difference” interchangeably with “percentage change” when comparing two distinct figures where one is considered the baseline. For clarity, we’ll focus on the change relative to a reference point, which is more common in financial analysis. If a true symmetrical “difference” is needed, the denominator becomes the average of the two numbers.
Formula (using the baseline as the denominator, similar to percentage change):
- ((Absolute Difference Between Two Numbers) / Reference Number) x 100 = Percentage Difference
Example:
Company A earned $100,000, and Company B earned $150,000. How much more did Company B earn than Company A, in percentage terms (using Company A as the reference)?
- Absolute Difference = $150,000 – $100,000 = $50,000
- ($50,000 / $100,000) x 100 = 0.50 x 100 = 50%
Company B earned 50% more than Company A.
Reversing Percentage Calculations (Finding the Original Number)
Sometimes you know the final value and the percentage change, and you need to find the original value. This is common when dealing with sales or markups.
Formula:
- Original Value = Final Value / (1 + (Percentage Increase / 100))
- Original Value = Final Value / (1 – (Percentage Decrease / 100))
Example (Finding Original Price after Discount):
You bought an item for $80 after a 20% discount. What was the original price?
- $80 / (1 – (20 / 100)) = $80 / (1 – 0.20) = $80 / 0.80 = $100
The original price was $100.
Practical Applications in Personal Finance
Percentages are the bedrock of sound personal financial management. They enable clarity, facilitate planning, and empower individuals to make smart choices about their money.
Budgeting and Expense Tracking: Allocating Your Income
One of the most common applications of percentages in personal finance is budgeting. The 50/30/20 rule, for example, suggests allocating 50% of your after-tax income to needs, 30% to wants, and 20% to savings and debt repayment.
- Calculating percentages of income: If your net monthly income is $4,000, 50% for needs means $4,000 x 0.50 = $2,000.
- Tracking expense categories: By tracking where your money goes, you can calculate what percentage of your income is spent on groceries, entertainment, or transportation. This reveals spending patterns and areas for potential savings. For instance, if you spend $600 on dining out from your $4,000 income, that’s ($600 / $4,000) x 100 = 15% of your income – perhaps higher than desired.
Saving and Investing: Measuring Growth and Returns
For savers and investors, percentages are crucial for evaluating performance and setting goals.
- Savings rate: What percentage of your income are you saving? This is a key metric for financial independence.
- Investment returns: The annualized return of a stock, mutual fund, or entire portfolio is expressed as a percentage. If your portfolio grew from $50,000 to $55,000 in a year, that’s a (($55,000 – $50,000) / $50,000) x 100 = 10% return. Comparing these percentages helps you assess which investments are performing best.
- Compound interest: Understanding how interest compounds involves percentages. Knowing that a 7% annual return means your money roughly doubles every 10 years (Rule of 72: 72 / 7 ≈ 10.3 years) is a powerful insight.
Debt Management: Understanding Interest Rates and Payments
Debt, whether it’s a mortgage, car loan, or credit card balance, is intrinsically linked to percentages.
- Interest rates (APR/APY): The Annual Percentage Rate (APR) tells you the percentage cost of borrowing money over a year. A 20% APR on a credit card can quickly lead to substantial interest payments if balances are not paid off.
- Mortgage payments: Understanding the principal and interest breakdown of your mortgage payment involves percentages, influencing how quickly you build equity.
- Debt-to-income ratio: Lenders often use your debt-to-income (DTI) ratio, expressed as a percentage, to assess your ability to manage monthly payments and repay debts. A high DTI might prevent you from securing new loans.
Navigating Sales and Discounts: Real Savings Assessment
Sales and discounts are designed to entice buyers, and percentages are key to understanding the real savings.
- Calculating discounts: An item originally priced at $200 with a 25% discount means you save $200 x 0.25 = $50, paying $150.
- Comparing offers: Is a “buy one, get one 50% off” deal better than a flat 30% off? Calculating the effective percentage discount across different scenarios helps you identify the true best deal.
- Tax calculations: Sales tax is a percentage added to the price of goods and services, directly impacting the final cost.
Leveraging Percentages in Business and Investment Finance
Beyond personal finance, percentages are the lingua franca of business analysis and investment strategy, offering critical insights into performance, profitability, and risk.
Profit Margins and Revenue Growth: Gauging Business Health
Businesses extensively use percentages to evaluate their financial health and operational efficiency.
- Gross Profit Margin: (Gross Profit / Revenue) x 100. This percentage indicates how much profit a company makes from its core operations after accounting for the cost of goods sold. A higher margin suggests more efficient production or pricing power.
- Net Profit Margin: (Net Profit / Revenue) x 100. This percentage shows the true profitability of a company after all expenses, including taxes and interest, have been deducted. It’s a key indicator for investors.
- Revenue Growth Rate: Percentage change in revenue from one period to another. This metric is crucial for assessing a company’s expansion and market penetration. Steady, high growth rates are often a sign of a healthy, expanding business.
Portfolio Performance: Tracking Investment Returns
Investors rely heavily on percentages to track the performance of their investments and entire portfolios.
- Annualized Returns: This standard metric expresses the percentage return an investment has generated over a year, allowing for easy comparison across different assets and timeframes.
- Sector Allocation: Investors often diversify their portfolios by allocating certain percentages to different sectors (e.g., 20% technology, 15% healthcare). This strategic allocation helps manage risk and optimize returns based on market outlook.
- Asset Class Allocation: Similar to sector allocation, allocating percentages to different asset classes (e.g., 60% stocks, 30% bonds, 10% cash) is fundamental to creating a balanced portfolio tailored to an individual’s risk tolerance and financial goals.
Financial Ratios: Benchmarking and Strategic Planning
Many critical financial ratios are expressed as percentages, providing standardized metrics for comparing a company’s performance against industry benchmarks or its own historical data.
- Return on Equity (ROE): (Net Income / Shareholder Equity) x 100. This ratio measures how much profit a company generates for each dollar of shareholders’ equity, indicating management’s efficiency in using equity to generate profits.
- Debt-to-Equity Ratio: (Total Debt / Shareholder Equity) x 100. While not always expressed as a percentage, it reveals the proportion of debt financing relative to equity financing. A very high ratio might signal higher risk.
- Current Ratio: Current Assets / Current Liabilities. Although expressed as a ratio (e.g., 2:1), its interpretation often involves thinking in terms of percentages (e.g., current assets are 200% of current liabilities).
Sales Commissions and Pricing Strategies
Businesses use percentages for various operational aspects, from compensating sales teams to setting competitive prices.
- Sales Commissions: Sales professionals often earn a percentage of the sales they generate. Calculating this involves applying a percentage to the total sales figure.
- Markups and Markdowns: Retailers calculate markups (the percentage added to the cost to determine the selling price) and markdowns (discounts) to manage inventory and achieve profit targets. A 50% markup on a $10 item means it sells for $15 ($10 + ($10 * 0.50)).
Tools and Best Practices for Accurate Percentage Calculations
While the underlying formulas are straightforward, applying them accurately and efficiently is crucial. Modern financial management often leverages technology to streamline these calculations.
Using Calculators and Spreadsheets Effectively
- Basic Calculators: For simple percentage calculations, any standard calculator will suffice. Most have a “%” button, but it’s often more intuitive to perform the division and multiplication steps manually to ensure understanding.
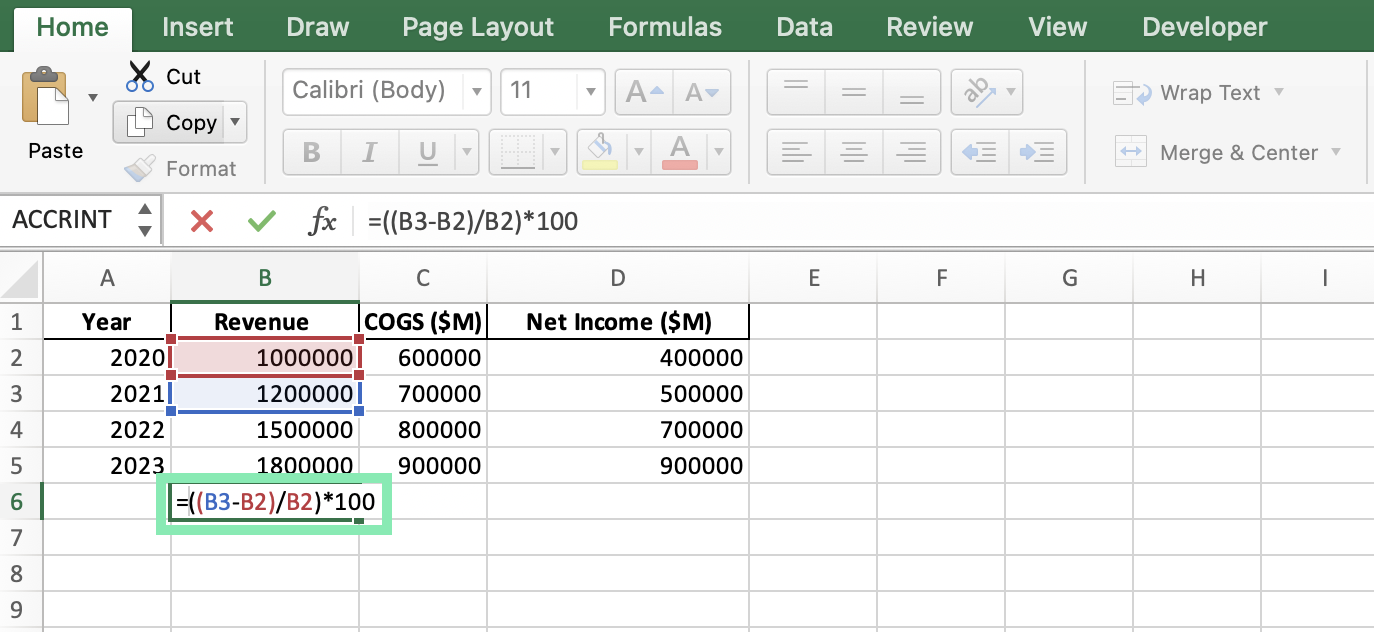
- Spreadsheets (Excel, Google Sheets): These are indispensable tools for more complex financial analysis. They allow you to:
- Automate calculations: Enter formulas once and apply them to thousands of data points.
- Visualize data: Create charts and graphs to illustrate percentage changes and distributions.
- Perform “what-if” scenarios: Easily adjust values to see the immediate impact on percentages.
- Example in Excel: To calculate percentage change from A1 (old value) to B1 (new value), the formula would be
=((B1-A1)/A1)*100.
The Importance of Context and Base Values
As mentioned earlier, misunderstanding the base value can lead to significant errors. Always ask: “Percentage of what?”
- If a product price increases by 10%, then decreases by 10%, it will not return to its original price because the base for the decrease is now the higher, increased price.
- When comparing growth rates, ensure the starting points are logically consistent. Comparing the percentage growth of a startup versus a mature company without acknowledging their vastly different scales can be misleading.
Double-Checking Your Calculations for Financial Accuracy
Financial decisions often have significant consequences, making accuracy paramount.
- Manual verification: For critical figures, perform the calculation again, perhaps in a different order or using a different tool, to confirm the result.
- Sense checking: Does the percentage seem reasonable? If you calculated a 500% increase on an investment in one year, and it wasn’t a very unusual speculative asset, it might warrant a recheck.
- Understanding the decimal equivalent: Remember that 50% is 0.50. Converting percentages to decimals for calculations (e.g., multiplying by 0.50 instead of 50/100) often reduces errors.
When to Seek Professional Financial Guidance
While understanding percentage calculations empowers you, complex financial situations often benefit from expert advice.
- Tax planning: Calculating effective tax rates, deductions, and credits can be intricate.
- Investment strategy: Developing a diversified portfolio and understanding advanced performance metrics.
- Business valuation: Determining the percentage ownership and value of a business.
- Estate planning: Allocating assets and understanding inheritance percentages.
Financial advisors, accountants, and other professionals use these calculations daily and can provide nuanced interpretations and strategic insights beyond basic computation.
Mastering how to calculate percentages between two figures is more than just a mathematical exercise; it’s a fundamental skill that unlocks a deeper understanding of the financial world around us. By applying these formulas and best practices across personal and business finance, you equip yourself with the tools to analyze data, make informed decisions, and ultimately achieve your financial objectives with greater clarity and confidence.
aViewFromTheCave is a participant in the Amazon Services LLC Associates Program, an affiliate advertising program designed to provide a means for sites to earn advertising fees by advertising and linking to Amazon.com. Amazon, the Amazon logo, AmazonSupply, and the AmazonSupply logo are trademarks of Amazon.com, Inc. or its affiliates. As an Amazon Associate we earn affiliate commissions from qualifying purchases.