In the realm of personal finance and professional investment, few metrics carry as much weight—or provide as much clarity—as the Compound Annual Growth Rate (CAGR). While the financial world is often cluttered with complex jargon and volatile data points, CAGR stands out as a reliable “smoothing” mechanism. it allows investors to understand the geometric progression of an investment over a specific period, effectively neutralizing the noise of year-to-year fluctuations.
Whether you are evaluating the performance of a high-growth stock, comparing the historical returns of different asset classes, or assessing the trajectory of a startup’s revenue, mastering the calculation and application of CAGR is essential. This guide explores the mechanics of this vital metric, its strategic utility in wealth management, and the nuances every financially savvy individual must understand to make informed decisions.
Understanding the Fundamentals of CAGR
At its core, the Compound Annual Growth Rate represents the mean annual growth rate of an investment over a specified period longer than one year, assuming that the investment has been compounding over that time. It is not a true “return” in the sense that it reflects what happened every single year; rather, it is a representational figure that describes the rate at which an investment would have grown if it had grown at a steady rate each year on a compounded basis.
What is Compound Annual Growth Rate?
CAGR is essentially a mathematical tool used to provide a smoothed annual rate of return. In the real world, markets are volatile. A portfolio might gain 20% in one year, lose 10% the next, and gain 5% the year after. If you simply looked at these percentages, it would be difficult to discern the actual trajectory of your wealth. CAGR collapses these fluctuations into a single, annualized percentage, providing a clear benchmark for long-term performance.
Why Simple Growth Rates Can Be Deceiving
Many novice investors make the mistake of using a “simple average” to calculate returns. For example, if an investment grows by 100% in Year 1 and drops by 50% in Year 2, a simple average would suggest a 25% annual return ([100 – 50] / 2). However, in reality, your net gain is zero. If you started with $1,000, you went up to $2,000 and then back down to $1,000. The CAGR in this scenario is 0%, reflecting the true economic reality. By accounting for the compounding effect—where returns are generated on top of previous returns—CAGR provides a level of honesty that simple arithmetic means cannot match.
The Mechanics of Calculation: Step-by-Step
Calculating CAGR may seem intimidating due to the presence of exponents, but the logic is straightforward. To calculate it, you need three primary pieces of data: the beginning value of the investment, the ending value of the investment, and the total time period (usually expressed in years).
The Mathematical Formula
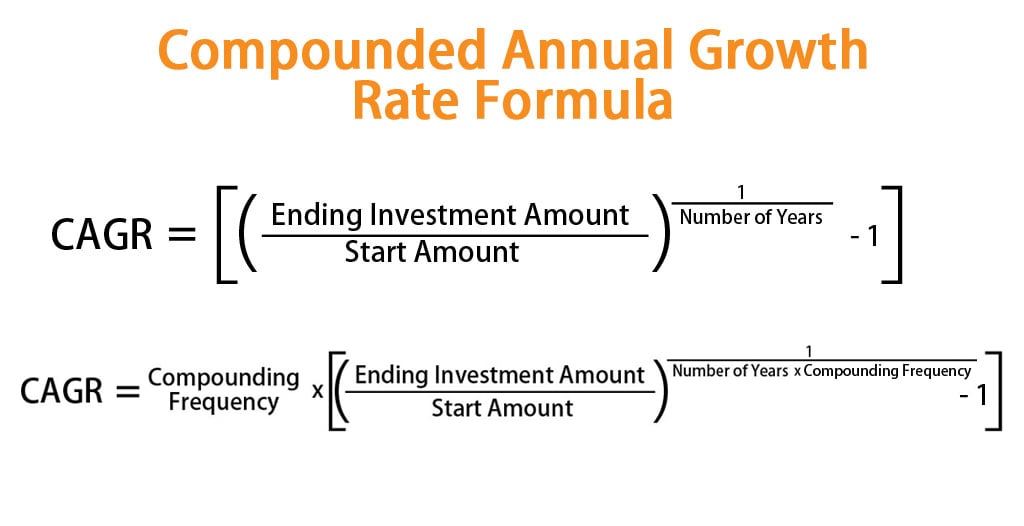
The formula for CAGR is:
CAGR = [(Ending Value / Beginning Value) ^ (1 / Number of Years)] – 1
To turn this into a percentage, you simply multiply the final result by 100. The “1/n” exponent is what performs the “annualizing” function, breaking down the total growth into its yearly components.
A Real-World Investment Example
Let us consider a practical scenario. Suppose you invested $10,000 in a diversified mutual fund on January 1, 2018. By December 31, 2023, your investment had grown to $18,500. This is a five-year period.
- Divide the ending value by the beginning value: 18,500 / 10,000 = 1.85
- Raise the result to the power of 1 divided by the number of years: 1.85 ^ (1/5) = 1.85 ^ 0.2 ≈ 1.1309
- Subtract 1 from the result: 1.1309 – 1 = 0.1309
- Convert to a percentage: 13.09%
In this example, your investment had a CAGR of 13.09%. This tells you that your money grew as if it earned a steady 13.09% every year for five years, compounded.
Utilizing Financial Tools for Precision
While manual calculation is excellent for understanding the theory, modern financial tools make this process instantaneous. In spreadsheet software like Microsoft Excel or Google Sheets, the formula =((End_Value/Start_Value)^(1/Years))-1 is the standard approach. Alternatively, the RRI function can be used: =RRI(number_of_periods, settlement, maturity). For those managing complex portfolios, many investment dashboards and brokerage platforms provide CAGR (often labeled as “Annualized Return”) automatically to help investors track their performance against benchmarks like the S&P 500.

Strategic Applications in Personal Finance and Business
CAGR is more than just a retrospective metric; it is a powerful lens through which future financial strategies are filtered. Its primary value lies in its ability to compare “apples to oranges” by bringing different investments onto a level playing field.
Comparing Different Asset Classes
Investors often face the dilemma of choosing between wildly different assets—for instance, a rental property, a collection of blue-chip stocks, and high-yield corporate bonds. Each of these assets has different volatility profiles and time horizons. By calculating the CAGR of each over a five- or ten-year period, an investor can determine which asset class is actually delivering the best “bang for the buck” regardless of the price swings experienced along the way.
Evaluating Business Performance and Revenue Trends
For business owners and corporate finance professionals, CAGR is a vital Key Performance Indicator (KPI). It is used to measure the growth of market share, revenue, and even customer acquisition over time. A company might have a “blockbuster” year followed by a period of stagnation. By looking at the revenue CAGR over a three-to-five-year period, management can identify whether the business is on a healthy long-term growth trajectory or if its success was a one-time anomaly.
Setting Realistic Financial Goals
When planning for retirement or a major purchase, such as a home, individuals often use a “target” growth rate to determine how much they need to save each month. By understanding historical CAGRs for various investment vehicles (e.g., the historical 7–10% CAGR of the stock market), an individual can build a more realistic financial plan. If your goal requires a 15% CAGR to succeed, but your portfolio is currently yielding a 5% CAGR, the math clearly signals that you either need to increase your contributions or adjust your risk tolerance.
The Limitations of CAGR: What It Doesn’t Tell You
Despite its utility, CAGR is a simplified metric, and reliance on it without context can lead to “financial blindness.” It is a tool of averages, and in the world of money, averages can sometimes hide dangerous realities.
The “Smoothing” Effect and Volatility
The greatest strength of CAGR—its ability to smooth out fluctuations—is also its greatest weakness. CAGR ignores volatility (risk). Two investments could have the exact same CAGR of 10% over five years. However, Investment A might have grown a steady 10% every year, while Investment B might have gained 50% in the first year and lost 30% in the second. While the end result is the same, Investment B is significantly riskier. An investor who needs to withdraw money in Year 2 would have been devastated by Investment B, even though the five-year CAGR looked attractive.
Timing of Cash Flows
The standard CAGR formula assumes a “lump sum” investment. It assumes you put money in at the beginning and took it out at the end. It does not account for “sequence of returns” or interim cash flows, such as additional monthly deposits, dividend reinvestments, or partial withdrawals. For portfolios with frequent inflows and outflows, the Money-Weighted Rate of Return (MWRR) or Time-Weighted Rate of Return (TWRR) are often more accurate, though significantly more complex to calculate.
Advanced Tips for Maximizing Long-Term CAGR
To truly benefit from the concepts behind CAGR, one must move beyond calculation and into the realm of optimization. Growing your wealth isn’t just about picking the right assets; it’s about protecting the compounding process.
The Power of Reinvestment
The “Compound” in Compound Annual Growth Rate is fueled by reinvestment. In a stock portfolio, this means using dividends to purchase more shares. In a business, it means taking profits and reinvesting them into R&D or marketing. When returns are reinvested, they begin to generate their own returns, creating an exponential growth curve. Over a 20-year period, the difference in CAGR between a portfolio that reinvests dividends and one that spends them is staggering.
Minimizing Taxes and Fees to Protect Your Growth
CAGR is often reported as a “gross” figure, but the only number that matters to your bank account is the “net” CAGR. Management fees (ER), brokerage commissions, and capital gains taxes act as “drag” on your growth rate. A 1% fee might seem small, but over 30 years, it can reduce your final portfolio value by hundreds of thousands of dollars. To maximize your CAGR, utilize tax-advantaged accounts (like 401(k)s or IRAs) and prioritize low-cost index funds that keep more of the growth in your pocket.

Conclusion: CAGR as a Tool for Financial Clarity
The Compound Annual Growth Rate is one of the most honest metrics available to the modern investor. By stripping away the emotional highs and lows of market volatility, it provides a cold, hard look at how effectively your capital is working for you.
However, remember that CAGR is a retrospective look at the past, not a guarantee of the future. It is a compass, not a crystal ball. By using CAGR to evaluate past performance, compare investment opportunities, and set realistic expectations, you can navigate the complex financial landscape with greater confidence. Whether you are managing a multi-million dollar corporate budget or a personal savings account, understanding the “how” and “why” of CAGR is a fundamental step toward long-term financial mastery.
aViewFromTheCave is a participant in the Amazon Services LLC Associates Program, an affiliate advertising program designed to provide a means for sites to earn advertising fees by advertising and linking to Amazon.com. Amazon, the Amazon logo, AmazonSupply, and the AmazonSupply logo are trademarks of Amazon.com, Inc. or its affiliates. As an Amazon Associate we earn affiliate commissions from qualifying purchases.