For nearly a decade, Tesla (TSLA) served as the undisputed crown jewel of the growth-investing world. Its meteoric rise from a niche electric vehicle (EV) manufacturer to a trillion-dollar behemoth redefined market expectations and minted a new generation of millionaires. However, the last two years have told a different story. As the macroeconomic landscape shifted from easy money to high interest rates, and as competition in the automotive sector intensified, Tesla’s valuation has faced a rigorous stress test. Understanding how much Tesla stock has dropped requires more than just looking at a price chart; it requires an analysis of market cycles, fundamental shifts in profitability, and the evolving psychology of the global investor.
Measuring the Drawdown: A Statistical Overview of Tesla’s Market Correction
To quantify the decline in Tesla’s stock, one must first identify the benchmark of its peak. In November 2021, Tesla reached an all-time high, with its market capitalization surging past the $1.2 trillion mark. At that point, the stock traded at a split-adjusted price of approximately $407 per share. Since that zenith, the stock has experienced several significant “drawdowns”—a term used in finance to describe the peak-to-trough decline during a specific period.
The Peak vs. the Current Reality
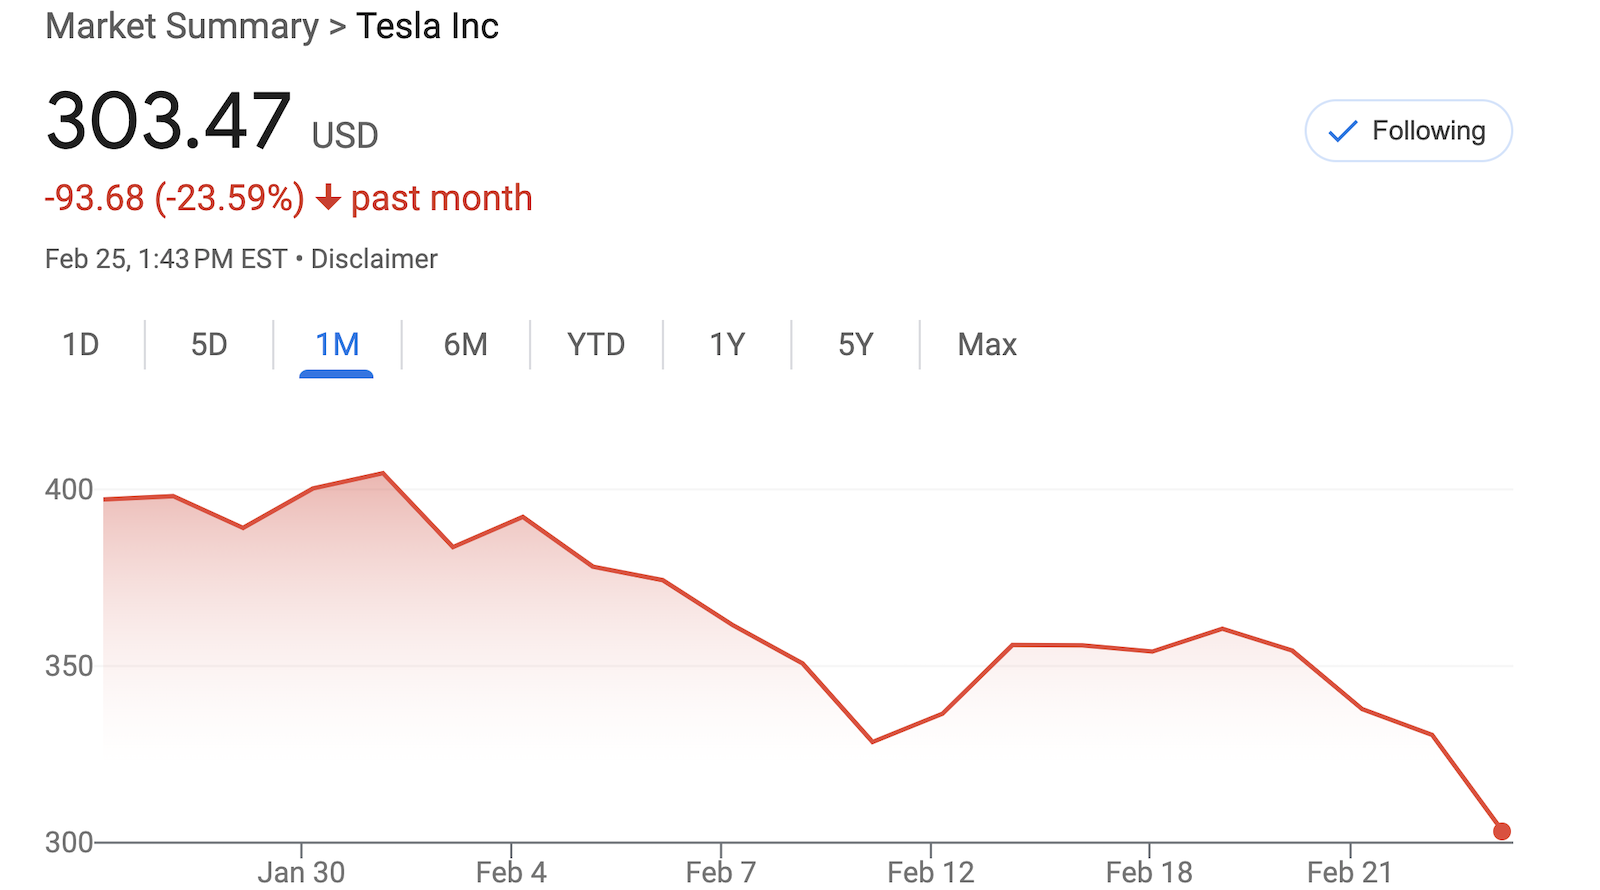
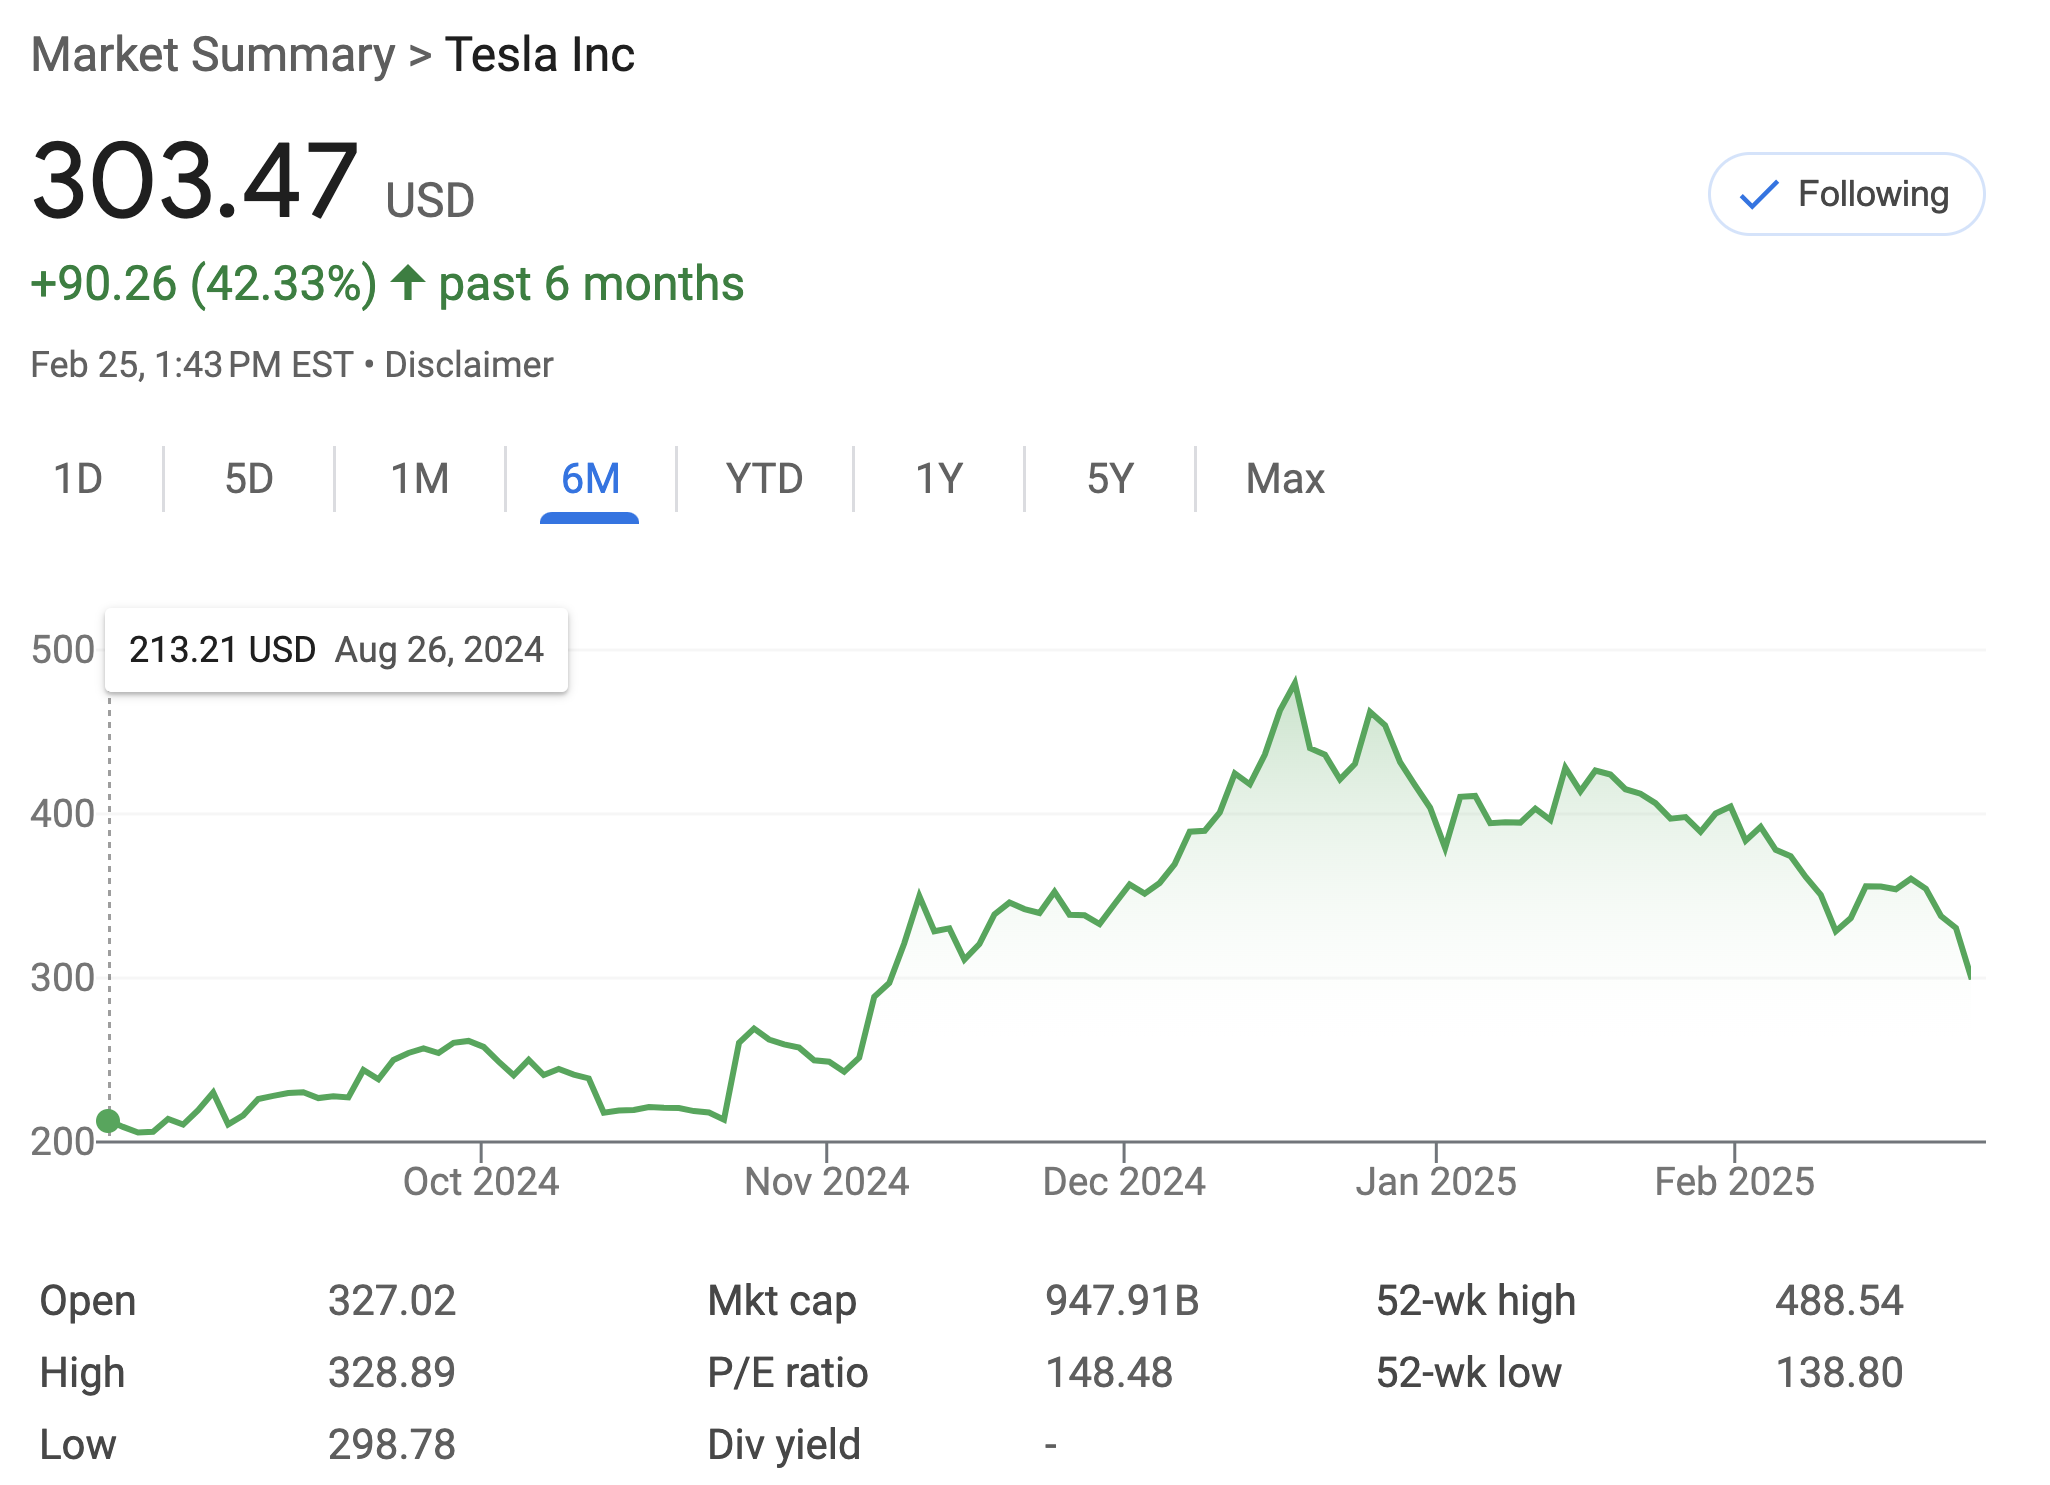
From its late-2021 highs to the lows seen in early 2023 and again in 2024, Tesla has seen its price per share fluctuate between $100 and $200. This represents a staggering drop of 50% to 75% from its absolute peak, depending on the specific trading day. While the stock has seen “relief rallies” where it gains 20% or 30% in a month, the long-term trend has been one of consolidation and correction. For investors who entered at the top, the “paper losses” have been significant, highlighting the inherent risks of high-beta growth stocks.
Comparison with the S&P 500 and the Nasdaq 100
Context is vital in investing. To understand if Tesla’s drop is an anomaly, we must compare it to the broader indices. During the 2022-2023 bear market, the tech-heavy Nasdaq 100 dropped roughly 33%, while the S&P 500 fell about 25% at its lowest point. Tesla’s drop of over 60% in that same period indicates that it was not merely a victim of a “bad market.” Instead, Tesla experienced an outsized correction. This suggests that the market was re-evaluating Tesla’s specific business model, moving it away from the “infinite growth” category and closer to the reality of a capital-intensive manufacturing business.
The Catalyst for the Decline: Why Investors Are Pulling Back
The stock market is a forward-looking mechanism. Stock prices do not drop because of what happened yesterday; they drop because of what investors fear will happen tomorrow. For Tesla, several fundamental factors converged to dampen the bullish sentiment that once drove its vertical ascent.
Narrowing Profit Margins and the Pricing War
Historically, Tesla boasted industry-leading gross margins that behaved more like a software company than a car company. While traditional automakers like Ford or GM struggled with 8% to 10% margins, Tesla was often hovering near 25% to 30%. This justified its high stock price.
However, as the EV market became saturated and consumer demand softened due to economic pressures, Tesla was forced to slash prices globally. While these price cuts helped maintain sales volume, they ate directly into the company’s bottom line. When margins began to contract toward the 15% to 17% range, the “Money” side of the equation changed. Investors realized that if Tesla earns less per car, the stock cannot sustain a premium valuation.
Interest Rates and the Cost of Capital
Tesla’s business is uniquely sensitive to interest rates for two reasons. First, the majority of consumers finance their vehicle purchases. When the Federal Reserve raised rates, the monthly payment for a Tesla Model 3 or Model Y increased by hundreds of dollars, even if the sticker price remained the same. This effectively reduced the addressable market.
Second, from an institutional investing perspective, higher interest rates make “future earnings” less valuable today. This is known as the Discounted Cash Flow (DCF) model. When “risk-free” assets like Treasury bonds offer 4% or 5% returns, investors are less willing to pay a high premium for a volatile stock like Tesla, leading to a natural contraction in its Price-to-Earnings (P/E) multiple.
Evaluating Valuation Metrics: Is Tesla Still an “Overvalued” Tech Stock?
The central debate in the financial world regarding Tesla is whether it should be valued as a car company or a technology company. Car companies typically trade at P/E ratios of 5x to 10x. Tech companies often trade at 30x to 50x. At its peak, Tesla’s P/E ratio was north of 200x. The recent drop in stock price has brought that figure down significantly, but it remains high compared to industry peers.
The Price-to-Earnings (P/E) Ratio Evolution
As of 2024, Tesla’s forward P/E ratio has fluctuated between 40x and 60x. While this is a massive “discount” compared to its 2021 levels, it is still triple the valuation of the average S&P 500 company. For a “Money” focused investor, the question is whether the growth rate justifies this premium. If Tesla’s annual delivery growth slows from 50% to 15% or 20%, a 50x P/E ratio becomes difficult to defend. The stock drop is essentially the market’s way of searching for a “fair value” in a world where hyper-growth is no longer guaranteed.
Cash Flow and Capital Expenditure Challenges
Tesla’s valuation is also tied to its ability to generate free cash flow (FCF). Building Gigafactories in Texas, Berlin, and potentially other locations requires billions of dollars in upfront capital expenditure (CapEx). When the stock price drops, the company’s “cost of equity” rises. While Tesla has a healthy balance sheet with significant cash reserves, the market has become wary of high CapEx requirements during a period of slowing revenue growth. Investors are now prioritizing “efficiency” over “expansion,” a shift that has contributed to the cooling of the stock price.
Future Outlook: Risk Management for the Modern Investor
For those looking at Tesla’s stock drop as a potential “buying the dip” opportunity, risk management is paramount. The volatility of the stock means that it can move 5% or 10% on a single piece of news, whether it’s an earnings miss or a regulatory update.
The Role of Delivery Growth in Long-term Gains
The primary metric that will determine if Tesla stock recovers to its former glory is “delivery growth.” The market has baked in the expectation that Tesla will eventually produce 20 million cars per year. If quarterly delivery numbers continue to miss expectations or show stagnant growth, the stock may see further “re-rating” to the downside. Investors must keep a close eye on inventory levels and “days of supply” to gauge whether the drop has reached a floor.

Strategic Diversification in a Volatile Market
The dramatic drop in Tesla stock serves as a masterclass in the importance of portfolio diversification. Even the most revolutionary companies can see their stock prices decimated by changing macroeconomic conditions. For a personal finance strategy, over-exposure to a single ticker—regardless of its past performance—can be catastrophic.
As Tesla transitions from a speculative growth play into a more mature industrial player, its stock behavior will likely become more tied to traditional fundamental metrics like earnings per share (EPS) and dividend potential (though a dividend remains far off). Investors who have weathered the 50%+ drop have learned that in the world of high-finance, “price is what you pay, but value is what you get.”
In conclusion, the drop in Tesla stock is not a single event but a complex recalibration. It is the result of a “perfect storm”: rising interest rates, narrowing margins, increased competition, and a shift in investor preference from “growth at any cost” to “profitable stability.” While the company remains a leader in the energy transition, its stock has been forced to descend from the stratosphere of hype back to the atmosphere of financial reality. For the astute investor, this drop is a reminder that even the most innovative brands must eventually answer to the cold, hard logic of the balance sheet.
aViewFromTheCave is a participant in the Amazon Services LLC Associates Program, an affiliate advertising program designed to provide a means for sites to earn advertising fees by advertising and linking to Amazon.com. Amazon, the Amazon logo, AmazonSupply, and the AmazonSupply logo are trademarks of Amazon.com, Inc. or its affiliates. As an Amazon Associate we earn affiliate commissions from qualifying purchases.