
In the world of finance, numbers are the primary language used to communicate value, risk, and opportunity. However, raw figures—such as a stock price increasing by $10 or a monthly revenue stream growing by $1,000—rarely tell the whole story. To truly understand the significance of these shifts, one must look at the relative change. This is where the computation of percentage change becomes an indispensable tool for investors, business owners, and individuals managing personal wealth.
Percentage change allows us to normalize data, providing a clear perspective on how much a value has grown or shrunk relative to its starting point. Whether you are tracking the volatility of a cryptocurrency portfolio, evaluating the year-over-year growth of a startup, or simply trying to outpace inflation with your savings, mastering this calculation is the first step toward sophisticated financial literacy.
The Fundamental Formula: The Mathematics of Growth and Decline
Before applying percentage change to complex financial models, it is essential to master the core mathematical framework. At its heart, percentage change measures the difference between an initial value and a final value, expressed as a fraction of the initial value.
The Standard Equation
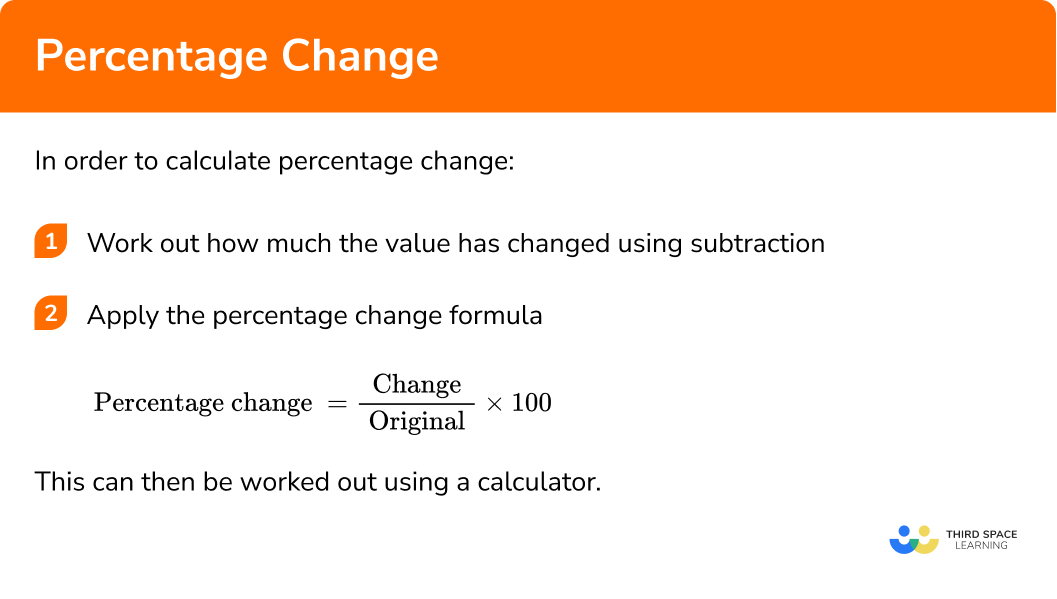
The formula for computing percentage change is straightforward but powerful:
Percentage Change = [(New Value – Old Value) / |Old Value|] × 100
To use this formula, you first subtract the original value (the “Old Value”) from the current value (the “New Value”). This result represents the absolute change. You then divide that absolute change by the original value to determine the rate of change. Finally, multiplying by 100 converts that decimal into a percentage.
For example, if you purchased a share of a tech company for $150 and it is now trading at $180, the calculation would be:
($180 – $150) / $150 = 0.20.
Multiplying by 100 gives you a 20% increase.
Interpreting Positive vs. Negative Change
The direction of the percentage change is just as important as the magnitude. A positive result indicates growth or an increase in value, commonly referred to as a “gain” in financial contexts. Conversely, a negative result indicates a decrease, known as a “loss” or “drawdown.”
In business finance, a negative percentage change in expenses is often a sign of improved operational efficiency. However, in investing, a negative percentage change in asset value requires a nuanced understanding of “loss recovery.” Mathematically, losses are harder to recover from than gains are to achieve. If an investment drops by 50%, it requires a 100% gain just to return to the original break-even point. Understanding this asymmetry is crucial for risk management.
Percentage Change in Personal Finance and Wealth Management
For the individual, percentage change is the primary metric used to gauge the health of a personal budget and the progress of long-term wealth-building strategies. It shifts the focus from “how much do I have?” to “how fast am I moving toward my goals?”
Tracking Income Growth and Expense Fluctuations
In personal budgeting, monitoring the percentage change of your various line items helps identify lifestyle creep and inflationary pressures. If your salary increases by 5% year-over-year, but your housing and grocery expenses increase by 8%, your “real” purchasing power is actually shrinking despite the higher nominal income.
By computing the percentage change of your discretionary spending month-over-month, you can pinpoint exactly where your budget is leaking. For instance, a 15% increase in “dining out” expenses might seem negligible in dollar terms, but when viewed as a percentage, it signals a trend that could derail your savings goals if left unchecked.
Evaluating Debt Reduction and Net Worth Progress
Percentage change is also a motivational tool when managing debt. While seeing a $50,000 student loan balance can be daunting, calculating the percentage decrease in that balance over six months provides a tangible sense of momentum.
Similarly, tracking the percentage change of your total net worth (assets minus liabilities) is the ultimate “high-level” view of financial health. Financial planners often suggest that a consistent positive percentage growth in net worth is a better indicator of future financial independence than a high salary alone.
Investing and Market Analysis: The Power of ROI

In the realm of investing, percentage change is most frequently encountered as “Return on Investment” (ROI). It is the universal metric that allows investors to compare apples to oranges—such as comparing the performance of a real estate holding to a portfolio of blue-chip stocks.
Calculating Stock Performance and Volatility
Investors use percentage change to assess the performance of individual assets over specific timeframes: Daily, Year-to-Date (YTD), or over a multi-year period. However, it is also the primary measure of volatility.
High percentage changes (swings) in a short period indicate high volatility, which typically correlates with higher risk. Professional traders use “percentage price oscillators” and other technical tools to determine if a stock’s percentage move is an outlier or part of a sustainable trend. Understanding these percentages helps an investor decide whether to “rebalance” their portfolio—selling assets that have grown significantly (positive percentage change) to buy those that are undervalued.
Understanding Compounding and Cumulative Change
One of the most important concepts in money management is the difference between simple percentage change and cumulative (compounded) change. If an investment grows by 10% in Year 1 and 10% in Year 2, the total growth is not 20%—it is 21%.
This happens because the 10% gain in the second year applies to the new, higher base established at the end of the first year. This “growth on growth” is the engine of wealth creation. By computing the Compound Annual Growth Rate (CAGR), investors can determine the mean annual growth rate of an investment over a period longer than one year, providing a smoothed-out view of performance that accounts for the effects of compounding.
Business Finance: Monitoring Health and Scalability
For entrepreneurs and corporate executives, percentage change serves as a Key Performance Indicator (KPI) that signals the scalability and sustainability of a business model. It allows stakeholders to look past seasonal fluctuations and see the underlying trajectory of the company.
Revenue Growth vs. Profit Margins
A business may report a 20% increase in gross revenue, which sounds like a success. However, if the “Cost of Goods Sold” (COGS) has seen a 30% percentage increase in the same period, the company’s profit margins are actually being compressed.
Computing the percentage change of margins—Gross Margin, Operating Margin, and Net Margin—is vital for understanding internal efficiency. If your revenue stays flat but you manage to decrease operating expenses by 5%, your bottom-line profit increases. In the eyes of an investor or a lender, a company that can consistently improve its margins through percentage-based cost control is often more attractive than one with high but erratic revenue growth.
Customer Acquisition Cost (CAC) and Lifetime Value (LTV)
In the modern digital economy, the relationship between the cost to acquire a customer and the value that customer brings is measured through percentage trends. If the percentage change in Customer Acquisition Cost (CAC) is rising faster than the percentage change in Customer Lifetime Value (LTV), the business model may eventually become unsustainable. By monitoring these percentages quarterly, managers can pivot their marketing strategies before the business enters a financial deficit.
Common Pitfalls and Advanced Considerations in Financial Math
While the formula for percentage change is mathematically simple, the interpretation of the results requires a sophisticated understanding of financial context. There are several traps that can lead to poor decision-making if one relies solely on the raw percentage.
The Base Effect: Small Numbers vs. Large Numbers
One of the most common distortions in financial reporting is the “Base Effect.” A small startup increasing its revenue from $10,000 to $20,000 shows a 100% increase. An established corporation increasing its revenue from $1 billion to $1.1 billion shows only a 10% increase.
While the startup has a higher percentage change, the corporation has generated vastly more absolute wealth. In your personal finances, a 50% gain on a $100 investment is only $50, whereas a 5% gain on a $100,000 retirement account is $5,000. It is vital to always consider the “base” or the principal amount when evaluating the impact of a percentage change.
Inflation-Adjusted (Real) vs. Nominal Change
In an era of fluctuating currency value, computing “nominal” percentage change can be misleading. Nominal change is the change in the numerical value of money, while “real” change accounts for inflation (purchasing power).
If your investment portfolio grew by 7% last year, but inflation was 9%, your “real” percentage change was -2%. In other words, you have more dollars, but those dollars buy fewer goods and services than your initial investment did a year ago. To truly master the computation of percentage change in a financial niche, one must always subtract the inflation rate from the nominal return to find the real rate of growth.
In conclusion, computing percentage change is far more than a middle-school math exercise; it is the cornerstone of strategic financial analysis. By applying this simple formula to personal budgets, investment portfolios, and business operations, you gain the ability to strip away the noise of raw data and see the true trends that define your financial future. Whether you are aiming for aggressive growth or capital preservation, the percentage change is the compass that keeps your financial journey on course.
aViewFromTheCave is a participant in the Amazon Services LLC Associates Program, an affiliate advertising program designed to provide a means for sites to earn advertising fees by advertising and linking to Amazon.com. Amazon, the Amazon logo, AmazonSupply, and the AmazonSupply logo are trademarks of Amazon.com, Inc. or its affiliates. As an Amazon Associate we earn affiliate commissions from qualifying purchases.