
In the world of finance, time is more than just a measurement; it is a fundamental variable in every equation. Whether you are calculating the annualized return of a stock, determining the time decay of an options contract, or programming a high-frequency trading algorithm, knowing exactly how much time you have to execute trades is paramount. While a standard calendar year contains 365 days (or 366 in a leap year), the financial markets operate on a much tighter schedule.
For the modern investor, the question “How many trading days are in a year?” usually yields a standard answer: 252. However, the nuances behind this number—and why it fluctuates—are essential for professional-grade financial planning and portfolio management.
Understanding the Standard Trading Calendar (252 Days)
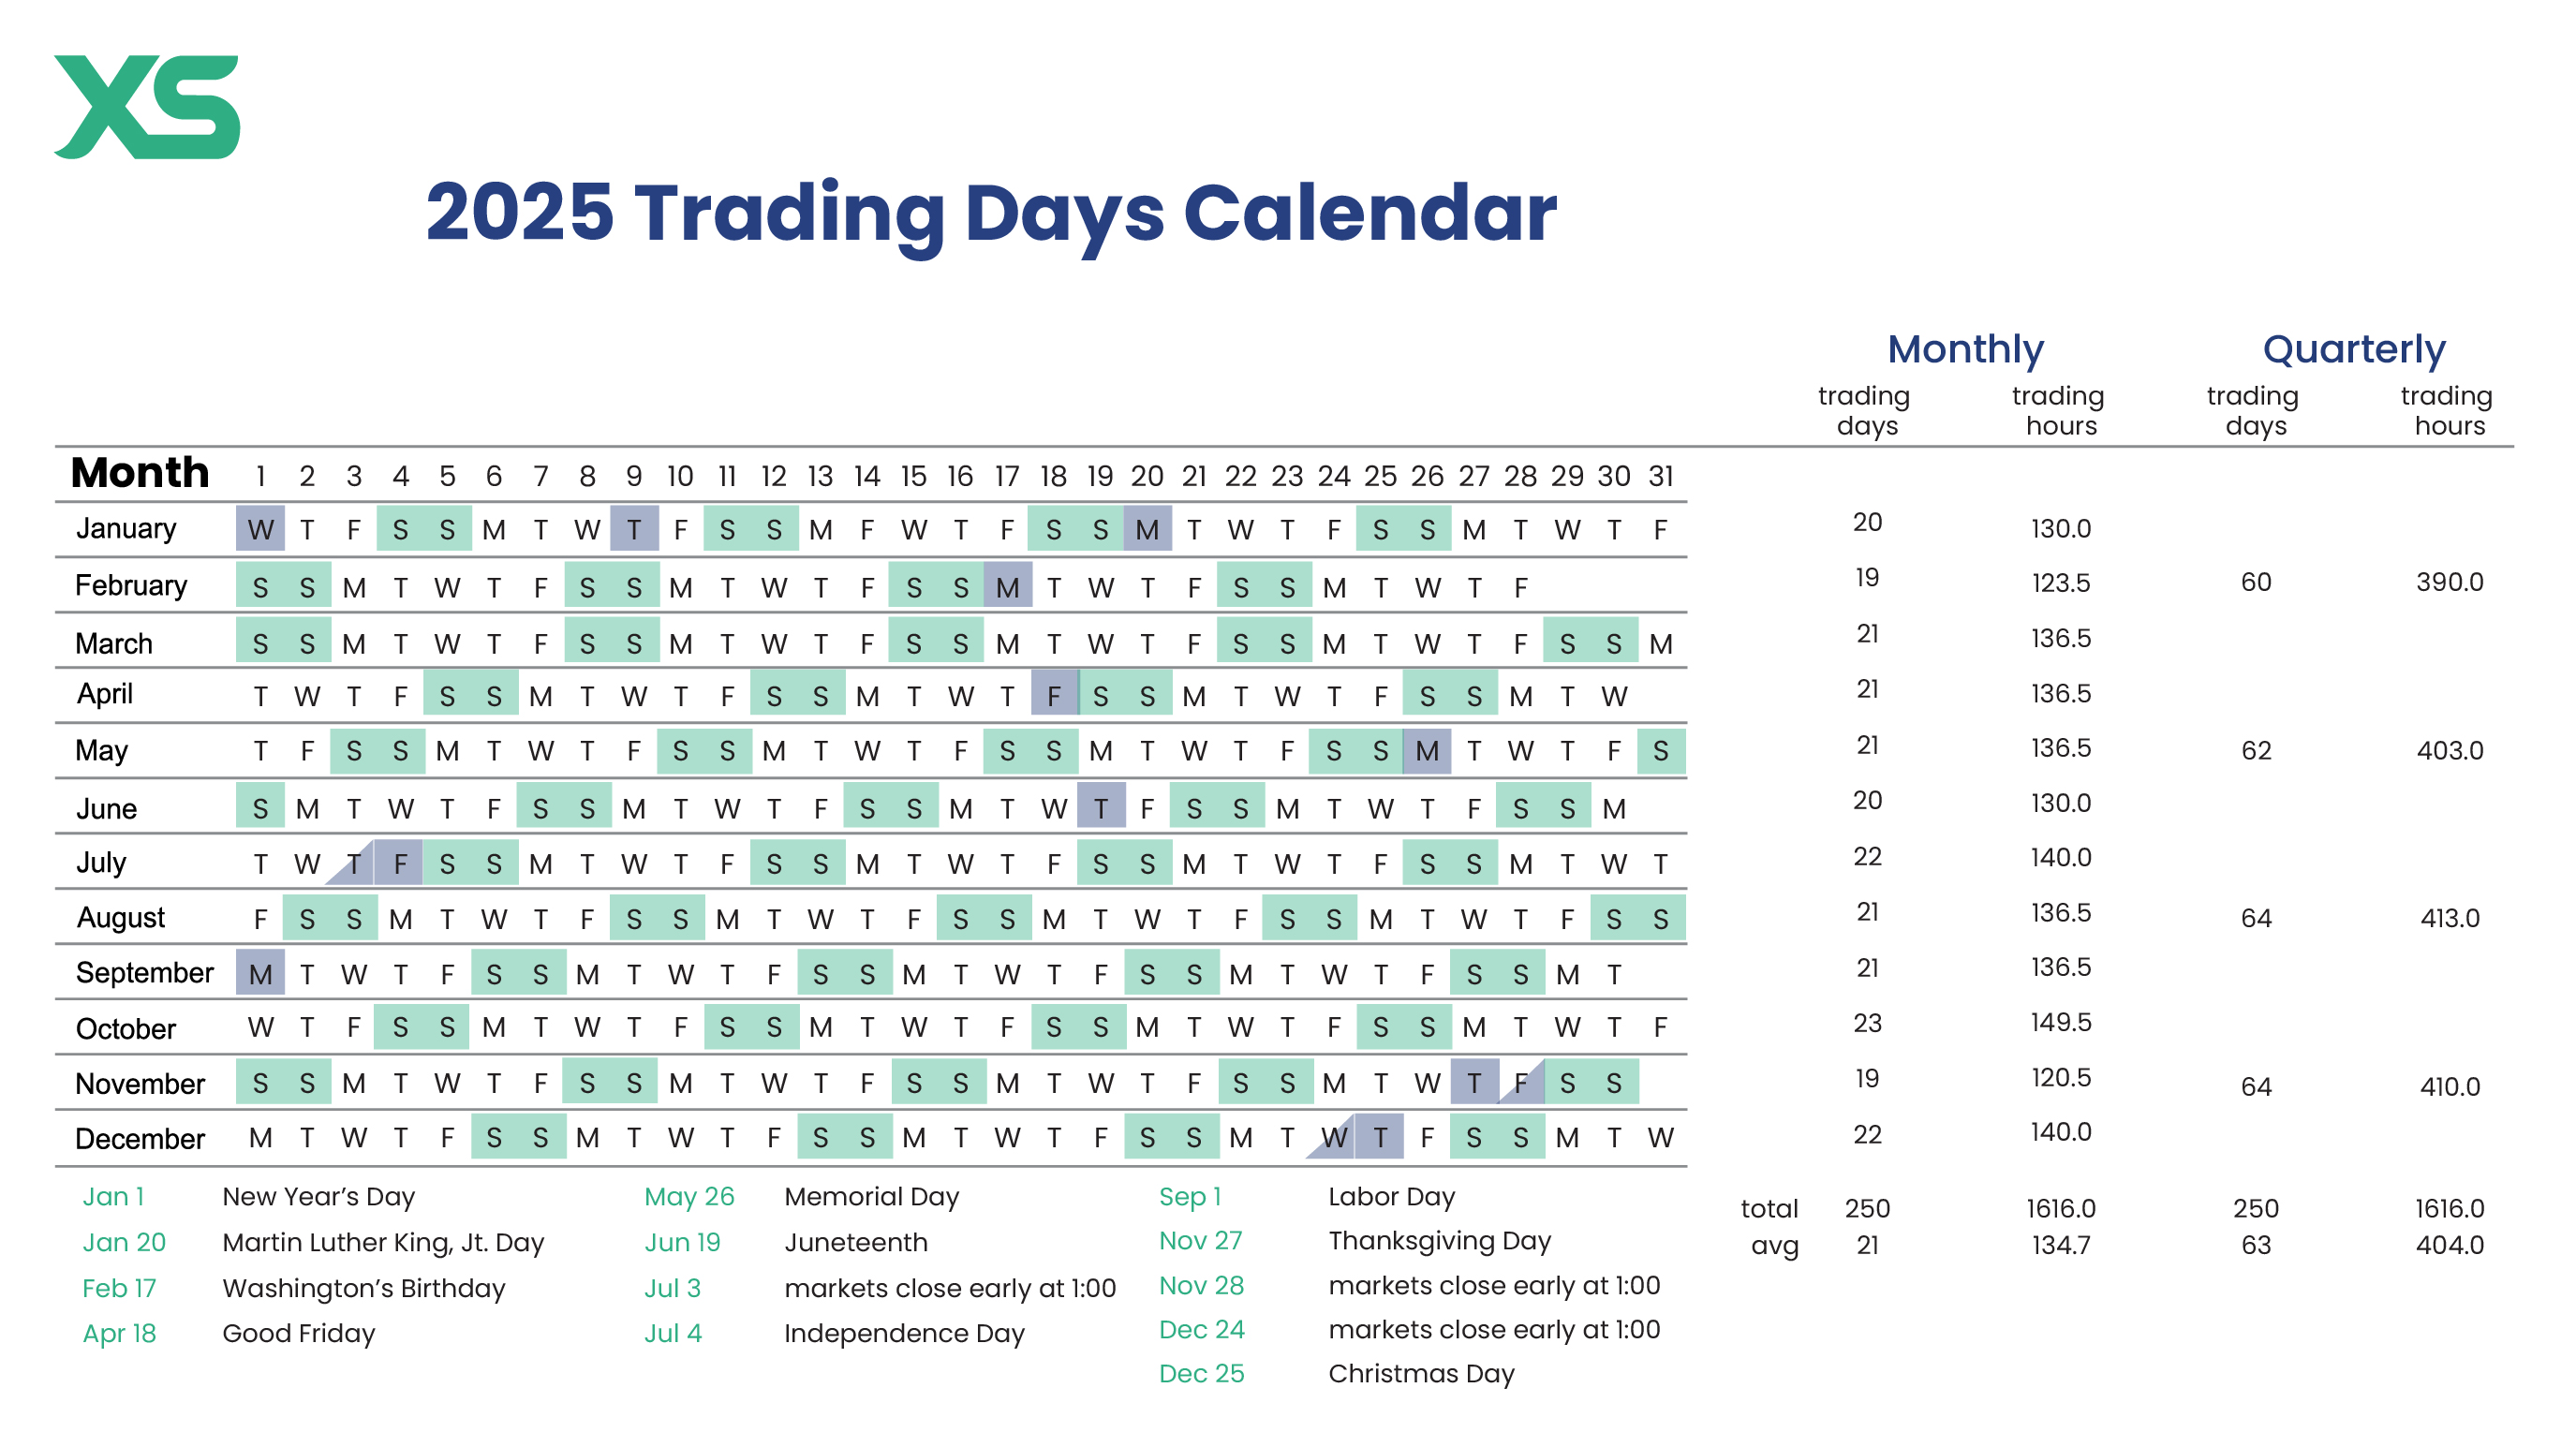
To arrive at the figure of 252 trading days, one must strip away the layers of the Gregorian calendar to find the “active” heart of the financial system. For most major exchanges, particularly the New York Stock Exchange (NYSE) and the NASDAQ, the market is closed on weekends and specific public holidays.
The Math Behind the Number
A standard year consists of 52 weeks plus one or two extra days. Since every week contains two weekend days (Saturday and Sunday), we immediately subtract 104 days from the 365-day total, leaving us with 261 potential working days. From this subtotal, we subtract the observed market holidays. In the United States, there are typically nine or ten scheduled market holidays.
When you subtract these holidays from the 261 business days, you arrive at the industry-standard figure of 252 trading days. This number is widely used by quantitative analysts and hedge fund managers as the denominator for calculating daily volatility and “scaling” returns to an annual basis.
The Nuance of Leap Years and Calendar Drift
It is important to note that 252 is an average, not a constant. Depending on how the calendar falls, a year might occasionally have 251 or 253 trading days. For instance, if a major holiday falls on a weekend, it is usually “observed” on the closest Friday or Monday. If a leap year adds an extra day that happens to fall on a weekday, the count might increase. For long-term financial modeling, however, 252 remains the gold standard for statistical consistency.
Market Holidays and the “Observed” Rule
The primary reason the trading calendar deviates from a standard business calendar is the observance of federal and exchange-specific holidays. In the United States, the Securities Industry and Financial Markets Association (SIFMA) and the major exchanges coordinate these closures to ensure liquidity and stability.
Major U.S. Stock Exchange Holidays
The U.S. markets typically close for the following holidays:
- New Year’s Day
- Martin Luther King, Jr. Day
- Presidents’ Day
- Good Friday (Note: This is a market holiday but not a federal holiday)
- Memorial Day
- Juneteenth National Independence Day
- Independence Day (July 4th)
- Labor Day
- Thanksgiving Day
- Christmas Day
If a holiday falls on a Saturday, the market usually closes on the preceding Friday. If it falls on a Sunday, the market closes on the following Monday. This ensures that the labor force powering the financial infrastructure—from floor traders to clearinghouse technicians—receives the intended break.
Partial Trading Days and Early Closures
Beyond full closures, investors must also account for “early sessions.” Traditionally, the day after Thanksgiving (Black Friday) and Christmas Eve (if it falls on a weekday) see the markets close at 1:00 PM ET rather than the standard 4:00 PM ET. While these are technically counted as full trading days in many statistical models, the significantly reduced volume and liquidity during these sessions can lead to erratic price movements, often referred to as “thin trading.”
Why the Number of Trading Days Matters for Your Portfolio
Knowing the number of trading days is not merely a trivia exercise; it is a functional necessity for anyone serious about personal finance and investing. The distinction between “calendar days” and “trading days” changes the way we interpret growth and risk.
Calculating Annualized Volatility and Returns
Professional investors rarely look at a stock’s performance in a vacuum. They want to know the “annualized” return. If a stock gains 2% over 10 trading days, an investor needs to know how that would project over the 252-day trading year to compare it to other assets.
Similarly, volatility is measured by the standard deviation of daily returns. To convert daily volatility into annual volatility (the “Vol” used in risk assessments), mathematicians multiply the daily standard deviation by the square root of the number of trading days (√252). If you use 365 instead of 252 in this equation, your risk assessment will be fundamentally flawed, potentially leading to over-leveraged positions.
The Impact on Options Pricing and Time Decay
For those who trade derivatives, the trading calendar is vital because of “Theta.” Theta represents the rate at which an option’s value declines as it approaches expiration. While some Greeks are calculated using calendar days (because time passes even when the market is closed), the realized volatility that drives the option’s “intrinsic value” only happens during trading hours. Professional option traders must constantly adjust their models to account for “three-day weekends,” where the decay might accelerate or the “opening gap” on Monday might pose a significant risk.
Global Variations: Trading Days Around the World
While 252 is the benchmark for the U.S. markets, the globalized nature of modern finance means that your capital might be working in different time zones with different rules.
International Exchange Differences
Different countries have different cultural and religious holidays that dictate their trading calendars. For example, the London Stock Exchange (LSE) observes “Bank Holidays” that do not align with U.S. federal holidays, such as Boxing Day (December 26th). In the Middle East, exchanges like the Tadawul in Saudi Arabia traditionally operated on a Sunday-through-Thursday schedule to align with Islamic prayer days, though many are shifting toward a Monday-Friday schedule to better integrate with global markets.
Cultural and Religious Holiday Impacts
The number of trading days can vary significantly in Asian markets. During the Lunar New Year, the Hong Kong Stock Exchange and the Shanghai Stock Exchange may close for several consecutive days. Similarly, Japan’s “Golden Week” can shut down the Tokyo Stock Exchange for a significant stretch. For a global macro investor, these discrepancies create “liquidity holes”—periods where you cannot easily exit a position in one country even if the rest of the world is trading.
Strategic Planning for the Trading Year
Understanding the rhythm of the trading year allows an investor to move from a reactive stance to a proactive one. When you know how many days you have to work with, you can better manage your cash flow and expectations.
Managing Liquidity During Low-Volume Periods
History shows that trading volume is not distributed evenly across the 252 days. The “summer doldrums” (late July through August) and the period between Christmas and New Year’s often see lower participation. During these times, the bid-ask spread—the difference between what a buyer will pay and a seller will accept—often widens. By recognizing these low-volume windows within the trading calendar, investors can avoid executing large trades that might result in “slippage,” where the price moves against them due to a lack of participants.

Tools for Tracking Market Hours
In the digital age, manual tracking of the 252-day calendar is rarely necessary, but verification is. Most high-end financial tools, such as Bloomberg Terminals or Morningstar Direct, allow users to toggle between calendar-day and business-day views. For the retail investor, most brokerage apps provide a “Market Status” notification. However, the most successful investors maintain their own “Financial Calendar,” marking dividend dates, earnings releases, and FOMC (Federal Open Market Committee) meetings alongside the 252 trading days to ensure they are never caught off guard by a market closure.
In conclusion, while 365 days dictate our lives, 252 days dictate our wealth. By mastering the nuances of the trading year, investors can more accurately calculate risk, project future returns, and understand the deep mechanics of the global financial machine. Whether you are a long-term “buy and hold” investor or a day trader, the trading calendar is the canvas upon which your financial strategy is painted.
aViewFromTheCave is a participant in the Amazon Services LLC Associates Program, an affiliate advertising program designed to provide a means for sites to earn advertising fees by advertising and linking to Amazon.com. Amazon, the Amazon logo, AmazonSupply, and the AmazonSupply logo are trademarks of Amazon.com, Inc. or its affiliates. As an Amazon Associate we earn affiliate commissions from qualifying purchases.