
The S&P 500 is more than just a number on a ticker; it is the definitive barometer of the American economy and the primary benchmark for global equity markets. When investors ask, “What is the S&P 500 trading at?” they are rarely looking for just the current price. Instead, they are seeking to understand the valuation, the momentum, and the underlying economic forces that drive the index. Understanding where the index stands today requires a multifaceted analysis of earnings, interest rates, and the concentrated influence of the world’s largest technology firms.
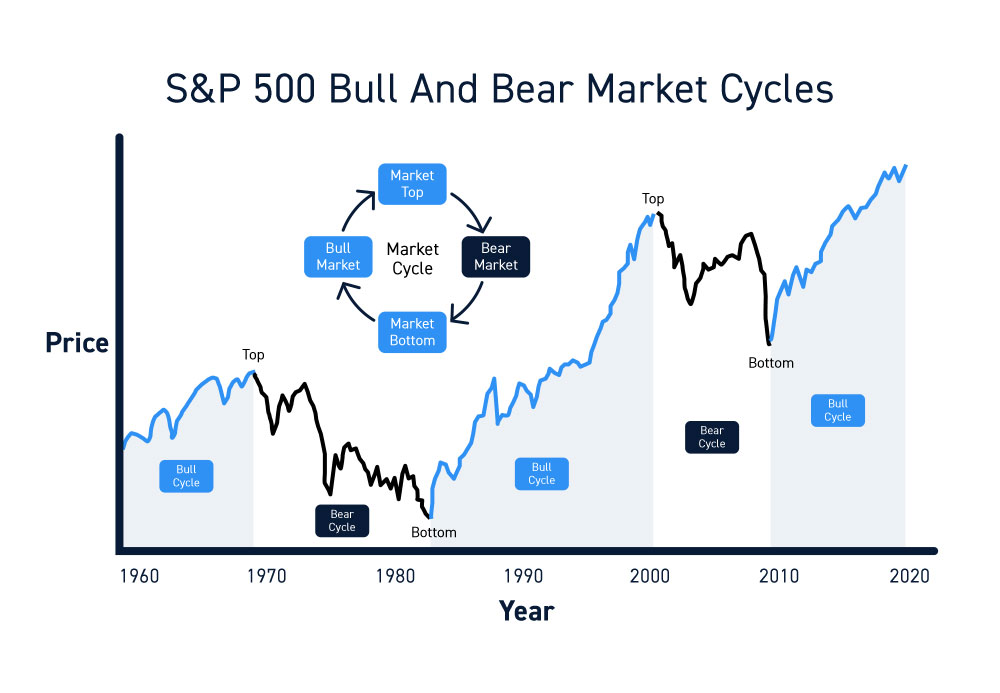
As of the current market cycle, the S&P 500 remains a focal point for institutional and retail investors alike. Its performance dictates the health of 401(k)s, pension funds, and the broader consumer confidence that fuels the U.S. economy. However, the price level alone tells only half the story. To truly grasp the current state of the market, one must look beneath the surface at the fundamental metrics that define whether the index is “expensive,” “cheap,” or “fairly valued.”
Understanding the Current Valuation Framework
Valuation is the cornerstone of disciplined investing. When we look at where the S&P 500 is trading, the most common metric used is the Price-to-Earnings (P/E) ratio. This ratio tells us how much investors are willing to pay for every dollar of the companies’ collective earnings. Historically, the S&P 500 has traded at a forward P/E ratio of approximately 16 to 18. In recent periods of technological expansion and low interest rates, this figure has often stretched toward 20 or even 25.
The Divergence Between Trailing and Forward P/E
The trailing P/E ratio looks at the earnings over the past twelve months, providing a snapshot of reality. The forward P/E, however, is based on analyst projections for the coming year. Currently, the forward P/E often trades at a premium compared to historical norms. This suggests that the market is pricing in significant future growth, particularly in the technology and artificial intelligence sectors. When the index trades at high multiples, it leaves less room for error; if earnings reports fail to meet high expectations, the index can experience sharp corrections as the multiple contracts.
The Shiller PE (CAPE Ratio) Perspective
For a more long-term view, many analysts turn to the Cyclically Adjusted Price-to-Earnings (CAPE) ratio, also known as the Shiller PE. This metric adjusts earnings for inflation over a ten-year period to smooth out short-term economic fluctuations. Historically, a high CAPE ratio has been a precursor to lower long-term returns, though it is a poor timing tool for short-term trades. If the S&P 500 is trading at a CAPE ratio significantly above its long-term average of 17, it signals that the market is in a “rich” valuation territory, driven by high liquidity and investor optimism.
The Impact of Mega-Cap Concentration
It is impossible to discuss the S&P 500’s current price without addressing the “Magnificent Seven”—the group of high-growth tech stocks that dominate the index’s market-cap-weighted structure. Because companies like Apple, Microsoft, NVIDIA, and Alphabet hold such massive weightings, the “price” of the S&P 500 is often a reflection of the tech sector’s health rather than the broader economy. If these few stocks trade at high multiples, they can drag the entire index’s valuation higher, even if the other 493 stocks are trading at more modest valuations. This has led many investors to look at the S&P 500 Equal Weight Index to determine if the market rally is broad-based or dangerously concentrated.
Macroeconomic Drivers of Price Action
The level at which the S&P 500 trades is inextricably linked to the macroeconomic environment, specifically the interplay between inflation, interest rates, and Federal Reserve policy. In the modern era, the “Fed pivot” or the “higher for longer” narrative has become the primary catalyst for daily price movements.
The Role of Interest Rates and the Discount Rate
Interest rates are the “gravity” of the financial markets. When interest rates rise, the present value of future cash flows decreases. This is particularly impactful for growth stocks that make up a large portion of the S&P 500. When the 10-year Treasury yield climbs, the S&P 500 often faces downward pressure as investors demand a higher risk premium for holding equities over “risk-free” government bonds. Conversely, when the market perceives that the Federal Reserve is nearing the end of a tightening cycle, the index often trades at higher levels in anticipation of a more favorable borrowing environment.
Corporate Earnings Resilience
While macro factors set the stage, corporate earnings are the ultimate driver of the S&P 500’s price over the long term. Despite periods of high inflation and supply chain disruptions, S&P 500 companies have historically shown a remarkable ability to maintain profit margins through cost-cutting and pricing power. When the index is trading at or near all-time highs, it is usually because corporate America is delivering record-breaking profits. Investors watch the “earnings season” closely; a “beat and raise” from key components can propel the index higher regardless of the prevailing interest rate environment.

Inflation and Real vs. Nominal Returns
It is also essential to distinguish between the nominal price of the S&P 500 and its real, inflation-adjusted value. In periods of high inflation, the nominal price of the index may rise simply because the dollars used to value the companies are worth less. However, equities are generally considered a good long-term inflation hedge because companies can raise prices for their goods and services, eventually leading to higher nominal earnings and a higher index price.
Technical Analysis and Market Sentiment
Beyond fundamentals, the S&P 500 is heavily influenced by technical levels and the collective psychology of the market. Technical analysis provides a roadmap for where the index might find support or encounter resistance.
Key Moving Averages
Institutional traders often look at the 50-day and 200-day simple moving averages (SMAs) to determine the index’s trend. If the S&P 500 is trading above its 200-day SMA, the long-term trend is considered bullish. If it dips below, it may signal a transition into a bear market. The “Golden Cross”—where the 50-day SMA crosses above the 200-day—is often seen as a major buy signal, while the “Death Cross” suggests further downside. Tracking where the index is relative to these levels helps investors understand if the current price is a breakout or a temporary deviation.
Sentiment Indicators and the VIX
The CBOE Volatility Index, or VIX, is often called the “fear gauge.” It measures the market’s expectation of 30-day volatility based on S&P 500 options. When the S&P 500 is trading at highs with a low VIX, it suggests investor complacency. Conversely, a high VIX accompanied by a falling S&P 500 indicates panic and potential overselling. Smart money often looks for “extremes” in sentiment—such as the Fear & Greed Index reaching “Extreme Greed”—as a sign that the index may be due for a mean-reversion event.
Psychological Support and Resistance
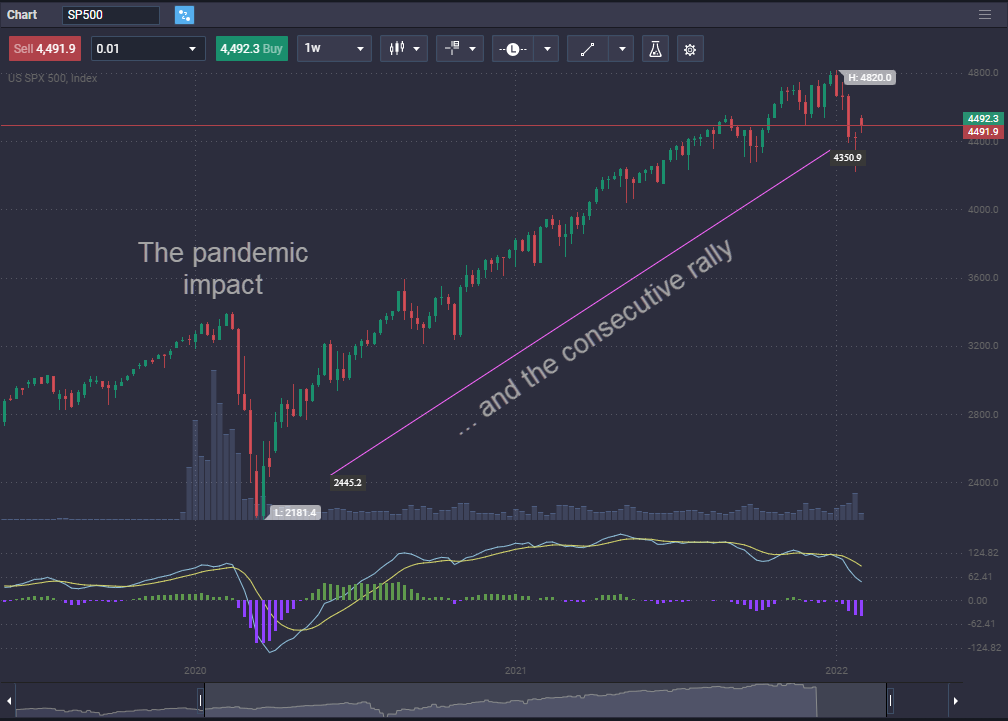
The S&P 500 often reacts to “round numbers.” Levels like 4,000, 5,000, or 6,000 act as psychological barriers. When the index approaches these milestones, trading volume often increases as market participants struggle with the “new reality” of that valuation. Breaking through a major round number often leads to a “melt-up” as sidelined capital rushes in for fear of missing out (FOMO).
Strategic Implications for the Individual Investor
Knowing what the S&P 500 is trading at is only useful if it informs a sound investment strategy. For most individuals, the index represents the core of their wealth-building engine.
The Power of Dollar-Cost Averaging
Because the S&P 500 is prone to volatility, attempting to time the “perfect” entry price is often a losing game. Dollar-cost averaging (DCA)—investing a fixed amount at regular intervals—allows investors to buy more shares when the index is trading low and fewer shares when it is trading high. This strategy effectively removes the emotional burden of tracking the daily fluctuations of the index and relies on the historical upward trajectory of the U.S. stock market.
Rebalancing in High-Valuation Environments
When the S&P 500 trades at extreme highs, it can lead to a portfolio becoming “top-heavy” in equities. If your target allocation is 70% stocks and 30% bonds, a major rally in the S&P 500 might push your equity exposure to 80%. Professional financial management dictates rebalancing—selling a portion of the S&P 500 gains to buy underperforming assets like bonds or international stocks. This disciplined approach ensures that you “sell high” and maintain a risk profile that aligns with your long-term goals.
Understanding the Risks of “Index Hugging”
While the S&P 500 is a diversified index, its market-cap weighting means that it is not as diversified as it once was. Investors should be aware that when they buy an S&P 500 index fund today, they are heavily betting on the continued dominance of the tech sector. To mitigate this risk, some investors choose to complement their S&P 500 holdings with small-cap stocks, mid-cap stocks, or international equities, which may trade at different valuation cycles and offer a buffer when the large-cap U.S. market faces a downturn.
The question of what the S&P 500 is trading at is a gateway to a deeper understanding of the global financial landscape. By looking at P/E ratios, Federal Reserve policy, technical indicators, and sector concentration, investors can move beyond the “headline number” and make informed decisions. Whether the index is at an all-time high or in the depths of a correction, the S&P 500 remains the most critical instrument for tracking the health of corporate profits and the collective optimism of the investing world. Over the long term, the index has rewarded those who look past the daily noise and focus on the fundamental growth of the world’s most successful companies.
aViewFromTheCave is a participant in the Amazon Services LLC Associates Program, an affiliate advertising program designed to provide a means for sites to earn advertising fees by advertising and linking to Amazon.com. Amazon, the Amazon logo, AmazonSupply, and the AmazonSupply logo are trademarks of Amazon.com, Inc. or its affiliates. As an Amazon Associate we earn affiliate commissions from qualifying purchases.