
In the vast and interconnected world of technology, data is the new currency. From intricate AI algorithms to streamlined software applications and robust digital security systems, every facet relies on the ability to understand, process, and interpret information. At the heart of this interpretation lies foundational mathematical concepts, often overlooked but undeniably critical. One such concept is the “range”—a term whose simple definition belies its profound utility across the entire tech spectrum.
While “range” might sound like a relic from a high school math class, its true power emerges when applied to the complex datasets and dynamic systems that define our digital age. Understanding the range of a dataset provides immediate insights into its spread, variability, and potential outliers, offering a crucial starting point for deeper analysis in fields like data science, machine learning, software development, and cybersecurity. For anyone navigating the ever-evolving tech landscape, a firm grasp of what range means in mathematics is not just academic trivia; it’s a vital tool for making informed decisions, optimizing performance, and building more resilient and intelligent systems.
This article delves into the mathematical definition of range, then meticulously unpacks its indispensable role and diverse applications within the technology sector. We’ll explore how this fundamental concept underpins everything from data exploration to algorithm evaluation, offering a professional, insightful, and engaging perspective on a seemingly simple but incredibly powerful mathematical tool.
The Core Concept: Defining Mathematical Range
At its most fundamental level, the definition of range in mathematics is straightforward: it’s a measure of the spread or dispersion of a set of data. However, its interpretation can vary slightly depending on the specific mathematical context, though the underlying principle remains consistent.
Understanding Basic Statistical Range (Max – Min)
In statistics, particularly descriptive statistics, the range is the simplest measure of variability. It quantifies the difference between the highest and lowest values in a given dataset.
Formula:
Range = Maximum Value – Minimum Value
Example:
Consider a dataset representing the daily active users (in thousands) of a new mobile application over a week: [120, 150, 110, 180, 130, 160, 170].
-
Maximum Value = 180
-
Minimum Value = 110
-
Range = 180 – 110 = 70
A range of 70 indicates that the spread between the lowest and highest daily active users is 70,000. This immediate insight tells a developer or product manager about the volatility or consistency of user engagement. A large range might suggest inconsistency or rapid growth/decline, while a smaller range points to more stable user numbers.
Range in Different Mathematical Contexts (Functions, Data Sets, Intervals)
While the maximum-minus-minimum definition is most common in statistics, the concept of “range” also appears in other mathematical domains:
-
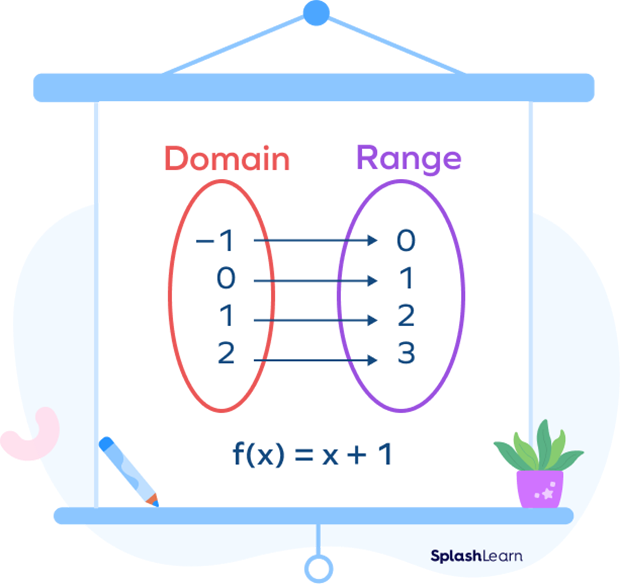
In Set Theory/Functions: When discussing functions, the “range” refers to the set of all possible output values (y-values) that a function can produce for a given set of input values (domain). For example, for the function f(x) = x², if the domain is all real numbers, the range is all non-negative real numbers [0, ∞), because squaring any real number will result in a non-negative number. In a tech context, this might apply to the possible output values of an algorithm or the potential states of a system.
-
In Intervals: An interval in mathematics describes a set of real numbers between two specified numbers. For instance, [0, 100] is an interval representing all numbers from 0 to 100, inclusive. While not explicitly called “range” in this context, the “length” of the interval (100 – 0 = 100) directly corresponds to the statistical range concept. This is crucial for defining acceptable parameters or thresholds in software configurations or sensor readings.
Regardless of the specific context, the underlying idea is about defining boundaries or the extent of possible values, making it an incredibly versatile concept for the analytical demands of the technology sector.
Why Range is Indispensable in Tech Analytics
The seemingly simple mathematical range transforms into a powerful analytical tool when applied to the complex data streams and operational dynamics of the tech world. Its utility spans various sub-disciplines, providing immediate, actionable insights.
Data Exploration and Anomaly Detection
For data scientists and analysts, calculating the range is often one of the first steps in exploratory data analysis (EDA). Before diving into complex models, understanding the basic spread of data reveals critical information. A very large range might indicate significant variability or, more importantly, the presence of outliers—data points that are unusually far from other data points.
In anomaly detection, which is crucial for fraud detection, system health monitoring, and cybersecurity, identifying values outside an expected range can flag potential issues. If the normal range of CPU usage for a server is 20-80%, a reading of 5% or 95% immediately signals a potential problem (underutilization or overload), prompting further investigation.
Performance Metrics and System Monitoring
Software engineers and operations teams constantly monitor system performance. Range helps define the expected boundaries of various metrics:
-
Response Times: The range of response times for an API endpoint helps determine its consistency. A wide range could indicate intermittent performance issues.
-
Throughput: The range of transactions processed per second by a database can reveal peak loads and idle periods, aiding resource allocation.
-
Error Rates: While ideal error rates are near zero, the range of observed error rates over time helps establish baselines and detect anomalous spikes.
Understanding these ranges allows teams to set appropriate alerts, optimize resource allocation, and ensure systems operate within desired parameters, directly impacting user experience and service reliability.

Machine Learning and Model Evaluation
In machine learning, understanding the range of features in a dataset is vital for preprocessing steps like normalization or standardization. Algorithms often perform better when input features are scaled within a consistent range.
Furthermore, when evaluating model performance, metrics often have an inherent range. For instance, the accuracy of a classification model ranges from 0 to 1 (or 0% to 100%). When comparing different models or iterations, observing the range of performance metrics across various test sets or epochs helps assess stability and generalize-ability. For regression tasks, analyzing the range of prediction errors can highlight where a model performs well and where it struggles.
Practical Applications: Range in Software and AI
The theoretical understanding of range translates into tangible, practical applications that drive innovation and efficiency in software development, AI systems, and digital infrastructure.
Data Visualization and Dashboard Design
Range is intrinsically linked to effective data visualization. When designing dashboards for monitoring key performance indicators (KPIs), understanding the range of the data allows designers to set appropriate scales for charts and graphs.
-
Dynamic Scaling: Automatically adjusting chart axes based on the current data range ensures that trends and fluctuations are clearly visible without over-compressing or stretching the visual.
-
Threshold Indicators: Visualizing data points that fall outside predefined acceptable ranges (e.g., a green zone for “optimal,” yellow for “warning,” red for “critical”) relies entirely on having established ranges. For example, a network traffic dashboard might show bandwidth usage with a visual range indicating normal operating limits.
-
Heatmaps: In heatmaps, color intensity often represents values within a given range, allowing for quick visual identification of patterns or hotspots, such as server load or geographic user density.
Optimizing Algorithms and Resource Allocation
Developers use range concepts to optimize algorithms and manage computational resources.
-
Input Validation: Software often performs input validation to ensure that user-provided data falls within an expected range (e.g., an age field should be between 0 and 120). This prevents errors, security vulnerabilities, and system crashes.
-
Resource Throttling: Cloud computing platforms and application servers use ranges to throttle resources. If a service’s CPU usage consistently exceeds a certain range, the system might automatically scale up resources or trigger alerts. Conversely, if usage falls below a lower range, resources might be scaled down to save costs.
-
Search and Sort Algorithms: In some algorithms, understanding the range of values in a dataset can inform the choice of the most efficient search or sort method. For example, bucket sort works well when values are uniformly distributed over a known range.
Cybersecurity and Threat Anomaly Ranges
Cybersecurity heavily relies on identifying deviations from established norms, making range a cornerstone of its analytical framework.
-
Network Traffic Analysis: Security systems continuously monitor network traffic. They establish baseline ranges for data volume, connection attempts, and port usage. Any traffic outside these historical ranges can trigger alerts, signaling potential denial-of-service attacks, data exfiltration attempts, or malware activity.
-
User Behavior Analytics (UBA): UBA platforms profile typical user behavior and establish ranges for activities like login times, access patterns, and data downloads. If an employee’s activity suddenly falls outside their usual range (e.g., logging in at 3 AM from an unusual location and downloading large amounts of sensitive data), it’s flagged as suspicious.
-
System Logs and Events: The frequency and type of events in system logs often have an expected range. A sudden spike in failed login attempts, an unusual range of system errors, or an unexpected number of file modifications can indicate a security breach or system compromise.
Beyond Simple Range: Related Concepts and Advanced Tech Uses
While the simple max-minus-min range offers immediate insights, the broader concept extends to more sophisticated statistical measures and advanced technological applications.
Interquartile Range (IQR) and Robust Statistics
For datasets with extreme outliers, the simple range can be heavily skewed and misleading. This is where the Interquartile Range (IQR) becomes more valuable. The IQR is the range of the middle 50% of the data, calculated as the difference between the third quartile (Q3) and the first quartile (Q1). It’s a robust measure of spread, meaning it’s less affected by outliers than the simple range.
In tech, particularly in performance analysis or data quality checks, using IQR can provide a more stable understanding of typical values when dealing with noisy or erratic data. For example, when analyzing sensor readings from IoT devices, which might occasionally produce faulty data points, the IQR helps focus on the central tendency of reliable measurements.
Dynamic Ranges in Real-time Data Streams
Modern tech systems often deal with real-time data streams—continuous flows of information from various sources like sensors, user interactions, or network events. In such dynamic environments, the “range” is not static but constantly evolving.
-
Adaptive Thresholds: AI-powered monitoring systems can learn the dynamic range of metrics over time and adapt their thresholds for anomaly detection. For instance, the normal range of server load might change significantly between peak business hours and late-night maintenance windows.
-
Predictive Analytics: Understanding the historical dynamic range of a metric allows for more accurate predictive modeling. If an AI predicts future resource needs, it considers the range of past fluctuations to provide a more robust forecast, including confidence intervals that effectively define a predicted range of outcomes.
Range in Network Latency and Bandwidth
In networking, range concepts are fundamental to understanding and optimizing performance.
-
Latency Jitter: While average latency is important, the “range” or variability of latency (often referred to as jitter) is critical for real-time applications like voice over IP (VoIP) or online gaming. A wide range of latency means an inconsistent experience, even if the average is acceptable.
-
Bandwidth Utilization: Monitoring the range of bandwidth utilization helps network engineers identify periods of congestion, optimize traffic shaping rules, and plan for capacity upgrades. A network link operating consistently at its upper range limits is a candidate for expansion.

Conclusion
The mathematical definition of range, initially conceived as a simple measure of data spread, transforms into an indispensable analytical tool within the technology landscape. From the foundational layers of data exploration and statistical analysis to the cutting-edge domains of AI, machine learning, and cybersecurity, understanding and applying the concept of range is critical.
For data scientists, it’s a first step in uncovering data insights and identifying anomalies. For software developers, it guides algorithm design, system monitoring, and resource optimization. For cybersecurity professionals, it’s a cornerstone for detecting deviations that signal threats. As technology continues its relentless march forward, generating ever-increasing volumes of complex data, the ability to grasp and leverage fundamental mathematical concepts like range becomes not just an advantage, but a necessity. It empowers tech professionals to build smarter, more resilient, and more efficient systems, ensuring that innovation is grounded in robust understanding.
aViewFromTheCave is a participant in the Amazon Services LLC Associates Program, an affiliate advertising program designed to provide a means for sites to earn advertising fees by advertising and linking to Amazon.com. Amazon, the Amazon logo, AmazonSupply, and the AmazonSupply logo are trademarks of Amazon.com, Inc. or its affiliates. As an Amazon Associate we earn affiliate commissions from qualifying purchases.