
In the intricate world of finance, numbers tell a story. They convey growth, decline, efficiency, and risk. Yet, raw figures alone often lack the context needed for meaningful interpretation. This is where percentages step in, transforming isolated data points into powerful, comparable insights. Understanding “what percentage one number is of another” isn’t merely a mathematical exercise; it’s a fundamental skill, a language that underpins every aspect of personal finance, investing, business analysis, and economic understanding. From budgeting household expenses to evaluating multi-million dollar investment portfolios, the ability to calculate and interpret percentages is an indispensable tool for anyone seeking financial clarity and strategic decision-making.
This article delves into the critical importance of this seemingly simple calculation, exploring its vast applications across the financial landscape. We will demystify the core concept, illustrate its everyday relevance in managing personal finances, illuminate its strategic value in investing and wealth building, and demonstrate its indispensable role in entrepreneurial success and business analysis. Finally, we will touch upon the technological tools that make these calculations more accessible and powerful than ever before.
The Fundamental Concept: Unpacking Percentages
At its heart, a percentage is a way of expressing a number as a fraction of 100. The term “percent” literally means “per hundred.” When we ask “what percentage one number is of another,” we are essentially determining the proportional relationship between two values, normalized to a base of 100, which makes comparisons intuitive and universal.
Defining a Percentage: More Than Just a Number
A percentage provides context. For instance, knowing that a company made a profit of $500,000 is informative, but knowing that this profit represents a 15% increase from the previous year, or a 5% profit margin on total revenue, paints a far richer picture of its performance. Percentages allow us to grasp relative change, share, and proportion without being overwhelmed by the absolute magnitude of numbers. They are the universal translators of numerical data into actionable insights.
The Simple Math Behind the Magic: Calculation Basics
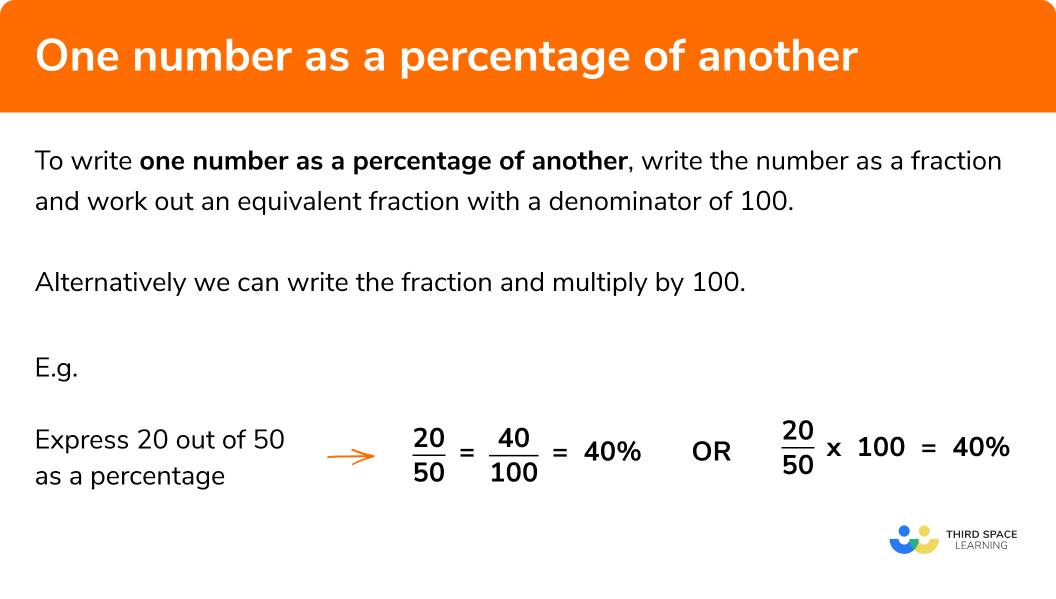
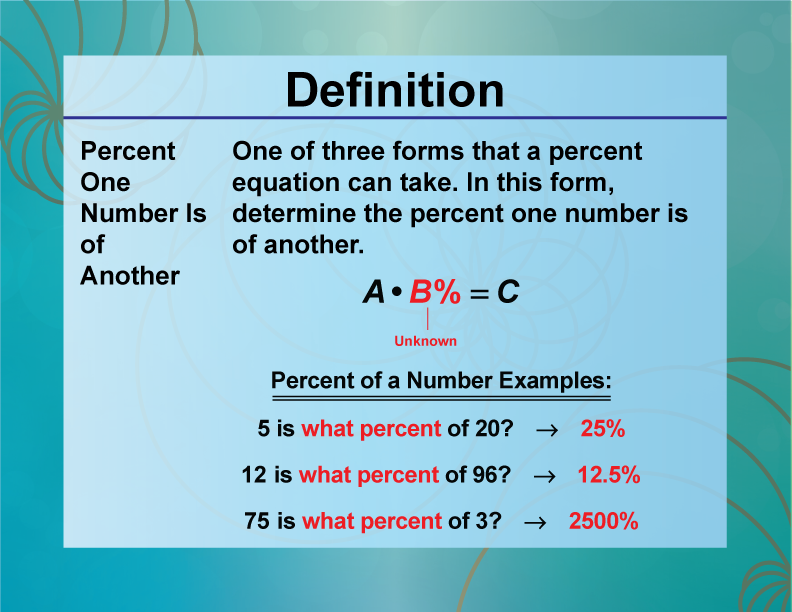
The calculation itself is elegantly simple. To find what percentage number A is of number B, you perform the following steps:
-
Divide A by B: (A / B)
-
Multiply the result by 100: (A / B) * 100
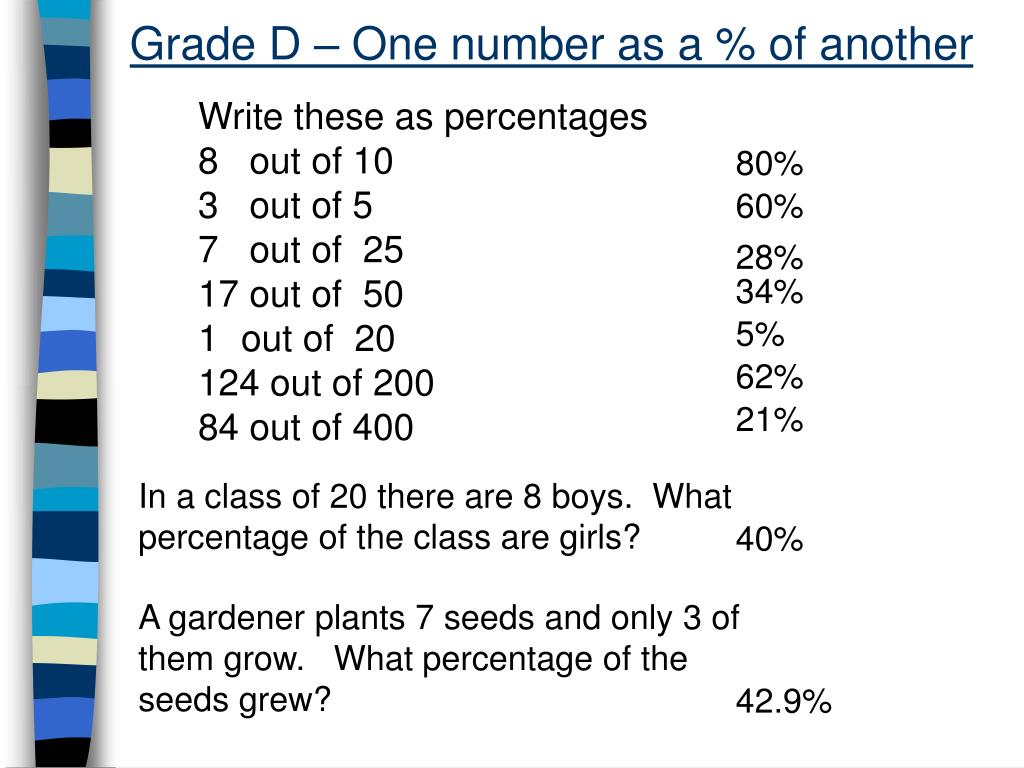
For example, if you spent $300 on groceries from a $2,000 monthly budget, you would calculate: ($300 / $2,000) * 100 = 0.15 * 100 = 15%. This tells you that groceries account for 15% of your budget. This fundamental formula serves as the bedrock for countless financial calculations, from simple budgeting to complex financial modeling.
Why This Skill is Indispensable in Finance
In the realm of money, every decision, every trend, and every outcome can often be expressed and understood through percentages. Interest rates are percentages, investment returns are percentages, tax rates are percentages, and budget allocations are often discussed in percentages. Without a solid grasp of how these percentages are derived and what they signify, individuals and businesses are left navigating a complex financial world with a significant handicap. It’s the difference between merely observing financial events and truly comprehending their implications.
Everyday Applications in Personal Finance
For the individual, mastering percentage calculations is a powerful step towards financial independence and well-being. It empowers smarter spending, more effective saving, and clearer debt management.
Budgeting and Expense Tracking: Knowing Where Your Money Goes
One of the most immediate applications of percentages in personal finance is budgeting. By calculating what percentage each spending category (housing, food, transportation, entertainment) represents of your total income or total expenses, you gain critical insights into your financial habits. For example, the popular 50/30/20 rule (50% for needs, 30% for wants, 20% for savings/debt repayment) is entirely percentage-based. Understanding these proportions allows you to identify areas of overspending, allocate funds more effectively, and ensure your financial plan aligns with your goals. Without percentages, a budget is merely a list of numbers; with them, it becomes a strategic roadmap.
Debt Management: Understanding Interest Rates and Repayment Ratios
Debt is often quantified by interest rates, which are percentages. Whether it’s a mortgage, a student loan, or credit card debt, understanding the annual percentage rate (APR) is crucial. Calculating the percentage of your income dedicated to debt repayment (debt-to-income ratio) helps you assess your financial burden and make informed decisions about taking on new debt or accelerating repayment. For instance, if your minimum payment is 2% of your outstanding balance, knowing this percentage helps you project how long it will take to pay off the debt and the total interest accrued, encouraging strategies for faster reduction.
Savings Goals and Progress: Tracking Your Financial Journey
Setting savings goals, such as a down payment for a house or a retirement fund, becomes more tangible when progress is tracked using percentages. If you need to save $50,000 and have accumulated $10,000, you’ve reached 20% of your goal. This not only provides a clear measure of progress but also offers motivation. Similarly, understanding the percentage contribution your savings make to your overall income (e.g., saving 15% of every paycheck) is a key indicator of financial health and future security.
Discounts, Sales, and Taxes: Making Savvy Consumer Choices
Everyday consumer transactions are rife with percentages. Sales often advertise discounts as “20% off” or “buy one get one 50% off.” Understanding how to quickly calculate these percentages allows you to determine the actual savings and compare deals effectively. Similarly, sales taxes and service charges are percentage-based, and being able to calculate the final cost before reaching the register helps in managing expectations and staying within budget. From negotiating a car price to understanding a utility bill surcharge, percentages empower the savvy consumer.
Strategic Insights for Investing and Wealth Building
Beyond managing daily finances, percentages are the backbone of investment analysis, enabling investors to gauge performance, manage risk, and make informed decisions that shape their financial future.
Analyzing Investment Returns: CAGR, ROI, and Yields
When evaluating investments, raw dollar gains are less informative than percentage returns. A $1,000 gain on a $10,000 investment (10% return) is vastly different from a $1,000 gain on a $100,000 investment (1% return). Key metrics like Return on Investment (ROI), Compound Annual Growth Rate (CAGR), and dividend yields are all expressed as percentages. These calculations allow investors to compare the performance of different assets over various timeframes, irrespective of their initial cost, providing a standardized measure of profitability and growth. Understanding how these percentages are calculated and what they imply is crucial for building a high-performing portfolio.
Portfolio Allocation and Diversification: Managing Risk and Opportunity
Prudent investing involves diversifying assets to manage risk. This diversification is typically expressed in percentages, such as “60% stocks, 30% bonds, 10% cash.” These percentages reflect an investor’s risk tolerance and financial goals. Regularly reviewing and rebalancing a portfolio means adjusting the percentages of different asset classes to maintain the desired allocation. For instance, if stocks perform exceptionally well, their percentage within the portfolio might exceed the target, prompting a sale of some stock to reallocate funds to other assets, thereby bringing the portfolio back to its target percentages and managing risk.
Understanding Market Movements and Economic Indicators
News headlines frequently report market fluctuations in percentages: “Stocks down 2%,” “Inflation rate at 3.5%,” “Unemployment falls by 0.1 percentage points.” These figures are critical for understanding the broader economic landscape and its potential impact on investments. Economic indicators like GDP growth, inflation, interest rate changes, and employment rates are almost always expressed as percentages or percentage changes. A solid grasp of these percentages helps investors anticipate market trends, assess economic health, and make more strategic decisions about when and where to invest.
The Power of Compound Interest: Growth Over Time
Perhaps one of the most powerful concepts in finance, compound interest, is fundamentally about percentages. It’s the interest you earn on both your initial principal and the accumulated interest from previous periods. The “percentage rate” of interest, applied repeatedly over time, demonstrates exponential growth. Understanding how a seemingly small percentage return, compounded annually over decades, can transform modest savings into substantial wealth is a game-changer for long-term financial planning and highlights the critical role of percentages in wealth accumulation.
Business Finance and Entrepreneurial Success
For businesses, percentages are not just a reporting tool; they are integral to operational analysis, strategic planning, and performance measurement. Entrepreneurs and financial managers constantly rely on percentage calculations to gauge health, efficiency, and market position.
Profit Margins and Revenue Analysis: Gauging Business Health
A business’s health is often summarized by its profit margins, which are percentages. Gross profit margin (gross profit as a percentage of revenue), operating profit margin (operating income as a percentage of revenue), and net profit margin (net income as a percentage of revenue) are vital indicators. These percentages allow businesses to understand how much profit they make from each dollar of sales, identify cost inefficiencies, and benchmark their performance against competitors in the same industry. A declining profit margin, for instance, signals a need for immediate operational review.
Cost Analysis and Operational Efficiency: Optimizing Spending
Understanding “what percentage one number is of another” is crucial for cost control. Businesses track various expenses as a percentage of revenue or total costs. For example, advertising spend might be 5% of revenue, while raw material costs could be 30% of goods sold. By monitoring these percentages, management can identify areas where costs are disproportionately high, compare them to industry averages, and implement strategies to improve operational efficiency. Whether it’s reducing labor costs as a percentage of sales or optimizing utility expenses, percentages provide the necessary framework for cost-effective management.
Sales Growth and Market Share: Measuring Performance
Growth in sales is often expressed as a percentage increase year-over-year or quarter-over-quarter. This percentage provides a clear, comparable metric for a company’s expansion. Furthermore, market share – the percentage of total sales in an industry that a company captures – is a critical indicator of competitive standing and market dominance. By calculating and tracking these percentages, businesses can assess the effectiveness of their sales strategies, understand their position within the market, and set ambitious yet realistic growth targets.
Commission Structures and Pricing Strategies
Many sales-driven businesses operate on commission structures, where sales professionals earn a specific percentage of the revenue they generate. Similarly, pricing strategies often involve percentages, such as applying a certain percentage markup on manufacturing costs to determine the retail price, or offering percentage-based discounts to stimulate sales. These calculations are fundamental to designing compensation plans that incentivize performance and setting prices that ensure profitability while remaining competitive.
Leveraging Technology and Tools for Financial Calculations
While the underlying math for percentages is straightforward, the complexity and volume of financial data in today’s world often necessitate the use of technological tools. These tools not only expedite calculations but also enable more sophisticated analysis.
Spreadsheet Software: Your Personal Financial Calculator
Microsoft Excel and Google Sheets are indispensable for financial calculations. They allow users to set up dynamic models where changing one number automatically updates all related percentage calculations. From creating detailed personal budgets with percentage breakdowns to developing complex financial statements with profit margins, spreadsheets offer unparalleled flexibility and power. Their ability to handle large datasets and perform instant calculations makes them an essential tool for both individuals and businesses.
Online Financial Calculators and Apps: Instant Insights
The internet is replete with specialized financial calculators and mobile apps designed to perform percentage-based calculations instantly. Loan calculators, investment return estimators, retirement planners, and budget apps all leverage percentage formulas to provide quick insights. These tools democratize financial analysis, making complex calculations accessible to everyone, regardless of their mathematical proficiency, and empowering users to make quick, informed decisions on the go.
Beyond Simple Percentages: Advanced Financial Modeling
For advanced users and financial professionals, software like Python with libraries like NumPy and Pandas, or specialized financial modeling tools, allows for even more intricate percentage-based analysis. These platforms can handle vast datasets, perform statistical analysis on percentage changes, forecast future performance based on percentage growth rates, and conduct sensitivity analysis by varying key percentage assumptions. This level of sophistication helps in scenario planning, risk assessment, and developing robust financial strategies for complex organizations.
Conclusion: The Empowering Language of Numbers
The question “what percentage one number is of another” might seem elementary, but its implications in the world of money are profound. It is the bedrock upon which sound financial decisions are built, from the most basic personal budget to the most complex corporate financial strategy. By mastering this fundamental concept, individuals gain greater control over their personal finances, investors can navigate market complexities with confidence, and businesses can optimize operations and drive growth. Percentages transform raw numbers into a clear, comparative language, offering an unparalleled lens through which to understand, interpret, and strategically influence the financial world around us. Embracing this numerical skill is not just about doing math; it’s about unlocking financial literacy and empowerment.
aViewFromTheCave is a participant in the Amazon Services LLC Associates Program, an affiliate advertising program designed to provide a means for sites to earn advertising fees by advertising and linking to Amazon.com. Amazon, the Amazon logo, AmazonSupply, and the AmazonSupply logo are trademarks of Amazon.com, Inc. or its affiliates. As an Amazon Associate we earn affiliate commissions from qualifying purchases.