
In the dynamic world of business, understanding financial metrics is not just an advantage; it’s an absolute necessity for survival and growth. Among the myriad of figures that business owners and financial managers must track, the “percentage of sales” stands out as a fundamental, versatile, and profoundly insightful metric. It’s far more than just a simple calculation; it’s a powerful diagnostic tool that can reveal the true health of your operations, the effectiveness of your strategies, and the efficiency of your resource allocation. From assessing individual product performance to evaluating overall profitability, mastering how to figure the percentage of sales is paramount for any entity looking to thrive.

This comprehensive guide will demystify the process, explain its various applications, and demonstrate how this seemingly simple concept can unlock deeper financial insights, enabling more informed decision-making and paving the way for sustainable success. Whether you’re a startup founder, an established entrepreneur, or a financial analyst, a clear understanding of sales percentages will undoubtedly empower you to steer your business with greater precision and confidence.
The Fundamentals of Sales Percentage Calculation
At its core, figuring a percentage of sales involves comparing a specific financial component to your total sales revenue. This comparison helps contextualize the component’s magnitude relative to your overall business activity. Before diving into complex applications, it’s crucial to grasp the basic definitions and calculations.
Defining Key Terms
To accurately calculate and interpret sales percentages, we must first establish a common understanding of the financial terms involved:
-
Gross Sales: This represents the total revenue generated from all sales activities before any deductions. It’s the top-line figure reflecting all transactions.
-
Net Sales: Gross sales minus any returns, allowances (reductions in price due to minor defects or issues), and discounts. Net sales is often the more relevant figure for performance analysis as it reflects the actual revenue retained from sales.
-
Cost of Goods Sold (COGS): The direct costs attributable to the production of the goods sold by a company. This includes material costs, direct labor, and manufacturing overhead. For service businesses, this might be referred to as Cost of Services.
-
Operating Expenses: Costs incurred in running a business that are not directly tied to production, such as salaries (non-production), rent, utilities, marketing, and administrative costs.
-
Net Income (Profit): The final profit figure after all expenses, including COGS, operating expenses, interest, and taxes, have been deducted from net sales.
Basic Formulae: Calculating Components as a Percentage of Sales
The most straightforward application involves expressing any expense or income item as a proportion of your net sales. The general formula is:
$$ text{Percentage of Sales} = left( frac{text{Specific Item Amount}}{text{Net Sales}} right) times 100 $$
For example, to find out what percentage your marketing expenses constitute of your total sales:
$$ text{Marketing Expenses as % of Sales} = left( frac{text{Total Marketing Expenses}}{text{Net Sales}} right) times 100 $$
Similarly, if you want to understand what percentage a particular product line contributes to your overall revenue:
$$ text{Product X Revenue as % of Total Sales} = left( frac{text{Revenue from Product X}}{text{Net Sales}} right) times 100 $$
The Importance of Accurate Data
The reliability of any percentage calculation hinges entirely on the accuracy of your underlying financial data. “Garbage in, garbage out” is a fundamental truth in finance. Meticulous bookkeeping, consistent categorization of expenses, and diligent tracking of all sales transactions are non-negotiable prerequisites. Investing in robust accounting software and ensuring your financial records are up-to-date will lay a solid foundation for meaningful analysis. Without accurate inputs, even the most sophisticated calculations will yield misleading conclusions, potentially leading to poor business decisions.
Advanced Applications: Beyond Simple Revenue Shares
While basic percentage calculations are useful, the true power of this metric emerges when applied to key profitability ratios. These advanced applications provide a holistic view of your business’s operational efficiency and financial health.
Gross Profit Margin
The gross profit margin reveals how much profit your company makes from each sale after deducting the direct costs of producing that sale. It’s a direct indicator of your product pricing strategy and cost of goods sold efficiency.
$$ text{Gross Profit Margin} = left( frac{text{Net Sales} – text{COGS}}{text{Net Sales}} right) times 100 $$
$$ text{or simply } left( frac{text{Gross Profit}}{text{Net Sales}} right) times 100 $$
A high gross profit margin suggests efficient production or strong pricing power, while a low margin might indicate the need to renegotiate supplier contracts, optimize production processes, or revisit pricing.
Operating Profit Margin
This margin takes profitability a step further by including operating expenses. It shows how much profit a company makes from its core operations before accounting for interest and taxes.
$$ text{Operating Profit Margin} = left( frac{text{Operating Income}}{text{Net Sales}} right) times 100 $$
Operating income (or EBIT – Earnings Before Interest and Taxes) is calculated as Gross Profit minus Operating Expenses. This metric is crucial for assessing the efficiency of your operational management, including sales, general, and administrative costs. A declining operating margin could signal ballooning administrative costs or ineffective sales strategies.
Net Profit Margin
The ultimate measure of profitability, the net profit margin, shows the percentage of revenue left after all expenses, including COGS, operating expenses, interest, and taxes, have been deducted.
$$ text{Net Profit Margin} = left( frac{text{Net Income}}{text{Net Sales}} right) times 100 $$
This figure represents the bottom line – what your business truly earned from every dollar of sales. It provides the most comprehensive view of your company’s overall financial health and its ability to convert revenue into actual profit for owners and shareholders. It’s often the figure investors scrutinize most closely.
Why Sales Percentages Matter for Business Strategy
Understanding sales percentages is not merely an academic exercise; it forms the bedrock of strategic planning, performance evaluation, and decision-making across all facets of a business.
Performance Analysis and Benchmarking
Sales percentages provide a standardized way to measure performance:
-
Internal Benchmarking: Track your own percentages over time (month-over-month, quarter-over-quarter, year-over-year). Are your gross margins improving? Are operating expenses growing disproportionately to sales? This trend analysis helps identify areas of improvement or concern.
-
Industry Benchmarking: Compare your margins and expense percentages against industry averages. This can reveal if your business is operating efficiently compared to competitors. For example, if your marketing expenses are 15% of sales while the industry average is 8%, you might be overspending or employing less efficient strategies.
-
Product/Service Performance: Analyze sales percentages for individual products or service lines. Identify your “cash cows” (high sales percentage, high margin) and “dogs” (low sales percentage, low margin).
Pricing Strategies and Product Mix
By understanding gross profit margins for different products or services, you can make informed decisions about pricing and your product portfolio:
-
Optimizing Pricing: If a product has a very low gross margin, you might consider increasing its price, reducing its COGS, or even discontinuing it. Conversely, high-margin products might warrant more marketing investment.
-
Strategic Product Mix: Focus your sales efforts on products or services that contribute more significantly to your overall profit margins. This doesn’t necessarily mean abandoning lower-margin items, but understanding their role (e.g., loss leaders, complementary products).
Expense Management and Cost Control
Expressing expenses as a percentage of sales allows for a more intuitive understanding of cost control:
-
Identifying Inefficiencies: If your rent is 5% of sales this year compared to 3% last year, and sales haven’t significantly increased, it’s a red flag. This approach highlights where expenses are growing out of proportion to revenue.
-
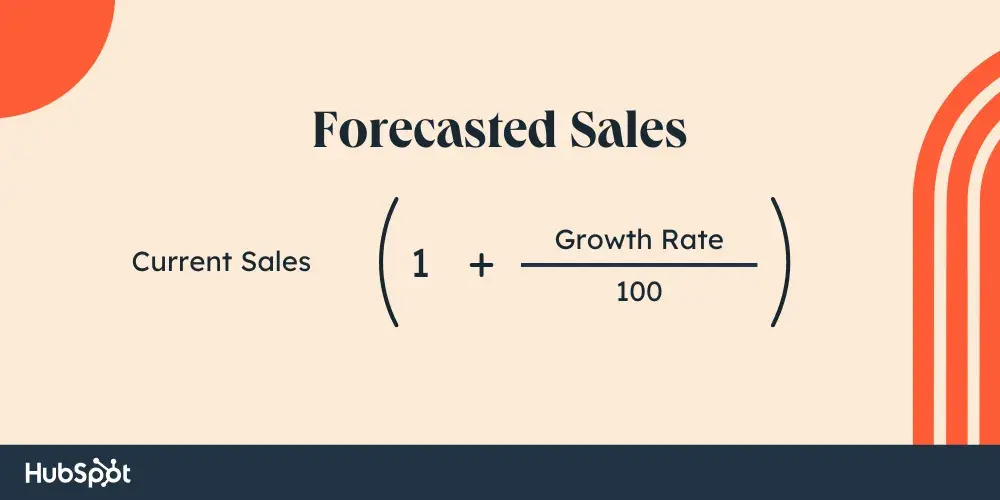
Budgeting and Forecasting: When creating budgets, setting expense targets as a percentage of projected sales provides a clear and actionable framework. For instance, you might budget 10% of sales for marketing and 20% for administrative costs.
Investor Relations and Funding
For businesses seeking investment or loans, presenting a clear picture of sales percentages is critical:
-
Demonstrating Profitability: Investors want to see healthy gross, operating, and net profit margins as evidence of a viable and sustainable business model.
-
Growth Potential: Consistent or improving margins, especially when coupled with revenue growth, signals a well-managed company with strong growth potential, making it more attractive to funders.
Practical Tools and Best Practices for Calculation
While the calculations are straightforward, implementing them effectively requires appropriate tools and a disciplined approach.
Spreadsheet Software (Excel/Google Sheets)
For many small to medium-sized businesses, spreadsheet software remains an indispensable tool for financial analysis:
-
Customizable Templates: Create your own sales percentage dashboards. Set up columns for Net Sales, COGS, Operating Expenses, etc., and then use simple formulas to calculate percentages dynamically.
-
“What If” Scenarios: Easily model the impact of changes, such as a 5% increase in sales or a 2% reduction in COGS, on your profit margins.
-
Data Visualization: Generate charts and graphs (e.g., pie charts for expense allocation, line graphs for trend analysis of margins) to make complex data more digestible and actionable.
Accounting Software (QuickBooks, Xero, Sage, etc.)
Modern accounting software automates much of the data collection and reporting, significantly streamlining the process:
-
Automated Financial Statements: These platforms automatically generate Profit & Loss (Income) Statements, which are the primary source for all sales percentage calculations.
-
Integrated Reporting: Many offer built-in reporting features that can calculate and display key financial ratios, including profit margins, at the click of a button.
-
Real-time Data: With cloud-based solutions, you can access up-to-the-minute financial data, allowing for timely analysis and quick adjustments to strategy.
Regular Review and Reporting
Consistency is key. Establish a regular cadence for reviewing your sales percentages:
-
Monthly/Quarterly Reports: Integrate sales percentage analysis into your routine financial reporting.
-
Dashboards: Create simple, visual dashboards that track key margins and expense percentages. This makes it easy to spot trends and anomalies quickly.
-
Stakeholder Communication: Share these insights with your management team, department heads, and even employees where appropriate, fostering a culture of financial awareness and accountability.
Common Pitfalls and How to Avoid Them
Even with the right tools and understanding, certain pitfalls can derail your analysis.
Inaccurate Data Entry
As mentioned, faulty input leads to faulty output. Double-check all figures, reconcile accounts regularly, and ensure expenses are categorized correctly. A miscategorized expense can distort the percentage for an entire category, leading to misinformed decisions.
Ignoring Non-Cash Expenses
While direct cash flow is vital, ignoring non-cash expenses like depreciation and amortization when calculating operating or net profit margins can present an overly optimistic picture of profitability. These expenses, though not involving immediate cash outflow, reflect the cost of using assets over time and impact your true profit.
Lack of Context
A percentage in isolation tells an incomplete story. A 10% net profit margin might be excellent for a grocery store but poor for a software company. Always compare your percentages against historical data, industry benchmarks, and your own strategic goals.
Focusing Solely on Revenue
While revenue growth is exciting, neglecting profit margins can be a fatal mistake. A business can have skyrocketing sales but still be losing money if its costs are growing at an even faster rate. Always prioritize profitability alongside revenue growth.

Conclusion
Mastering how to figure the percentage of sales is a cornerstone of sound financial management and strategic business planning. From the basic calculation of an expense relative to revenue to the insightful analysis of gross, operating, and net profit margins, this metric empowers business leaders with a granular understanding of their financial performance.
By diligently tracking these percentages, comparing them against benchmarks, and integrating them into your decision-making processes, you unlock the ability to optimize pricing, control costs, allocate resources effectively, and communicate your business’s health with confidence. In an increasingly competitive landscape, leveraging the power of sales percentages is not just a best practice; it is a fundamental requirement for sustainable growth and long-term success. Embrace these calculations, and transform raw financial data into actionable intelligence that drives your business forward.
aViewFromTheCave is a participant in the Amazon Services LLC Associates Program, an affiliate advertising program designed to provide a means for sites to earn advertising fees by advertising and linking to Amazon.com. Amazon, the Amazon logo, AmazonSupply, and the AmazonSupply logo are trademarks of Amazon.com, Inc. or its affiliates. As an Amazon Associate we earn affiliate commissions from qualifying purchases.