
In the dynamic world of finance, where numbers tell stories of growth, decline, and opportunity, understanding how to accurately interpret change is paramount. Raw figures, while informative, often lack the necessary context to truly gauge performance or make informed decisions. This is where the concept of percentage difference becomes indispensable. Whether you’re tracking your personal investment portfolio, analyzing a company’s quarterly earnings, or evaluating budget variances, the ability to calculate and interpret a percentage difference is a foundational skill that empowers clearer financial insight.
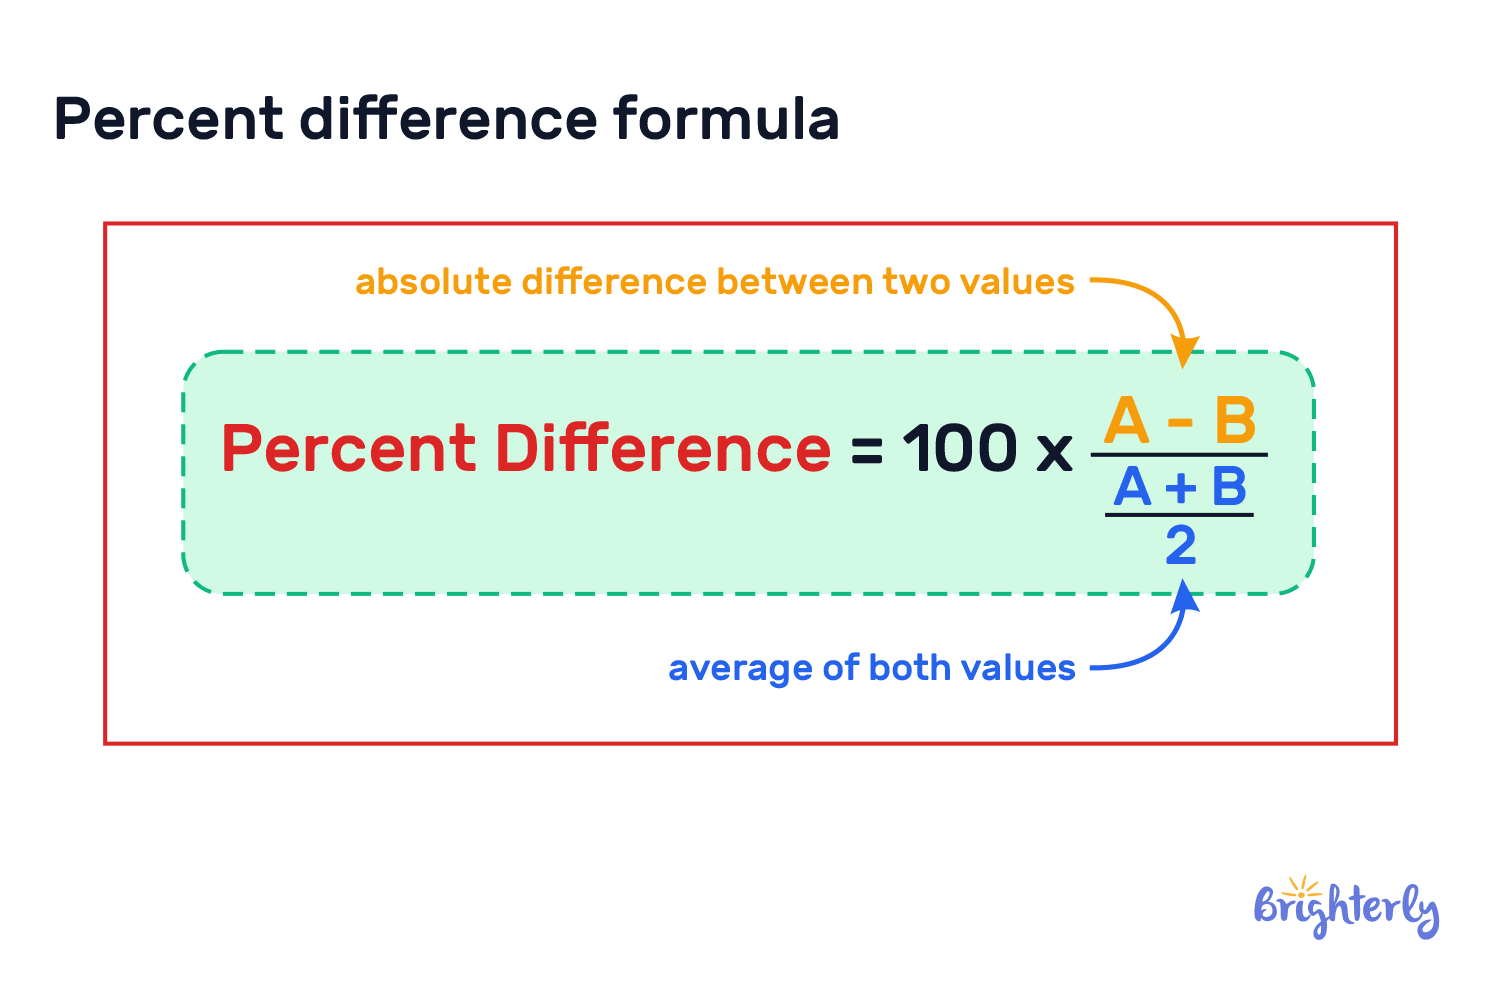
Unlike a simple absolute difference, which merely tells you the numerical gap between two figures, a percentage difference provides a relative measure of change. It puts that numerical gap into perspective by comparing it against the initial value. This article will delve into the mechanics of calculating a percentage difference, illustrate its myriad applications within the financial sector, and equip you with the knowledge to apply this powerful analytical tool confidently in your personal and professional financial endeavors.
The Foundation: What is Percentage Difference?
At its heart, a percentage difference is a metric that quantifies the relative change between two values. It answers the question: “By what percentage has a value increased or decreased compared to its starting point?” This concept is crucial for understanding the true magnitude of fluctuations in financial data.
Defining the Concept
The percentage difference, often interchangeably referred to as percentage change, measures the extent of a shift from an initial, or ‘old,’ value to a subsequent, or ‘new,’ value, expressed as a percentage of the initial value. It differentiates itself from an absolute difference, which is simply ‘New Value – Old Value’. While an absolute difference gives you the raw numerical change, it doesn’t provide the scale. For instance, an absolute increase of $100 might seem significant, but its meaning changes dramatically if it’s an increase on a $1,000 base versus a $100,000 base.
Why It Matters in Finance
In financial analysis, context is everything. A $50,000 increase in revenue for a small startup is a vastly different story than a $50,000 increase for a multi-billion dollar corporation. Percentage difference allows us to normalize these changes, providing a standardized way to compare different financial situations regardless of their absolute scale.
Consider an investment scenario: if Stock A increases by $10 and Stock B increases by $10, their absolute differences are identical. However, if Stock A started at $50 and Stock B started at $1,000, their percentage differences would be 20% and 1% respectively. This relative measure immediately highlights that Stock A experienced a much more substantial proportional gain. This distinction is critical for evaluating investment performance, assessing business growth rates, comparing budget adherence, and making strategic financial decisions across all scales.
The Core Calculation: Step-by-Step Formula
The beauty of the percentage difference lies in its straightforward calculation. Once you understand the underlying logic, you can apply it to virtually any pair of financial figures.
The Basic Formula
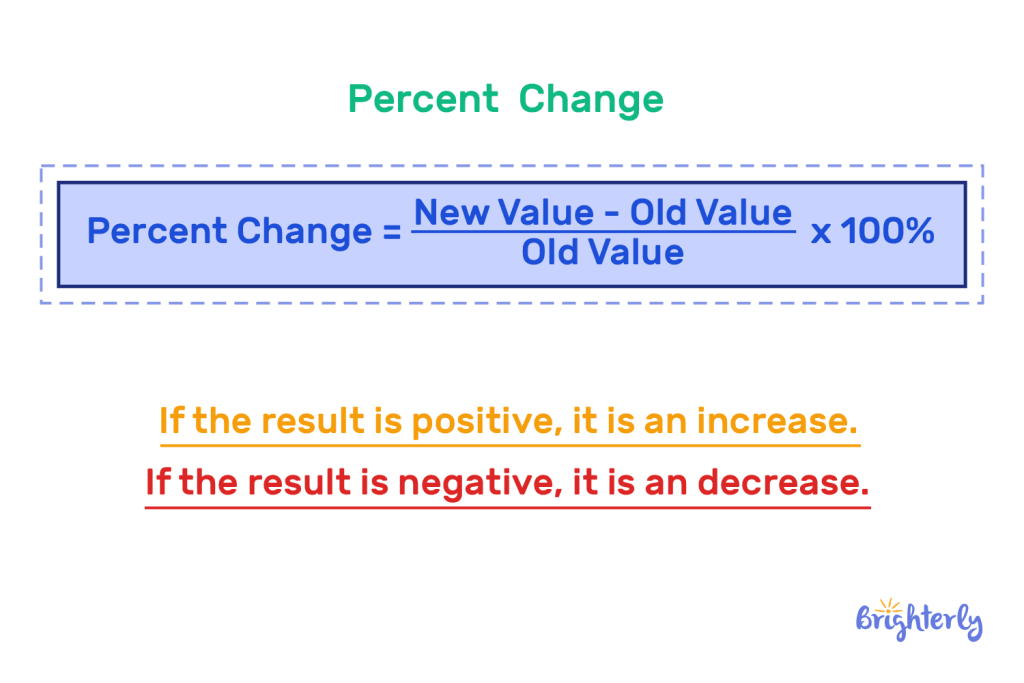
The universally accepted formula for calculating percentage difference is:
Percentage Difference = ((New Value - Old Value) / Old Value) * 100
Let’s break down each component of this formula to understand its role.
Breaking Down the Components
-
New Value (or Current Value): This is the value at the end of the period or the value you are comparing to.
-
Old Value (or Original Value/Base Value): This is the value at the beginning of the period or the value you are comparing from. This serves as the reference point for the change.
-
(New Value - Old Value): This first step calculates the absolute difference between the two values. It tells you the raw numerical increase or decrease. -
... / Old Value: Dividing the absolute difference by the Old Value converts the absolute change into a decimal fraction representing the relative change. A result of 0.25 means a 25% increase, while -0.10 means a 10% decrease. -
... * 100: Multiplying by 100 converts this decimal fraction into a percentage, making it easier to read and interpret.
Positive vs. Negative Results
-
Positive Percentage Difference: If the New Value is greater than the Old Value, the result will be a positive percentage. This indicates an increase, growth, or gain.
-
Negative Percentage Difference: If the New Value is less than the Old Value, the result will be a negative percentage. This indicates a decrease, decline, or loss.
Practical Example 1: Investment Growth
Imagine you purchased shares of a company.
-
Old Value: Your initial investment price was $50 per share.
-
New Value: The current market price for the share is $65.
Let’s calculate the percentage difference:
-
Absolute Difference: $65 – $50 = $15
-
Relative Change: $15 / $50 = 0.30
-
Percentage Difference: 0.30 * 100 = 30%
This means your investment has grown by 30%.
Practical Example 2: Budget Variance
Suppose you are tracking your monthly utility bill.
-
Old Value: Last month’s utility bill was $120.
-
New Value: This month’s utility bill is $100.
Let’s calculate the percentage difference:
-
Absolute Difference: $100 – $120 = -$20
-
Relative Change: -$20 / $120 = -0.1666…
-
Percentage Difference: -0.1666… * 100 = -16.67% (rounded to two decimal places)
This indicates a decrease of 16.67% in your utility bill, representing a saving.
Beyond Simple Changes: Advanced Applications in Financial Analysis
While the basic calculation is straightforward, its power truly shines in more complex financial analysis, allowing for nuanced comparisons and performance tracking.
Comparing Performance Over Multiple Periods
Businesses and investors frequently use percentage differences to analyze trends over time. Year-over-year (YOY) growth rates, quarter-over-quarter (QOQ) changes, or month-over-month (MOM) fluctuations are all calculated using percentage difference. For instance, a company reporting 15% YOY revenue growth signifies a strong upward trend, while consistently declining QOQ sales might signal underlying issues. This comparative analysis helps identify patterns, assess seasonality, and project future performance.
Analyzing Investment Portfolios
For investors, percentage difference is the cornerstone of performance evaluation. It’s used to:
-
Calculate Individual Asset Returns: Determine the percentage gain or loss on individual stocks, bonds, or funds within a portfolio.
-
Assess Portfolio-Wide Returns: Calculate the overall percentage return of an entire investment portfolio over a specific period, factoring in contributions and withdrawals to ensure an accurate time-weighted or money-weighted return.
-
Benchmark Against Indices: Compare your portfolio’s percentage return against a relevant market index (e.g., S&P 500) to gauge its relative outperformance or underperformance. Understanding these percentage differences is vital for strategic asset allocation and rebalancing decisions.
Business Finance and KPIs
In business finance, percentage difference is critical for monitoring Key Performance Indicators (KPIs) and making strategic operational decisions:
-
Sales Growth: Tracking percentage change in sales revenue to assess market penetration and product success.
-
Profit Margin Changes: Analyzing percentage shifts in gross or net profit margins to understand cost control and pricing strategies.
-
Expense Variances: Comparing actual expenses against budgeted expenses using percentage difference to identify areas for cost reduction or explain overruns.
-
Customer Acquisition Cost (CAC) or Customer Lifetime Value (CLV) Changes: Measuring the percentage change in these metrics helps marketing and sales teams refine strategies.
By consistently applying percentage difference to these KPIs, businesses can benchmark their performance against industry averages, competitors, or internal targets, providing actionable insights for growth and efficiency.
Common Pitfalls and Best Practices
While simple, misapplying the percentage difference formula can lead to erroneous conclusions. Being aware of common pitfalls and adhering to best practices ensures accuracy in your financial analysis.
Choosing the Correct “Old Value”
The most crucial step is identifying the correct “Old Value” or base value. This must be the reference point from which the change is measured. For example, if you’re measuring the growth from Q1 to Q2, Q1’s value is the ‘Old Value’. If you’re comparing your current portfolio value to last year’s value, last year’s value is the ‘Old Value’. Incorrectly selecting the base value will lead to an invalid percentage difference.
The “Zero” Base Problem
A significant mathematical limitation arises when the “Old Value” is zero. Division by zero is undefined. In financial contexts, this can happen if, for example, a company had zero revenue last year and now has some revenue, or if you had zero investments and now have some. In such cases, a percentage difference cannot be calculated meaningfully. Instead, it’s more appropriate to report the absolute difference or state that there was an infinite percentage increase from zero.
Interpreting Small vs. Large Base Values
Remember that percentage difference provides relative context. A small absolute change can result in a massive percentage change if the base value is very small. Conversely, a large absolute change might result in a small percentage change if the base value is enormous. Always consider the absolute figures alongside the percentage difference to get a complete picture. An investment that went from $1 to $10 is a 900% increase, while an investment from $1,000,000 to $1,000,009 is a minuscule 0.0009% increase, despite both having an absolute difference of $9.
Rounding and Precision
For financial reporting, precision matters. Decide on an appropriate number of decimal places for your percentage differences (e.g., two decimal places for currency, perhaps more for very small changes). Consistent rounding helps maintain accuracy and readability across your reports.
Visualizing Percentage Differences
To make financial data more digestible, especially when comparing multiple percentage changes, consider visualizing them using charts and graphs. Bar charts are excellent for showing discrete period-over-period changes, while line graphs can effectively illustrate trends in percentage growth or decline over longer durations.
Leveraging Tools for Financial Percentage Calculations
While the formula is simple enough for manual calculation, leveraging technology can streamline the process, reduce errors, and handle large datasets efficiently.
Spreadsheets (Excel, Google Sheets)
Spreadsheet software like Microsoft Excel or Google Sheets are indispensable tools for financial analysis. You can easily set up the percentage difference formula:
If your Old Value is in cell A2 and your New Value is in cell B2, the formula would be:
=((B2-A2)/A2)*100
You can then drag this formula down a column to calculate percentage differences for hundreds or thousands of data points instantly. Most spreadsheet programs also have built-in percentage formatting, allowing you to display the decimal as a percentage directly by selecting the cell and clicking the ‘%’ style button.
Financial Calculators and Software
Many dedicated financial calculators (both physical and online versions) include functions for percentage change calculations. Accounting software, investment platforms, and business intelligence tools often have built-in features that automatically calculate and display percentage differences for key metrics, saving you manual effort and ensuring consistency.
Online Tools and Converters
For quick, one-off calculations, a simple search for “percentage difference calculator” will yield numerous free online tools. These are useful for verifying your manual calculations or for immediate needs without opening a spreadsheet.

Conclusion
The ability to calculate a percentage difference is far more than just a mathematical exercise; it’s a fundamental competency in financial literacy. It transforms raw numbers into meaningful insights, providing the critical context needed to evaluate performance, identify trends, and make sound decisions in personal finance, investing, and business operations. By mastering this simple yet powerful calculation, you gain a clearer lens through which to view your financial world, empowering you to navigate its complexities with greater confidence and strategic foresight. Integrate this skill into your analytical toolkit, and watch as your understanding of financial dynamics deepens, leading to more informed and impactful financial choices.
aViewFromTheCave is a participant in the Amazon Services LLC Associates Program, an affiliate advertising program designed to provide a means for sites to earn advertising fees by advertising and linking to Amazon.com. Amazon, the Amazon logo, AmazonSupply, and the AmazonSupply logo are trademarks of Amazon.com, Inc. or its affiliates. As an Amazon Associate we earn affiliate commissions from qualifying purchases.