
The stock exchange, often perceived as a labyrinth of complex data and jargon, is in reality a vibrant marketplace where investors converge to buy and sell ownership stakes in publicly traded companies. For anyone looking to build wealth, fund retirement, or simply understand the economic pulse of the world, learning to “read” the stock exchange is an indispensable skill. It’s not about predicting the future, but rather about interpreting present and past data to make informed decisions. This guide will demystify the stock exchange, providing a structured approach to understanding its language, navigating its interfaces, and employing both fundamental and technical analysis to uncover valuable insights. By the end, you’ll possess a robust framework for interpreting market signals and integrating them into your investment strategy.
Understanding the Language of the Stock Exchange
Before you can interpret market movements, you must first become fluent in the terminology and symbols that underpin all trading activities. The stock exchange, like any specialized field, has its own unique lexicon that, once mastered, unlocks a deeper understanding of its intricate dynamics.
Key Terminology and Concepts
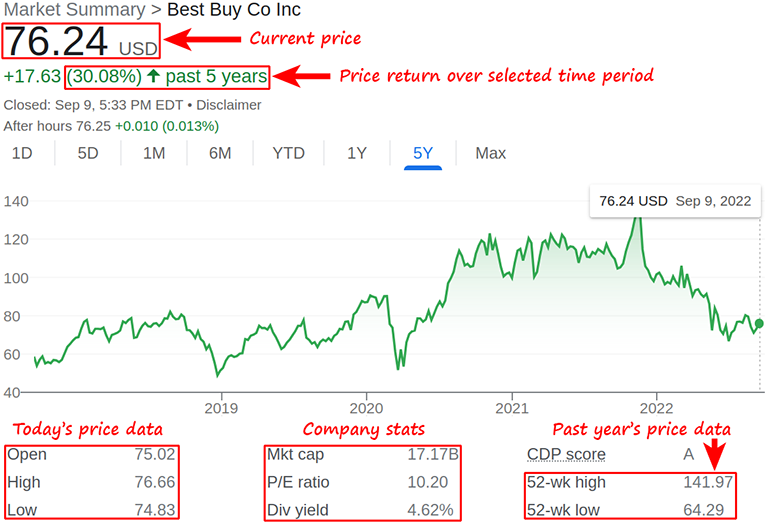
At its core, a stock (or equity) represents a fractional ownership in a company. When you buy a stock, you purchase shares of that company. Companies may distribute a portion of their earnings to shareholders in the form of dividends, which are typically paid quarterly. Market capitalization (market cap) is the total value of a company’s outstanding shares, calculated by multiplying the current share price by the number of shares outstanding. It’s a key indicator of a company’s size.
The bid price is the highest price a buyer is willing to pay for a stock, while the ask price (or offer price) is the lowest price a seller is willing to accept. The difference between these two is the bid-ask spread. Volume refers to the number of shares traded in a given period, indicating market interest and liquidity. High volume often accompanies significant price movements. Liquidity describes how easily a stock can be bought or sold without impacting its price. Highly liquid stocks have tight bid-ask spreads and high volume. Volatility measures the degree of price fluctuations; highly volatile stocks experience sharp ups and downs. Understanding these foundational terms is the first step toward deciphering the market’s daily conversation.
Deciphering Tickers and Trading Symbols
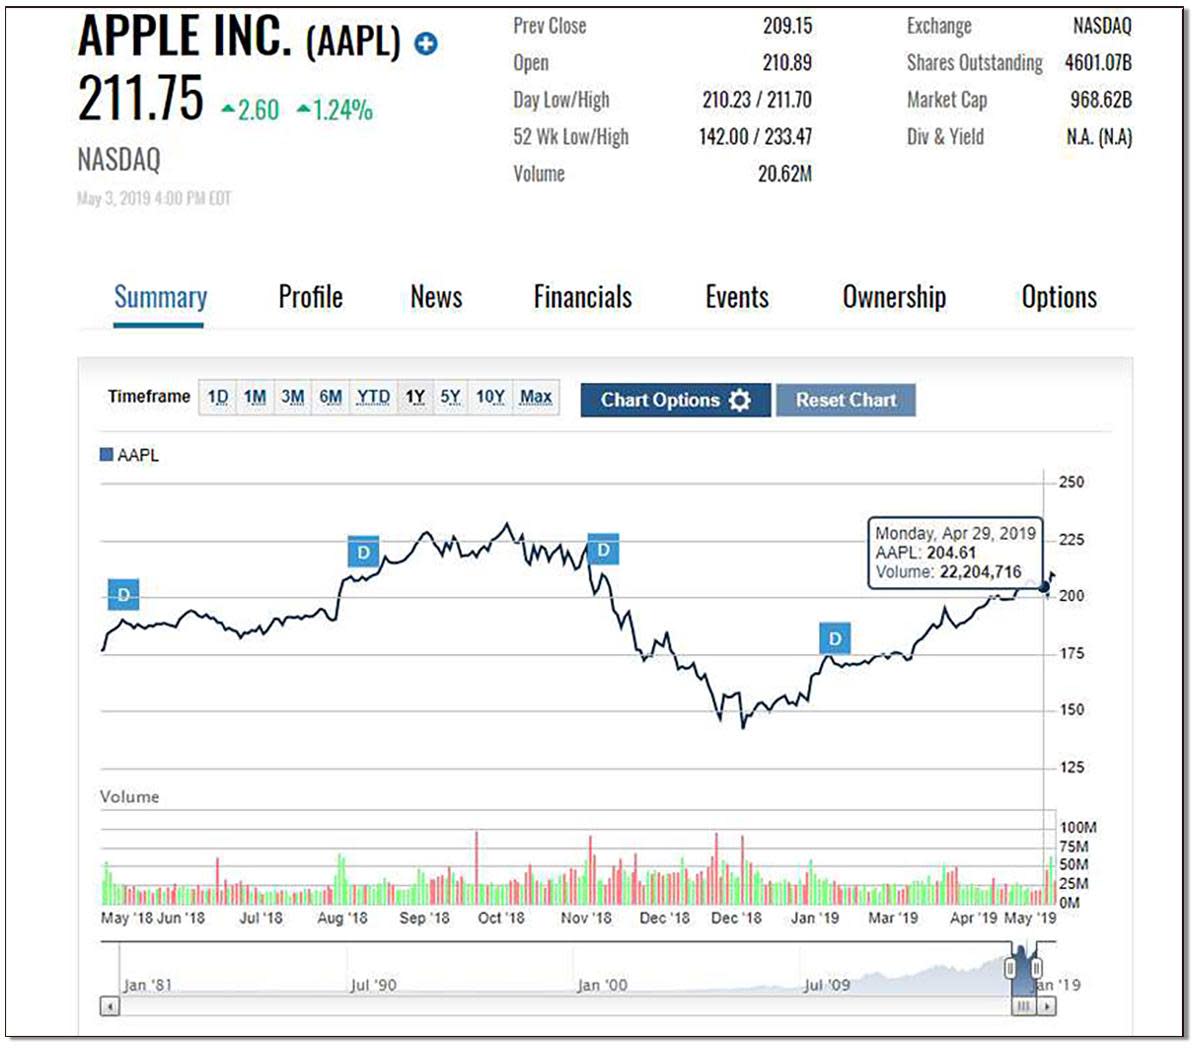
Every publicly traded company is identified by a unique ticker symbol, a shorthand abbreviation (usually 1-5 letters) used to represent its stock on an exchange. For example, Apple is AAPL, Microsoft is MSFT, and Amazon is AMZN. These symbols are essential for quickly finding specific company data on trading platforms, financial news sites, and market data providers. A stock’s ticker symbol is its digital fingerprint, allowing investors to track its performance and news without ambiguity. Familiarizing yourself with the ticker symbols of companies you’re interested in is fundamental to efficient market research.
Grasping Market Indices
Market indices are statistical measures that track the performance of a basket of stocks, representing a particular segment of the market or the market as a whole. They serve as crucial barometers for the overall health and direction of the stock market. The three most widely followed U.S. indices are:
-
Dow Jones Industrial Average (DJIA or “the Dow”): A price-weighted average of 30 significant industrial companies.
-
S&P 500: A market-cap-weighted index of 500 large U.S. companies, widely considered the best gauge of large-cap U.S. equities.
-
Nasdaq Composite: A market-cap-weighted index of all stocks listed on the Nasdaq stock exchange, heavily weighted towards technology and growth companies.
By tracking these indices, investors can quickly assess whether the broader market is up or down, gauge market sentiment, and compare the performance of individual stocks or portfolios against a benchmark.
Navigating Exchange Interfaces and Data Displays
Modern brokerage platforms and financial news websites provide a wealth of real-time data, charts, and news feeds. Learning to navigate these interfaces and correctly interpret the displayed information is critical for making timely and informed decisions.
Real-time Quotes and Level II Data
A real-time stock quote provides the most up-to-date information on a stock’s price, including the last traded price, current bid and ask prices, daily open, high, low, and previous close. It also shows the trading volume for the day. These basic quotes are typically free and readily available.
For more advanced traders, Level II data offers a deeper look into market liquidity and order flow. It displays the full depth of the order book, showing not just the best bid and ask, but also multiple bid and ask prices at various quantities. This transparency allows traders to see where significant buying and selling interest lies, helping them gauge potential price movements and identify support and resistance levels. While often a paid service, Level II data can provide a significant edge for day traders and active investors.
Interpreting Volume and Price Action
Volume is a powerful indicator that, when combined with price action (the movement of a stock’s price over time), can reveal a lot about market sentiment. A strong price move (up or down) accompanied by high volume suggests conviction behind that move. Conversely, a price move on low volume might indicate weakness or a lack of strong interest, making it potentially less sustainable.
Candlestick charts are particularly useful for visualizing price action. Each “candlestick” represents a specific time period (e.g., 1 day, 1 hour) and displays the open, high, low, and close prices within that period. The “body” of the candle shows the range between the open and close, while the “wicks” or “shadows” extend to the high and low prices. A green (or white) body indicates the close was higher than the open, suggesting bullish sentiment, while a red (or black) body means the close was lower than the open, indicating bearish sentiment. Learning to read these visual cues can help investors quickly assess buying and selling pressure.
Reading Financial News and Company Announcements
The stock exchange is not solely about numbers; it’s also heavily influenced by news and narratives. Staying abreast of financial news and company announcements is paramount. This includes:
-
Earnings Reports: Quarterly and annual reports detail a company’s financial performance, including revenue, earnings per share (EPS), and future guidance. These are major market movers.
-
Analyst Ratings: Investment banks and research firms issue ratings (buy, sell, hold) and price targets for stocks, which can sway investor sentiment.
-
Mergers & Acquisitions (M&A): Announcements of companies merging or acquiring others often have significant implications for the stock prices of all involved parties.
-
Economic Indicators: Macroeconomic data such as interest rate decisions, inflation reports, GDP growth, and unemployment rates can impact entire sectors or the broader market.
-
Geopolitical Events: Global events, political stability, and international relations can introduce uncertainty and volatility into the markets.
A holistic approach to reading the stock exchange integrates both quantitative data and qualitative news, understanding how external factors can shape investor psychology and, consequently, stock prices.
Fundamental Analysis: Beyond the Numbers
While daily price movements can be captivating, fundamental analysis provides a deeper, long-term perspective by evaluating a company’s intrinsic value. This method involves scrutinizing financial statements, assessing management quality, and understanding the company’s competitive landscape.
Key Financial Statements
At the heart of fundamental analysis are three primary financial statements:
-
Balance Sheet: A snapshot of a company’s financial health at a specific point in time. It lists assets (what the company owns), liabilities (what it owes), and shareholder equity (the residual value belonging to owners). The fundamental equation is Assets = Liabilities + Equity.
-
Income Statement (Profit & Loss Statement): Shows a company’s financial performance over a period (e.g., a quarter or year). It details revenue (sales), expenses, and ultimately, net profit or loss.
-
Cash Flow Statement: Tracks the cash generated and used by a company over a period. It’s broken down into operating activities (core business), investing activities (buying/selling assets), and financing activities (debt, equity, dividends). This statement is crucial because “cash is king” – a profitable company can still face issues if it doesn’t manage its cash flow effectively.
Thoroughly reviewing these statements helps investors understand a company’s financial stability, profitability, and operational efficiency.
Essential Financial Ratios
Financial ratios distill complex financial data into digestible metrics, allowing for quick comparisons between companies and industries, or over different periods for the same company.
-
Price-to-Earnings (P/E) Ratio: Share Price / Earnings Per Share (EPS). Indicates how much investors are willing to pay for each dollar of a company’s earnings. A high P/E might suggest investors expect high future growth.
-
Earnings Per Share (EPS): Net Profit / Number of Outstanding Shares. Represents the portion of a company’s profit allocated to each outstanding share. Higher EPS is generally better.
-
Return on Equity (ROE): Net Income / Shareholder Equity. Measures how efficiently a company uses shareholder investments to generate profits.
-
Debt-to-Equity Ratio: Total Liabilities / Shareholder Equity. Shows the proportion of debt a company uses to finance its assets relative to equity. A lower ratio typically indicates lower risk.
-
Dividend Yield: Annual Dividends Per Share / Share Price. For income-focused investors, this indicates the percentage return on investment from dividends.
These ratios, when analyzed in context, paint a comprehensive picture of a company’s financial health and valuation, helping investors determine if a stock is overvalued, undervalued, or fairly priced.
Industry and Economic Context
No company operates in a vacuum. A critical aspect of fundamental analysis involves understanding the broader industry trends and the overall economic context. Is the industry growing or contracting? Who are the key competitors, and what is the company’s competitive advantage (e.g., patents, brand loyalty, cost efficiency)? Macroeconomic factors such as interest rates, inflation, GDP growth, and unemployment figures can significantly impact consumer spending, business investment, and, consequently, corporate earnings. A company operating in a booming industry during an economic expansion might naturally perform better than one in a struggling sector during a recession, regardless of individual company specifics. A well-rounded fundamental analyst considers these external forces when assessing a stock’s potential.
Technical Analysis: Charting Market Sentiment
While fundamental analysis seeks to determine a stock’s intrinsic value, technical analysis focuses on past price and volume data to predict future price movements. It’s built on the premise that all relevant information is already reflected in the stock’s price, and that history tends to repeat itself.
Understanding Basic Chart Types
Technical analysts primarily use charts to visualize price action over time.
-
Line Charts: The simplest form, connecting closing prices over a period, useful for spotting general trends.
-
Bar Charts: Show the open, high, low, and close prices for each period, offering more detail than line charts.
-
Candlestick Charts: As discussed earlier, these are highly popular due to their ability to convey open, high, low, and close prices in an intuitive visual format, making it easy to discern bullish or bearish sentiment within a single period.
Each chart type offers a different perspective, and analysts often use a combination to gain comprehensive insights into price behavior.
Identifying Trends and Patterns
The cornerstone of technical analysis is identifying trends and patterns.
-
Uptrends: Characterized by a series of higher highs and higher lows, indicating sustained buying pressure.
-
Downtrends: Defined by lower highs and lower lows, signifying persistent selling pressure.
-
Sideways (or Range-Bound) Trends: Occur when a stock trades within a defined price range without a clear upward or downward direction.
Beyond trends, technical analysts look for recurring chart patterns that have historically preceded certain price movements. Examples include:
-
Support and Resistance Levels: Support is a price level where buying interest is strong enough to prevent the price from falling further, while resistance is a level where selling pressure is strong enough to halt price increases.
-
Head and Shoulders: A reversal pattern suggesting an uptrend might be ending.
-
Double Tops/Bottoms: Also reversal patterns, indicating a potential shift in trend.
-
Flags and Pennants: Continuation patterns, suggesting a brief pause before the trend resumes.
Recognizing these patterns helps traders anticipate potential price directions and entry/exit points.
Using Technical Indicators (Briefly)
Technical indicators are mathematical calculations based on a stock’s price, volume, or open interest, plotted on charts to help identify trends, momentum, volatility, and overbought/oversold conditions.
-
Moving Averages (MAs): Smooth out price data to identify trend direction. A Simple Moving Average (SMA) takes the average price over a set period, while an Exponential Moving Average (EMA) gives more weight to recent prices. Crossovers of different moving averages (e.g., 50-day MA crossing above 200-day MA) are often used as buy/sell signals.
-
Relative Strength Index (RSI): A momentum oscillator that measures the speed and change of price movements, typically ranging from 0 to 100. Readings above 70 often indicate a stock is “overbought” (potentially due for a pullback), while readings below 30 suggest it’s “oversold” (potentially due for a bounce).
-
Moving Average Convergence Divergence (MACD): Another momentum indicator that shows the relationship between two moving averages of a stock’s price. It helps identify trend changes and momentum strength.
While technical indicators can be powerful tools, they are best used in conjunction with other forms of analysis and should not be relied upon in isolation. They provide a quantitative view of market psychology and potential shifts.
Practical Application and Continuous Learning
Becoming proficient at reading the stock exchange is an ongoing journey that combines theoretical knowledge with practical experience and a commitment to continuous learning.
Developing Your Own Reading Strategy
There is no one-size-fits-all approach to reading the market. Successful investors often develop a personalized strategy that integrates elements of both fundamental and technical analysis, tailored to their investment goals, risk tolerance, and time horizon. Long-term investors might lean more heavily on fundamental analysis, focusing on a company’s intrinsic value and long-term growth prospects. Short-term traders, on the other hand, might prioritize technical analysis, using charts and indicators to identify quick trading opportunities. The key is to find a methodology that resonates with you and consistently apply it.
The Importance of Practice and Patience
Reading the stock exchange is a skill that improves with practice. Many online platforms offer paper trading (simulated trading) accounts, which allow you to practice making buy and sell decisions with virtual money in a real-time market environment. This is an invaluable tool for testing strategies, familiarizing yourself with market dynamics, and learning from mistakes without financial risk. Patience is equally crucial; the stock market rewards disciplined investors who avoid emotional decisions driven by fear or greed. Understanding that market fluctuations are normal and sticking to your long-term plan, even during volatile periods, is vital for success.
Leveraging Modern Financial Tools
Today’s investors have access to an unprecedented array of tools and resources that can significantly enhance their ability to read the stock exchange.
-
Brokerage Platforms: Most online brokers offer advanced charting tools, research reports, news feeds, and fundamental data.
-
Financial News Websites: Reputable sources like The Wall Street Journal, Bloomberg, Reuters, and specialized financial news sites provide real-time news, analysis, and market commentary.
-
Analytical Software: More sophisticated software and platforms offer advanced screening capabilities, backtesting tools, and proprietary indicators.
-
Community Forums and Social Media: While requiring careful discernment, online communities can offer different perspectives and insights, though always verify information independently.
Embracing these tools can streamline your research, improve your analytical capabilities, and keep you informed about market developments.

Conclusion
Learning to read the stock exchange is a continuous journey that transforms you from a casual observer into an informed participant in the global financial markets. It involves mastering a specialized language, understanding how to navigate data-rich interfaces, and applying both fundamental and technical analysis to uncover insights. While initially daunting, each piece of the puzzle—from deciphering ticker symbols and market indices to interpreting financial statements and chart patterns—builds upon the last, gradually revealing the market’s underlying logic. By committing to continuous learning, practicing diligently, and leveraging modern financial tools, you can develop the expertise to make intelligent investment decisions, manage your wealth effectively, and confidently navigate the dynamic world of the stock exchange. The market is constantly evolving, but with a solid foundation, you’ll be well-equipped to read its signals and adapt your strategy for long-term financial success.
aViewFromTheCave is a participant in the Amazon Services LLC Associates Program, an affiliate advertising program designed to provide a means for sites to earn advertising fees by advertising and linking to Amazon.com. Amazon, the Amazon logo, AmazonSupply, and the AmazonSupply logo are trademarks of Amazon.com, Inc. or its affiliates. As an Amazon Associate we earn affiliate commissions from qualifying purchases.