
In the world of personal finance and global markets, few terms are uttered with as much frequency or gravity as “the Dow” and “the Nasdaq.” For the seasoned investor, these names represent the heartbeat of the American economy. For the newcomer, they can often seem like abstract numbers flashing across a television screen or a mobile banking app. However, understanding what these indices are, how they function, and what they reveal about the financial landscape is a fundamental requirement for anyone looking to build wealth through the stock market.

To navigate the complexities of modern investing, one must look beyond the daily points gained or lost. These indices are more than just trackers; they are barometers of economic health, reflections of investor sentiment, and benchmarks against which individual portfolio performance is measured. By deconstructing the Dow Jones Industrial Average and the Nasdaq Composite, we can better understand the underlying forces that drive market cycles and personal net worth.
The Dow Jones Industrial Average: The Pulse of Blue-Chip America
The Dow Jones Industrial Average (DJIA), often referred to simply as “the Dow,” is one of the oldest and most recognized stock market indices in the world. Founded by Charles Dow and Edward Jones in 1896, it was originally designed to track the performance of the industrial sector within the American economy. While the name still includes the word “industrial,” the index has evolved significantly over the last century to reflect a broader cross-section of the U.S. economy.
The 30 Giants of Industry
Unlike other indices that track hundreds or thousands of companies, the Dow is comprised of only 30 “blue-chip” companies. These are large, publicly owned corporations based in the United States that are considered leaders in their respective industries. To be included in the Dow, a company must have an excellent reputation, demonstrate sustained growth, and command significant interest from a wide range of investors.
The composition of the Dow is not static. A committee at S&P Dow Jones Indices regularly reviews the components to ensure the index remains representative of the current economic environment. When a company loses its market dominance or when a new industry becomes vital to the U.S. economy, the committee replaces underperforming stocks with more relevant ones. This is why you will find names like Apple, Microsoft, and Goldman Sachs alongside traditional industrial powerhouses like Boeing and Caterpillar.
How the Dow is Calculated: The Price-Weighted Model
The most unique—and sometimes controversial—aspect of the Dow is its calculation method. The DJIA is a price-weighted index. This means that the index level is determined by the share prices of the 30 companies it tracks, rather than their total market value (market capitalization).
In a price-weighted system, a stock with a higher price per share has a greater influence on the movement of the index than a stock with a lower price, regardless of the actual size of the company. To prevent stock splits or dividends from distorting the index, the sum of the prices is divided by a “Dow Divisor,” a figure that is adjusted whenever there are structural changes to the component stocks. While critics argue that this method is outdated because it ignores the relative size of a company’s total valuation, the Dow remains a trusted indicator of the health of established, dividend-paying corporations.
The Nasdaq Composite: The Engine of Innovation and Technology
While the Dow represents the established guard of the American economy, the Nasdaq is often viewed as the frontier of growth and innovation. The Nasdaq Composite is a market index that includes almost all the stocks listed on the Nasdaq Stock Market—totaling more than 3,000 components. Since its inception in 1971, the Nasdaq has become synonymous with the technology sector, though it encompasses much more.
The Tech-Heavy Benchmark
The Nasdaq is heavily weighted toward growth-oriented industries. Technology, biotechnology, and internet-based services make up the lion’s share of the index. If you are looking to track the performance of “Big Tech”—companies like Alphabet (Google), Amazon, Meta (Facebook), and Tesla—the Nasdaq is the primary lens through which to view them.
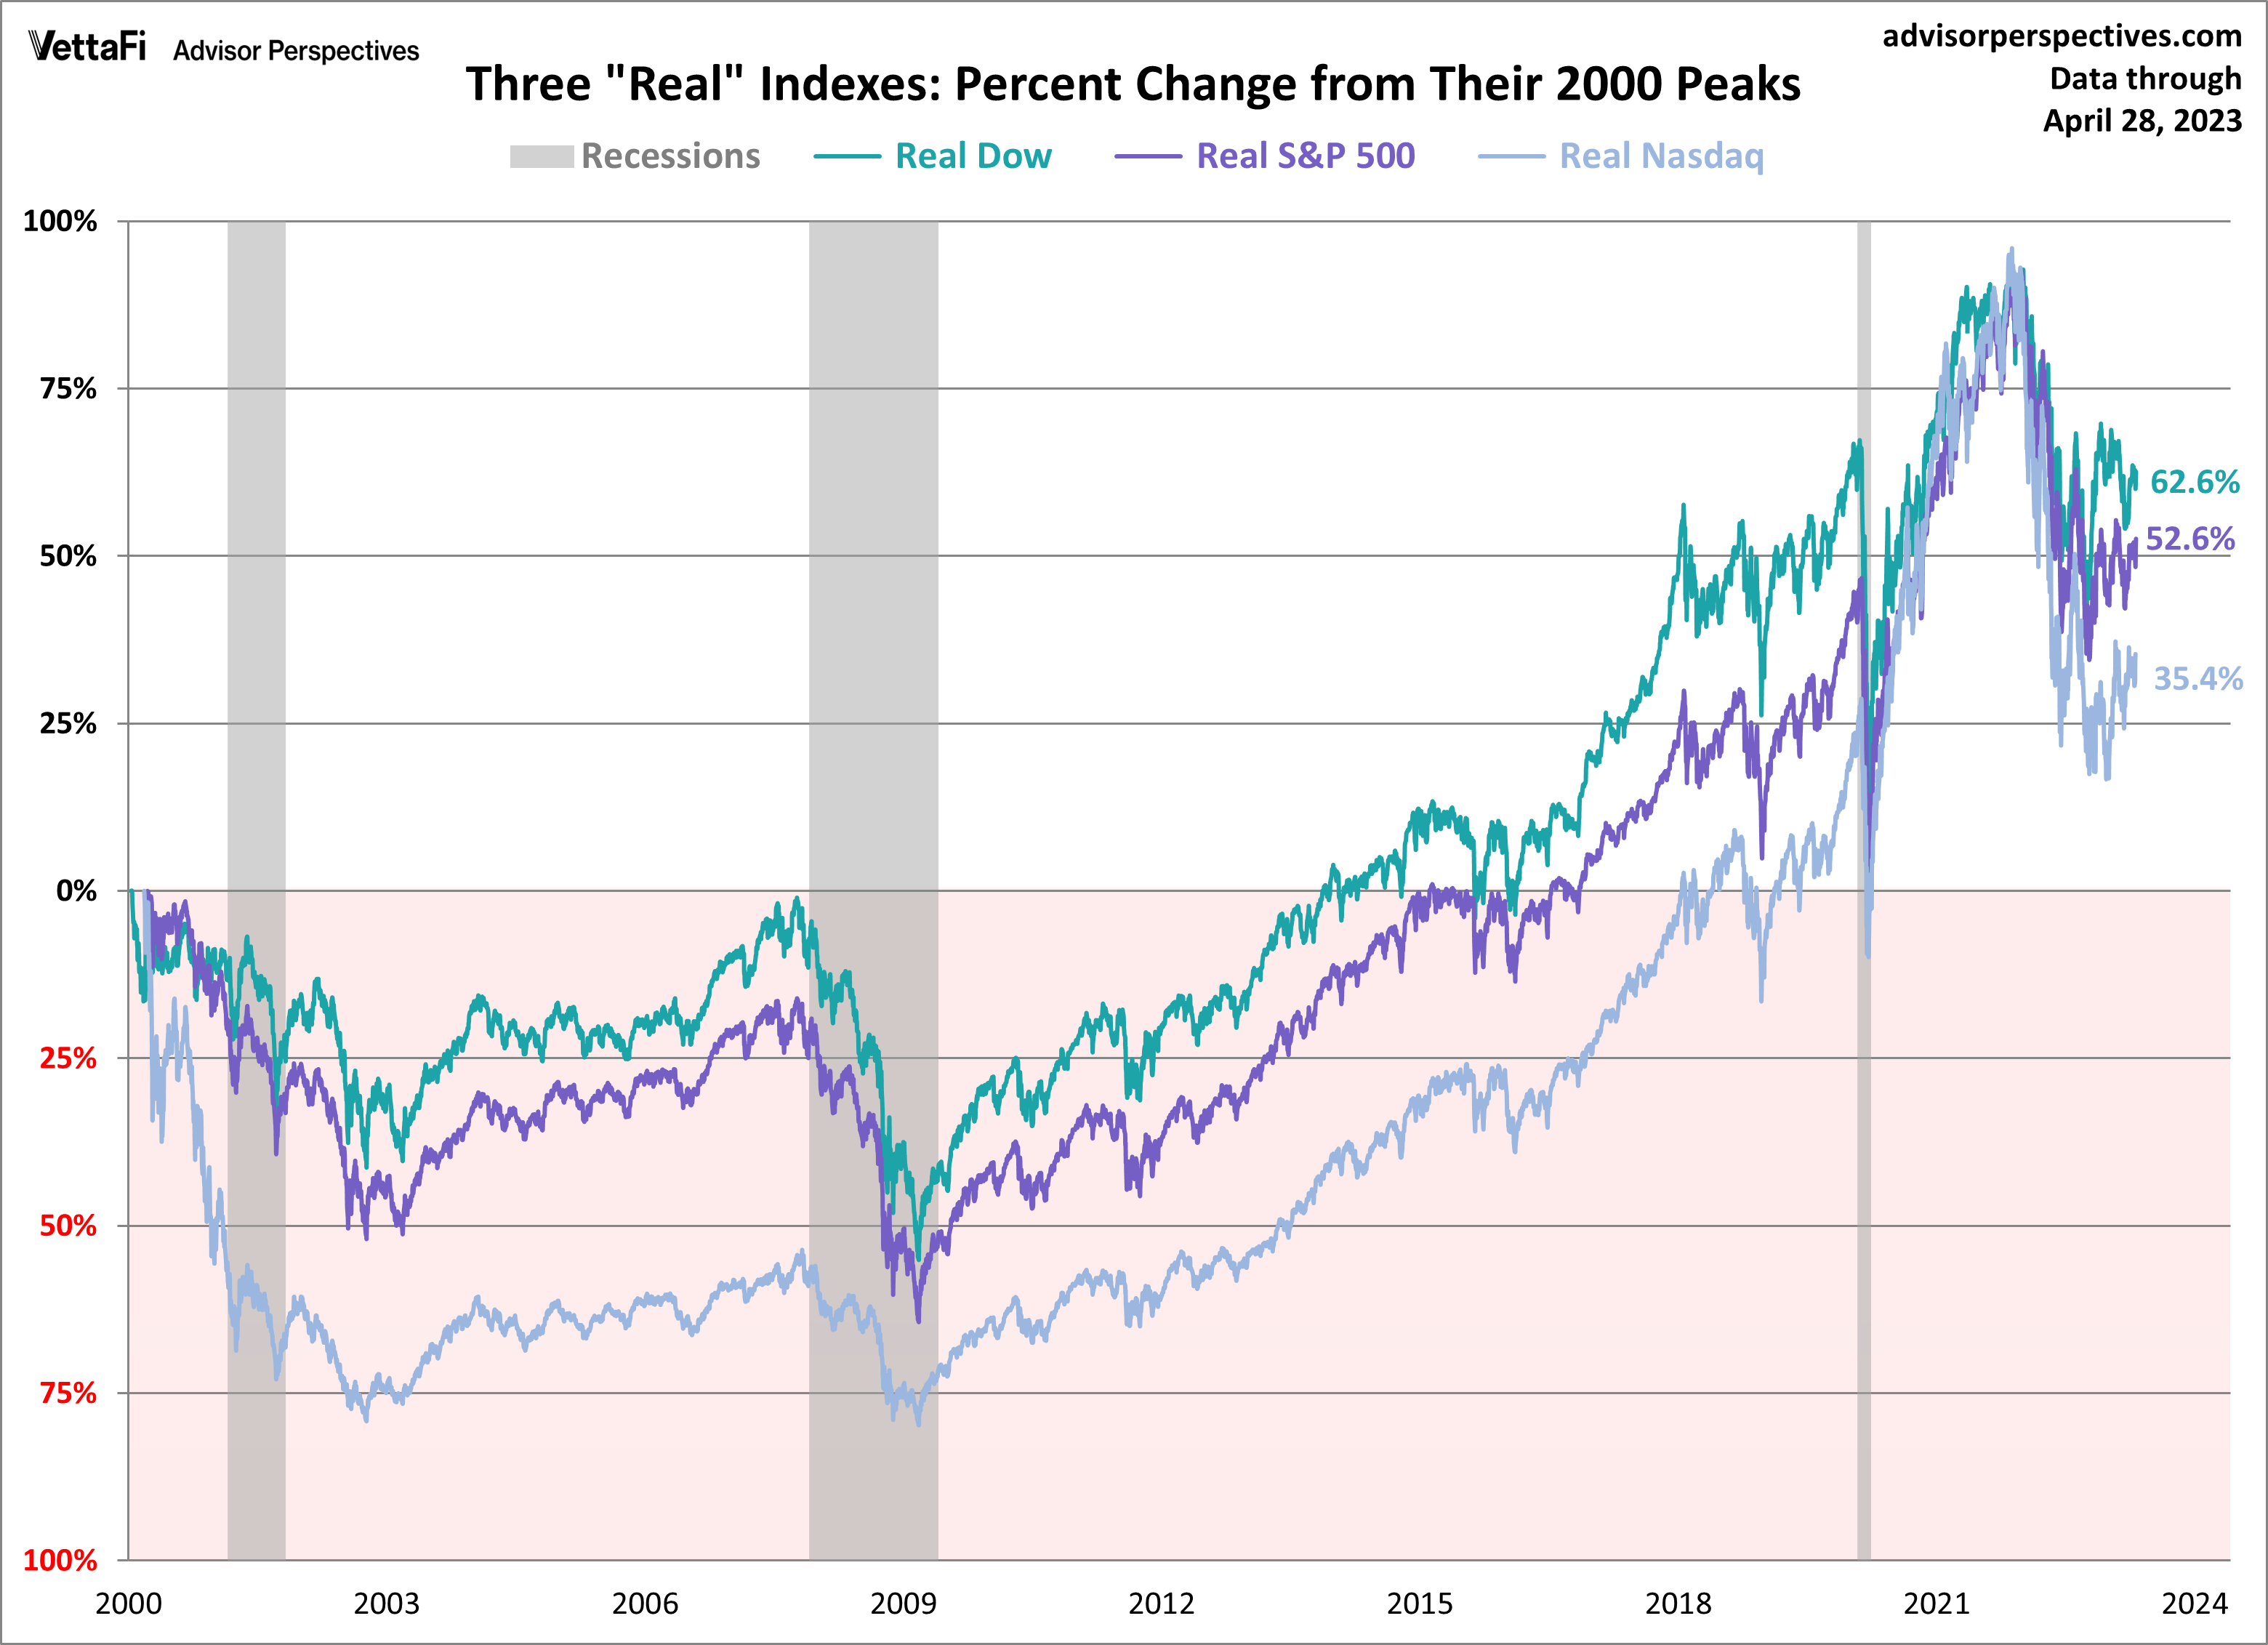
Because of its high concentration in technology and growth stocks, the Nasdaq is generally more volatile than the Dow. During periods of economic expansion and low-interest rates, the Nasdaq often outperforms other indices as investors pour capital into high-growth potential companies. Conversely, during periods of rising interest rates or economic uncertainty, the Nasdaq can experience sharper declines as investors shift away from speculative growth and toward safer, value-oriented assets.
Market Capitalization Weighting Explained
Unlike the Dow, the Nasdaq Composite uses a market-capitalization-weighted methodology. In this system, the influence of a company on the index is proportional to its total market value (share price multiplied by the number of outstanding shares).
This approach is widely considered by modern economists to be a more accurate reflection of the market’s reality. In a cap-weighted index, a 1% move in a trillion-dollar company like Microsoft has a much larger impact on the index than a 1% move in a small-cap software firm. This ensures that the index reflects where the majority of investor capital is actually moving, making it a vital tool for those focused on high-growth equity investing.
Critical Differences Between the Two Powerhouses
For an investor, understanding the differences between the Dow and the Nasdaq is essential for asset allocation and risk management. While they both move in the same general direction over the long term, their day-to-day behavior can diverge significantly based on sector rotations and macroeconomic news.
Sector Diversity vs. Tech Concentration
The primary difference lies in what they represent. The Dow is a diversified snapshot of the broad economy, including financials, healthcare, consumer staples, and industrials. If the “old economy” is doing well—think banks and manufacturing—the Dow will likely reflect that strength.
The Nasdaq, on the other hand, is the heartbeat of the “new economy.” It is the primary indicator for the digital revolution, cloud computing, and artificial intelligence. When an investor talks about “the market” being up or down, they may be referring to the Dow if they are focused on stability, or the Nasdaq if they are focused on innovation and high-yield potential.
Methodological Divergence: Price vs. Market Value
The difference in calculation (price-weighted vs. market-cap-weighted) leads to different behaviors during market events. For example, if a high-priced stock in the Dow has a bad day, it can pull the entire index down even if the other 29 stocks are performing well. In the Nasdaq, the index is much more susceptible to the movements of the “Magnificent Seven” or other mega-cap tech stocks. Understanding these mechanics prevents an investor from being misled by a headline number without looking at the underlying drivers.
How to Use These Indices to Drive Your Investment Strategy
Monitoring the Dow and the Nasdaq should not just be a passive activity. Successful personal finance management involves using these indices as tools to inform your buying, selling, and holding decisions.
Benchmarking Your Portfolio
One of the most practical uses of these indices is benchmarking. If your investment strategy is focused on long-term, stable growth through dividend-reinvesting stocks, your portfolio performance should be compared against the Dow. If you are an aggressive investor seeking high returns through tech stocks and startups, the Nasdaq is your yardstick.
If the Nasdaq is up 20% in a year and your growth-oriented portfolio is only up 5%, it may be time to re-evaluate your stock selection or consider low-cost Index Funds or Exchange-Traded Funds (ETFs). By comparing your personal returns to these benchmarks, you can objectively determine if your strategy is adding value or if you would be better off with a passive investment approach.
Tracking Market Sentiment and Economic Trends
The relationship between the Dow and the Nasdaq can also signal broader economic shifts. For instance, a “divergence”—where the Dow is rising but the Nasdaq is falling—often indicates a “flight to quality.” This happens when investors become nervous about high valuations in tech and move their money into the “safer” blue-chip companies of the Dow.
For a savvy investor, these signals are opportunities. A sharp drop in the Nasdaq might represent a buying opportunity for long-term growth stocks at a discount, while a stagnant Dow might suggest that traditional sectors are facing headwinds like inflation or supply chain disruptions.
Investing via ETFs and Index Funds
For many, the best way to interact with the Dow and the Nasdaq is not by picking individual stocks, but by investing in the indices themselves. You cannot “buy” an index directly, but you can buy ETFs that mirror them.
-
DIA (SPDR Dow Jones Industrial Average ETF Trust): This allows you to own a piece of all 30 Dow companies in a single trade.
-
QQQ (Invesco QQQ Trust): This tracks the Nasdaq-100 (the 100 largest non-financial companies on the Nasdaq), providing concentrated exposure to the world’s leading innovation companies.
By incorporating these tools into a broader financial plan, investors can achieve diversification, lower their management fees, and participate in the long-term upward trajectory of the American economy. Whether you prefer the steady reliability of the Dow or the high-octane growth of the Nasdaq, understanding these two pillars of finance is the first step toward achieving lasting financial independence.
aViewFromTheCave is a participant in the Amazon Services LLC Associates Program, an affiliate advertising program designed to provide a means for sites to earn advertising fees by advertising and linking to Amazon.com. Amazon, the Amazon logo, AmazonSupply, and the AmazonSupply logo are trademarks of Amazon.com, Inc. or its affiliates. As an Amazon Associate we earn affiliate commissions from qualifying purchases.