
In an increasingly data-driven world, understanding and accurately calculating percentages is no longer just an academic exercise; it is an indispensable life skill, particularly within the realm of personal and business finance. From evaluating investment returns and dissecting budget allocations to understanding loan interest and navigating sales discounts, percentages form the bedrock of informed financial decision-making. Far too often, individuals make suboptimal choices, or worse, fall prey to misleading figures, simply due to a lack of confidence or clarity in percentage calculations.
This article aims to demystify percentages, transforming them from a daunting mathematical concept into an accessible and powerful financial tool. We will explore the fundamental mechanics of percentage calculation, delve into their pervasive application across personal finance, investing, and business operations, and highlight common pitfalls to avoid. By the end of this comprehensive guide, you will not only be able to “figure percentage” with ease but also leverage this critical skill to enhance your financial literacy and achieve your monetary goals.
The Core Mechanics of Percentage Calculation
At its heart, a percentage is a way of expressing a number as a fraction of 100. The word “percentage” itself comes from the Latin “per centum,” meaning “by the hundred.” This fundamental understanding is key to unlocking all subsequent calculations.
Understanding the Basics: Parts, Wholes, and Rates
Every percentage calculation involves three primary components:
-
The Part: This is the specific amount or quantity you are interested in.
-
The Whole: This is the total amount or the base against which the part is being compared.
-
The Rate (Percentage): This is the ratio of the part to the whole, expressed as a fraction of 100.
For example, if you earned $50 interest on an initial investment of $1,000, the interest ($50) is the part, the initial investment ($1,000) is the whole, and the interest rate (5%) is the rate.
Essential Formulas: Percentage of a Number, Percentage Change
Mastering a few core formulas will equip you for almost any percentage-related financial scenario:
-
Finding a Percentage of a Number: To find ‘X’ percent of a number ‘Y’, you convert the percentage to a decimal (divide by 100) and then multiply it by the number.
-
Formula: Percentage Value = (Percentage Rate / 100) × Whole Number
-
Example: What is 20% of $500? (20 / 100) × $500 = 0.20 × $500 = $100.
-
-
Calculating What Percentage One Number Is of Another: To determine what percentage ‘X’ is of ‘Y’, divide ‘X’ by ‘Y’ and then multiply by 100.
-
Formula: Percentage Rate = (Part / Whole) × 100
-
Example: If you spent $150 on groceries from a $1,000 income, what percentage of your income went to groceries? ($150 / $1,000) × 100 = 0.15 × 100 = 15%.
-
-
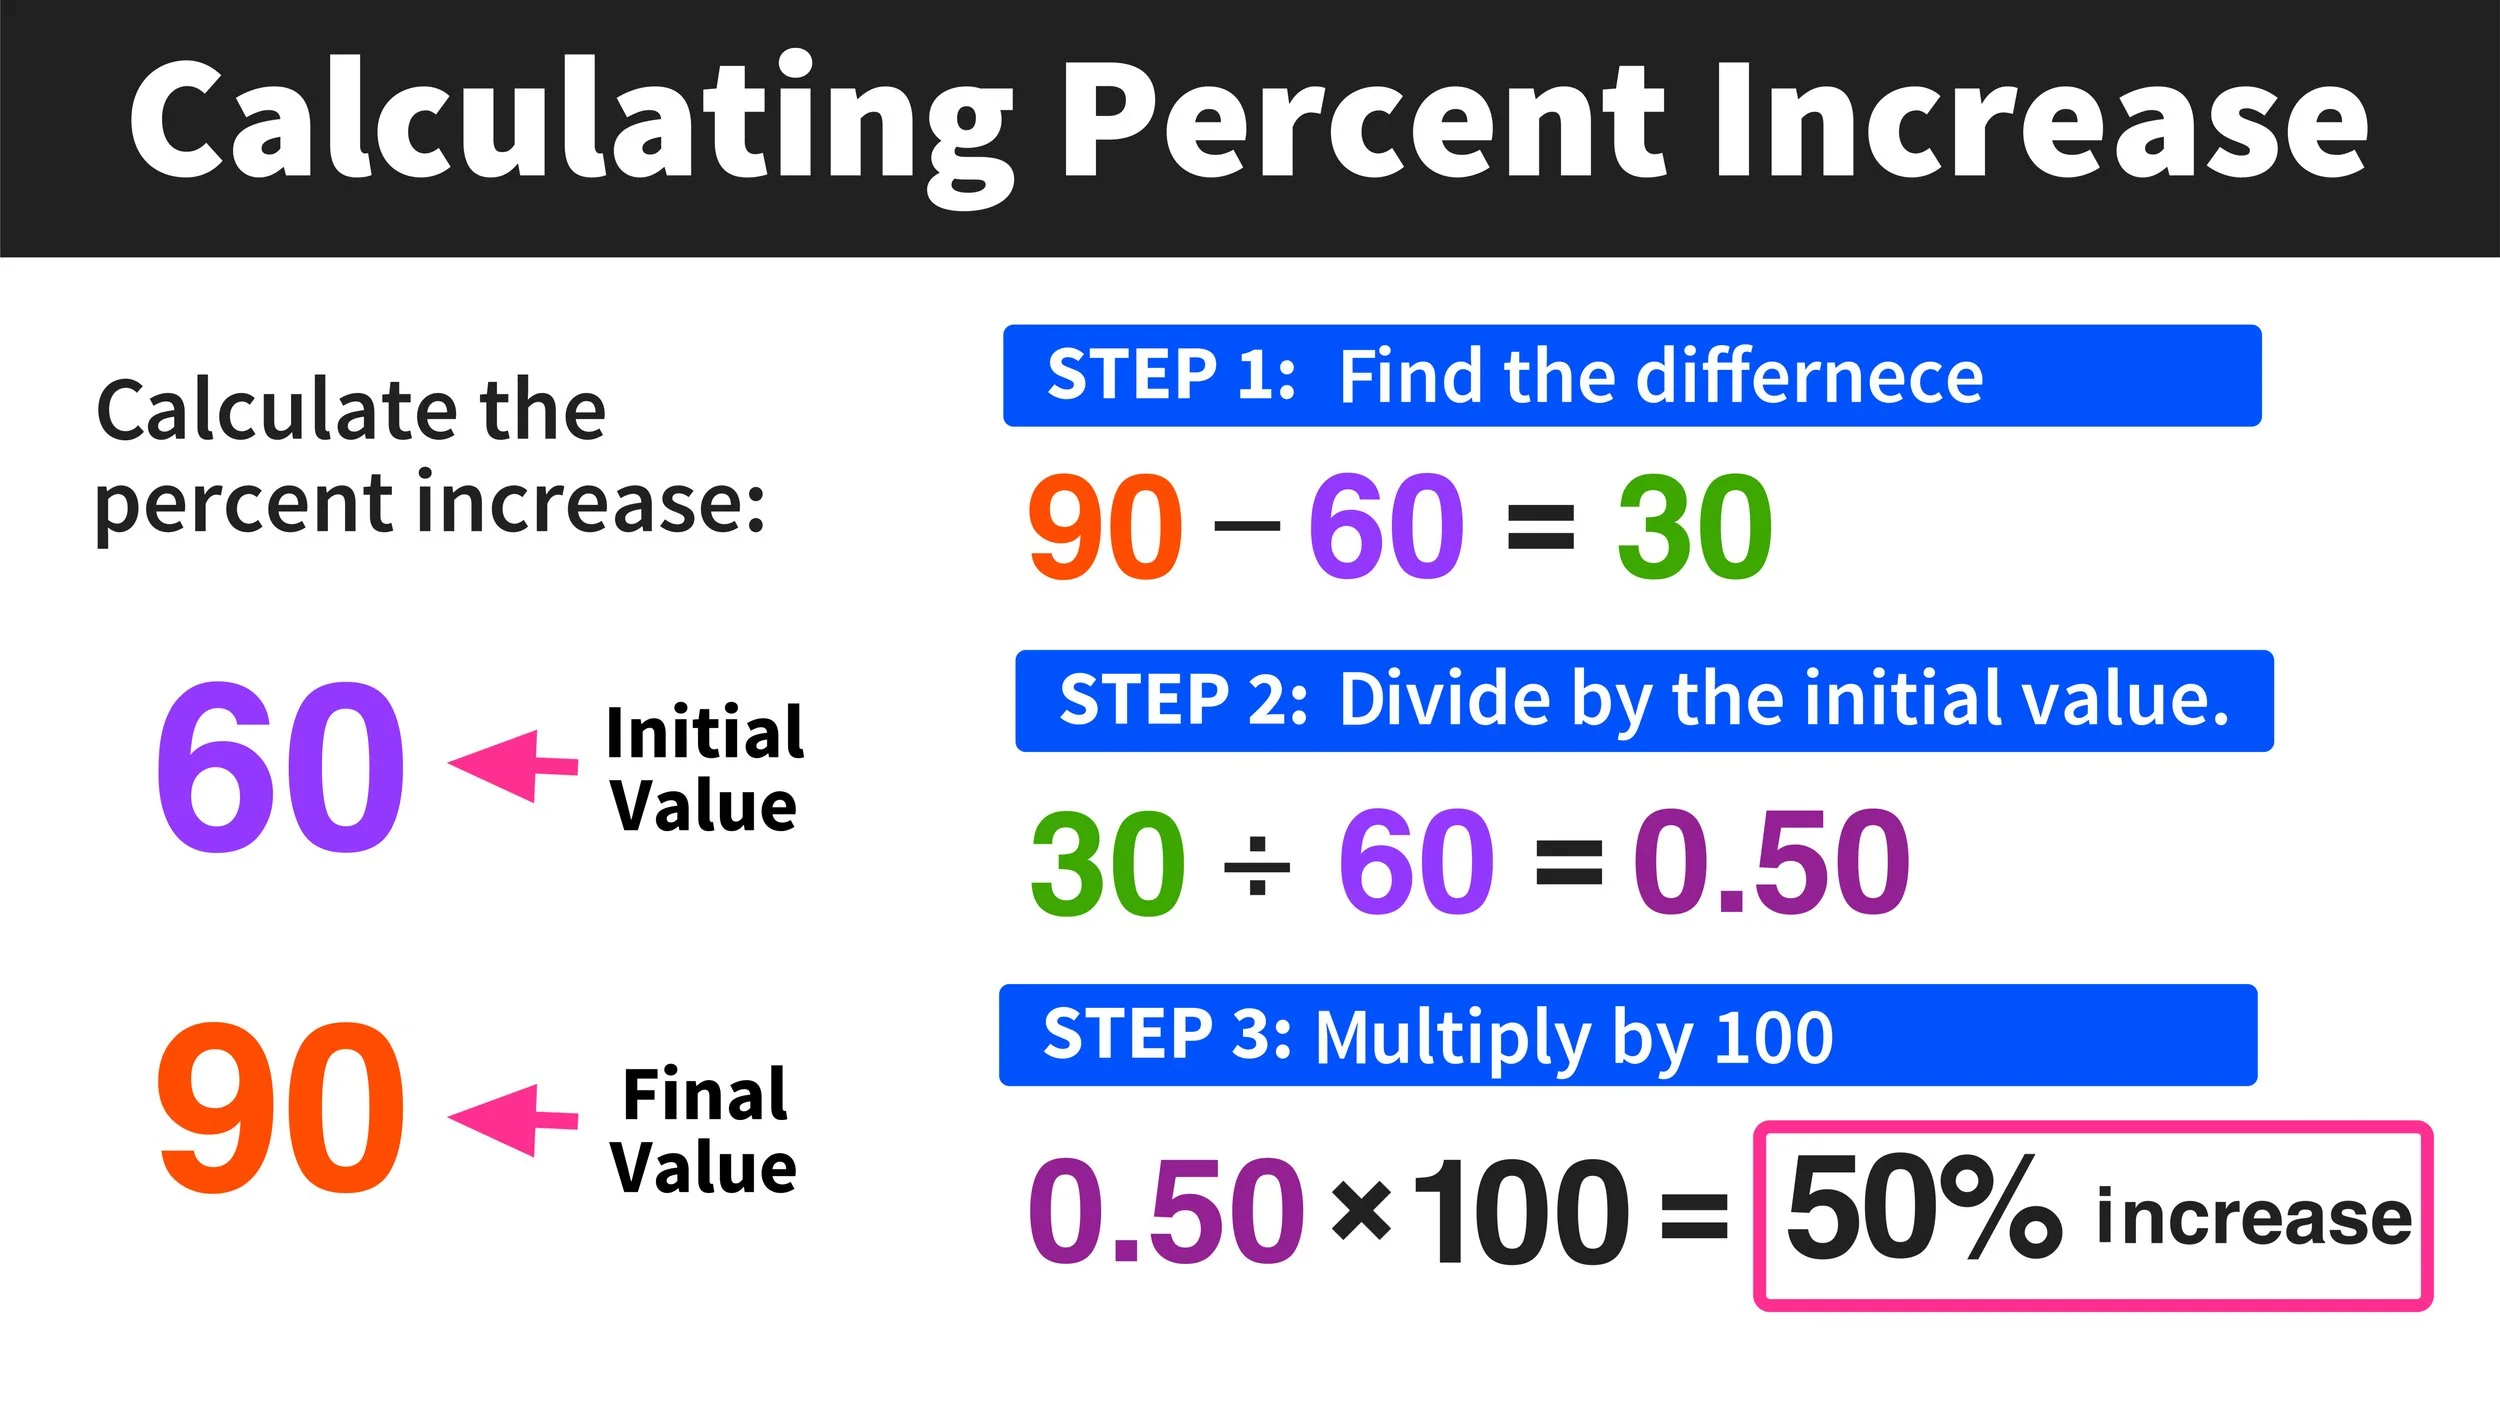
Calculating Percentage Change (Increase or Decrease): This is crucial for tracking growth or decline.
-
Formula: Percentage Change = ((New Value – Original Value) / Original Value) × 100
-
Example (Increase): Your investment grew from $1,000 to $1,200. Percentage change = (($1,200 – $1,000) / $1,000) × 100 = ($200 / $1,000) × 100 = 0.20 × 100 = 20% increase.
-
Example (Decrease): A stock dropped from $50 to $40. Percentage change = (($40 – $50) / $50) × 100 = (-$10 / $50) × 100 = -0.20 × 100 = -20% decrease.
-
Practical Tools: Calculators, Spreadsheets, and Mental Math
While the formulas are foundational, practical application often involves tools:
-
Standard Calculators: Most basic calculators have a ‘%’ key. Understanding how it works (e.g., 500 + 20% might add 20% of 500 to 500) is important, but direct decimal conversion is often more reliable.
-
Spreadsheets (Excel, Google Sheets): These are invaluable for complex financial modeling. Functions like
PERCENTAGE, direct cell division and multiplication by 100, and formatting options make percentage calculations efficient for budgets, investment tracking, and business reports. -
Mental Math: For simple percentages (10%, 25%, 50%), developing mental shortcuts (e.g., 10% is moving the decimal one place left) can save time and foster quicker financial insights.
Percentages in Personal Finance Management
Percentages are the language of personal finance, guiding every aspect of how you earn, save, spend, and manage debt.
Budgeting and Expense Tracking: Allocating Income
Effective budgeting relies heavily on percentages. The popular “50/30/20 rule” (50% needs, 30% wants, 20% savings/debt repayment) is a prime example of percentage-based allocation. By categorizing your expenses and calculating what percentage each category consumes of your total income, you gain clear visibility into your spending habits. This allows you to identify areas for reduction, reallocate funds, and ensure your spending aligns with your financial goals. Without percentages, budgeting would be a chaotic tally of absolute numbers, lacking the crucial context of proportion.
Savings and Debt: Interest Rates and Amortization
Whether you’re saving for retirement or paying down a mortgage, interest rates—expressed as percentages—dictate the pace of your financial journey.
-
Savings Accounts & Investments: Understanding annual percentage yield (APY) helps you compare different savings vehicles and project future growth. The higher the APY, the faster your money grows due to compounding interest.
-
Loans & Credit Cards: Annual percentage rate (APR) is critical for debt. A credit card with a 20% APR means you’re paying a significant amount for the privilege of borrowing. Understanding how these percentages translate into monthly payments and total interest paid over the life of a loan (amortization) is vital for minimizing debt costs and choosing the right financial products.
Discounts, Sales, and Taxes: Making Informed Purchasing Decisions
Every shopping trip involves percentages. From a “25% off” sale to a “7% sales tax,” these figures directly impact your purchasing power. Calculating the final price after a discount (e.g., a $100 item with 25% off is $100 – (0.25 * $100) = $75) or figuring out the added tax (e.g., $75 + (0.07 * $75) = $80.25) ensures you’re never surprised at the checkout and always get the best deal. Smart consumers also use percentages to compare unit prices and assess the true value of bulk purchases.
Percentages in Investing and Wealth Building
For anyone looking to grow their wealth, percentages are the compass that guides investment decisions and measures performance.

Calculating Returns on Investment (ROI)
ROI is perhaps the most fundamental percentage in investing. It tells you how much profit or loss you made relative to your initial investment.
-
Formula: ROI = ((Current Value – Original Investment) / Original Investment) × 100
-
A 15% ROI indicates a healthy gain, while a negative ROI signals a loss. Comparing ROIs across different investments is key to assessing their effectiveness and making informed portfolio adjustments.
Understanding Compounding and Growth
Albert Einstein reportedly called compound interest the “eighth wonder of the world.” Understanding it requires a firm grasp of percentages over time. Compounding means earning returns not only on your initial investment but also on the accumulated interest from previous periods. Even a seemingly small percentage return, compounded consistently over decades, can lead to substantial wealth accumulation. Conversely, understanding the compounding effect of high-interest debt can highlight the urgency of repayment.
Risk Assessment and Portfolio Allocation
Diversification, a cornerstone of sound investment strategy, is fundamentally a percentage game. Investors allocate percentages of their portfolio to different asset classes (e.g., 60% stocks, 30% bonds, 10% cash) to manage risk. These percentages are often adjusted based on age, risk tolerance, and market conditions. Understanding how a 5% drop in one sector might impact your overall portfolio, if that sector represents 20% of your holdings, is a critical percentage-based risk assessment.
Percentages in Business Finance and Entrepreneurship
For entrepreneurs and business owners, percentages are the vital signs of a company’s health and performance, driving strategic decisions and growth.
Profit Margins and Markup
-
Gross Profit Margin: Measures the percentage of revenue left after deducting the cost of goods sold. Formula: ((Revenue – Cost of Goods Sold) / Revenue) × 100. A higher gross profit margin indicates more efficient production.
-
Net Profit Margin: Represents the percentage of revenue left after all expenses (including taxes and interest) have been deducted. Formula: ((Net Income / Revenue) × 100). This is a critical indicator of a company’s overall profitability.
-
Markup: Used to price products. If an item costs $50 to produce and you want a 50% markup, you add 50% of the cost to the cost. Formula: (Cost × Desired Markup Percentage) + Cost. This ensures products are priced to cover costs and generate profit.
Growth Rates and Market Share
Businesses constantly track growth rates to measure their expansion. Revenue growth, customer growth, and employee growth are all expressed as percentages, often calculated using the percentage change formula. Furthermore, understanding a company’s market share—the percentage of total sales in an industry that a specific company accounts for—is crucial for assessing competitive position and strategic planning. A growing market share percentage signifies increased dominance and competitive advantage.
Financial Ratios and Performance Analysis
Business analysts and investors heavily rely on financial ratios, almost all of which are expressed as percentages.
-
Debt-to-Equity Ratio: Measures the proportion of debt financing to equity financing.
-
Return on Equity (ROE): Indicates how much profit a company generates for each dollar of shareholder equity.
-
Current Ratio: Assesses a company’s ability to meet short-term obligations.
These ratios provide a standardized way to compare a company’s performance over time and against industry peers, offering insightful percentage-based snapshots of financial health, efficiency, and leverage.
Avoiding Common Percentage Pitfalls
While percentages are powerful, they can also be misleading if not interpreted carefully. Awareness of common traps can prevent costly errors.
The Difference Between Percentage Point and Percentage Change
This is a frequent source of confusion. If a bond yield increases from 4% to 5%, that’s a 1 percentage point increase. However, the percentage change is ((5 – 4) / 4) × 100 = 25%. One describes an absolute difference, the other a relative change. Conflating the two can drastically alter one’s perception of magnitude.
Misinterpreting Data and Context
A “50% increase in sales” sounds impressive, but if sales went from $100 to $150, the absolute increase is small. Conversely, a “5% market share” might seem insignificant, but if the total market is $1 trillion, that 5% represents a massive $50 billion. Always consider the base number and the overall context when evaluating percentages. Percentages can also be manipulated by choosing different “wholes” or starting points.
The Impact of Compounding (Both Good and Bad)
While compounding can be a boon for investments, it can be a significant burden for debt. A 20% interest rate compounded monthly on a credit card balance rapidly escalates the amount owed. Failing to understand this exponential growth, both positive and negative, is a major financial pitfall.

Conclusion
Mastering the art of figuring percentages is more than just arithmetic; it’s a fundamental step towards achieving financial fluency and empowerment. From the basic calculations of a “part of a whole” to the complex interplay of interest rates in personal finance and the crucial performance indicators in business, percentages are the constant thread that weaves through every financial narrative.
By diligently practicing the core formulas, leveraging appropriate tools, and maintaining a healthy skepticism towards figures presented without context, you can transform percentages from a source of confusion into a powerful lens through which to view and manage your money. Embrace this essential skill, and you will unlock a deeper understanding of your financial landscape, enabling you to make more astute decisions, pursue more ambitious goals, and ultimately, build a more secure and prosperous future.
aViewFromTheCave is a participant in the Amazon Services LLC Associates Program, an affiliate advertising program designed to provide a means for sites to earn advertising fees by advertising and linking to Amazon.com. Amazon, the Amazon logo, AmazonSupply, and the AmazonSupply logo are trademarks of Amazon.com, Inc. or its affiliates. As an Amazon Associate we earn affiliate commissions from qualifying purchases.