
In the complex ecosystem of global finance, few documents carry as much weight as the Consumer Price Index (CPI) report. Often referred to as the “inflation report,” this monthly release from the Bureau of Labor Statistics (BLS) acts as a pulse check for the United States economy. For the average investor, the homeowner, or the professional navigating the modern business landscape, the CPI report is more than just a collection of statistics; it is a critical tool that dictates the cost of living, the trajectory of interest rates, and the long-term value of a dollar.
Understanding the nuances of the CPI report is essential for anyone looking to protect their purchasing power. Because inflation erodes the value of currency over time, knowing how it is measured and how the market reacts to it can mean the difference between a portfolio that thrives and one that merely survives.
Defining the Consumer Price Index (CPI)
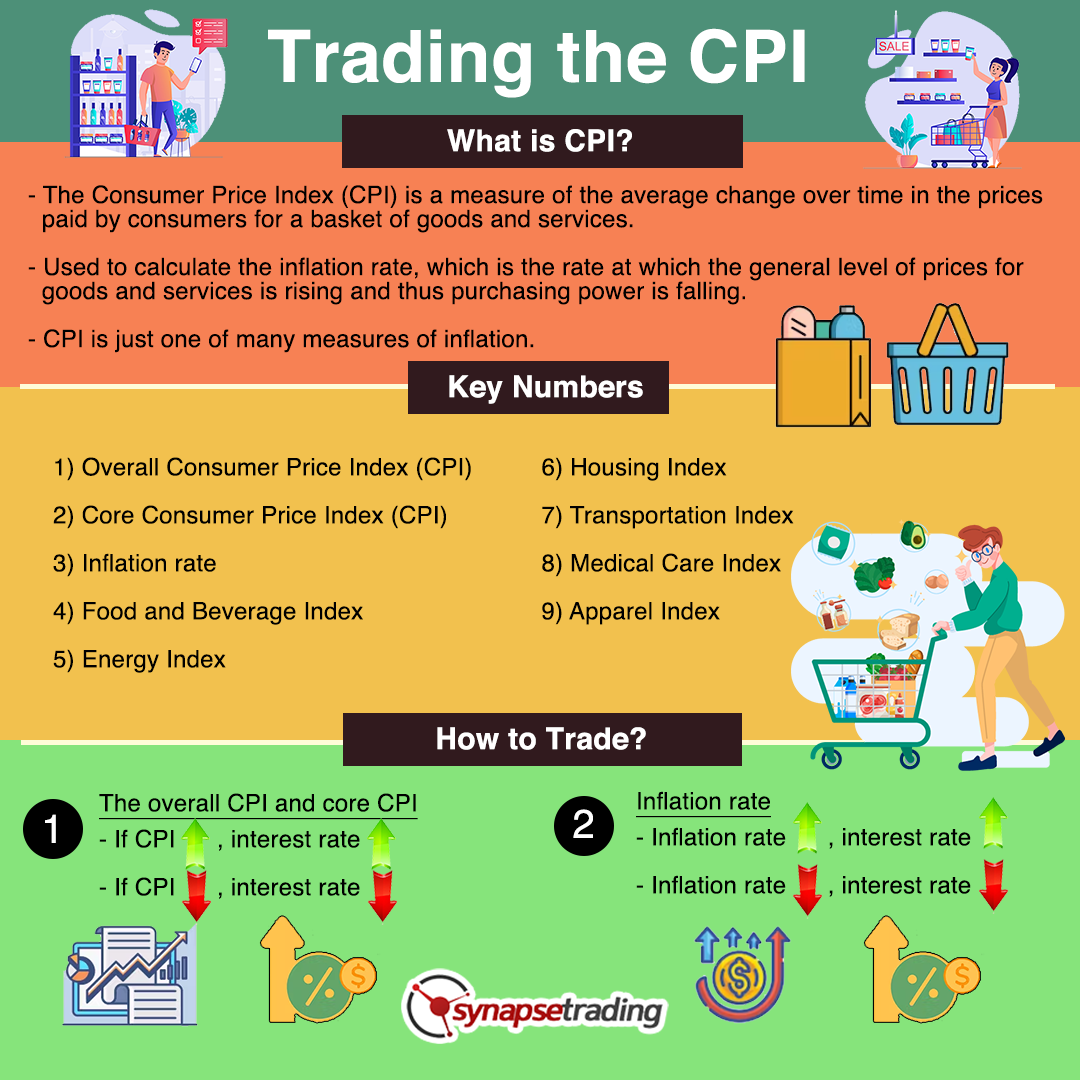
At its most fundamental level, the Consumer Price Index is a measure of the average change over time in the prices paid by urban consumers for a market basket of consumer goods and services. It is the most widely used measure of inflation and, by extension, the effectiveness of government economic policy.
The Market Basket of Goods
The BLS identifies approximately 80,000 items that represent the spending habits of the typical American household. These items are divided into over 200 categories and arranged into eight major groups: food and beverages, housing, apparel, transportation, medical care, recreation, education and communication, and other goods and services.
To ensure the data remains accurate, “economic assistants” from the BLS visit or call thousands of retail stores, service establishments, rental units, and doctor’s offices all over the United States to obtain information on the prices of these items. This granular approach ensures that the CPI reflects the real-world costs faced by consumers, from the price of a gallon of milk to the cost of a routine dental cleaning.
Headline CPI vs. Core CPI
When the CPI report is released, you will often hear economists distinguish between “Headline CPI” and “Core CPI.”
- Headline CPI: This is the raw figure that includes all items within the market basket. It provides the most accurate reflection of what consumers are actually paying at the checkout counter.
- Core CPI: This figure excludes the food and energy sectors. The reason for this exclusion is that food and energy prices tend to be highly volatile and are often influenced by factors outside of standard domestic economic conditions—such as geopolitical conflicts affecting oil supplies or weather patterns impacting crop yields. By stripping away this “noise,” Core CPI allows policymakers to see the underlying, long-term inflation trends.
How the Index is Calculated
The CPI is calculated by taking price changes for each item in the predetermined basket of goods and averaging them. The items are weighted according to their importance in the average consumer’s budget. For instance, housing (shelter) carries a much heavier weight in the index than apparel, because the average person spends a significantly larger portion of their income on rent or mortgages than they do on clothing.
Why the CPI Report Matters to Your Money
The release of the CPI report is a high-stakes event for the financial world because it serves as the primary trigger for several major economic levers. If inflation is too high, it signals that the economy may be overheating; if it is too low, it may indicate economic stagnation.
The Federal Reserve and Interest Rates
The most direct impact of the CPI report is its influence on the Federal Reserve’s monetary policy. The Fed has a “dual mandate”: to promote maximum employment and to maintain stable prices. The Fed’s target for healthy inflation is typically around 2%.
When the CPI report shows that inflation is rising significantly above that 2% target, the Federal Reserve often responds by raising the federal funds rate. Higher interest rates make borrowing more expensive for businesses and consumers, which cools spending and helps bring prices down. Conversely, if the CPI shows low inflation or deflation, the Fed may lower rates to encourage borrowing and investment. For an individual, this means the CPI report directly influences the interest rate on your mortgage, your car loan, and your credit cards.
Impact on Purchasing Power
Inflation is often called the “hidden tax.” If the CPI rises by 5% over a year, a dollar that bought a certain amount of goods at the beginning of the year can only buy 95% of those same goods at the end. For those keeping large amounts of cash in low-yield savings accounts, a high CPI reading is a warning that their wealth is being eroded in real terms. Understanding the CPI helps individuals determine if their income or investment returns are keeping pace with the cost of living.
Social Security and Cost-of-Living Adjustments (COLA)
The CPI is not just for investors; it has a massive impact on retirees and government beneficiaries. The Social Security Administration uses a specific version of the index, the CPI-W (Consumer Price Index for Urban Wage Earners and Clerical Workers), to calculate the annual Cost-of-Living Adjustment. When the CPI-W shows an increase in prices, Social Security benefits are increased to ensure that the elderly and disabled do not see a decline in their standard of living.

How to Read and Interpret CPI Data
Navigating a CPI report requires looking beyond the single percentage headline. To get a true sense of the economic landscape, one must understand how the data is presented and which components are driving the movement.
Year-over-Year (YoY) vs. Month-over-Month (MoM)
The CPI report usually highlights two main figures:
- Year-over-Year (YoY): This compares prices in the current month to the same month in the previous year. It is the best measure for looking at long-term trends and is the figure most commonly cited by the media.
- Month-over-Month (MoM): This compares the current month’s prices to the previous month. This is a more “short-term” view and can show whether inflation is accelerating or decelerating in real-time.
The Significance of the “Shelter” Component
In the modern CPI report, “shelter” is often the most scrutinized category. Because housing costs make up about one-third of the total CPI and about 40% of the Core CPI, any movement here has a disproportionate effect on the total number. Shelter costs are measured through rent and “Owners’ Equivalent Rent” (OER)—the amount a homeowner would pay to rent their own home. Because housing costs tend to be “sticky” (meaning they don’t change as quickly as gas or food prices), a rise in shelter costs often indicates that inflation will be persistent and harder for the Fed to bring down.
Base Effects
When interpreting the CPI, economists often speak of “base effects.” This refers to the influence that the data from one year ago has on the current YoY calculation. If inflation was unusually low in the prior year, even a moderate increase in prices today will look like a massive percentage jump. Conversely, if inflation was extremely high a year ago, the current YoY figure might look low even if prices are still rising. Recognizing base effects helps investors avoid overreacting to a single month’s data.
The CPI and the Financial Markets
The minutes and hours following a CPI release are often characterized by intense market volatility. Since the report dictates Fed policy, every asset class reacts to the news.
The Stock Market Reaction
Generally, the stock market prefers “Goldilocks” CPI reports—not too hot, and not too cold. If CPI comes in higher than expected, the market often sells off. This is because high inflation signals that the Fed will raise interest rates, which increases the cost of doing business and reduces the present value of future corporate earnings. Growth stocks, particularly in the tech sector, are especially sensitive to these rate hikes. On the other hand, a CPI report that shows inflation is cooling can trigger a massive rally, as it suggests the Fed may pause rate hikes or even begin cutting them.
Bonds and Yields
The bond market is perhaps the most sensitive to CPI data. Inflation is the natural enemy of the fixed-income investor. If you hold a bond that pays a 3% interest rate, but the CPI shows inflation is at 5%, you are effectively losing 2% of your wealth annually in real terms. Consequently, when CPI data is high, bond prices usually fall, and yields rise to compensate for the lost purchasing power.
The U.S. Dollar
In the foreign exchange (Forex) market, the CPI report can move the value of the U.S. Dollar (USD). High inflation often leads to higher interest rates, which attracts foreign investors looking for better returns on USD-denominated assets. This increased demand typically strengthens the dollar against other currencies.
Strategic Financial Planning for Inflationary Periods
Once you understand what the CPI report is telling you, the next step is to adjust your financial strategy accordingly. Whether the index is rising or falling, there are specific actions you can take to protect your money.
Investment Hedges
When the CPI report consistently shows high inflation, savvy investors look for “inflation hedges.” These are assets that historically retain their value or increase in price when the cost of living rises.
- TIPS (Treasury Inflation-Protected Securities): These are government bonds specifically designed to protect against inflation. The principal value of a TIPS bond increases with the CPI.
- Real Estate: Property values and rents often rise along with inflation, making real estate a popular choice for those looking to outpace the CPI.
- Commodities: Since the CPI measures the price of “stuff” (oil, gold, wheat), owning the “stuff” itself can be a hedge.
Budgeting and Debt Management
A rising CPI is a signal to revisit your personal budget. As the cost of essentials rises, your “discretionary” income—the money left over for investing and fun—shrinks. Furthermore, if the CPI report suggests that the Fed will raise interest rates, it is an ideal time to look at any variable-rate debt you might have. Switching a variable-rate credit card or mortgage to a fixed-rate option before the Fed acts can save you thousands of dollars in interest payments.

The Importance of Diversification
The CPI report reminds us that the economic environment is constantly shifting. No single asset performs well in all inflationary environments. A diversified portfolio—containing a mix of equities, fixed income, and perhaps some inflation-sensitive assets—ensures that you are prepared for whatever the next CPI report reveals.
In summary, the CPI report is more than a government document; it is a roadmap for the economy. By monitoring how the “market basket” is changing, you gain insight into the Fed’s next move, the future of your purchasing power, and the health of the global markets. In the world of money, knowledge of the CPI is the ultimate tool for long-term financial security.
aViewFromTheCave is a participant in the Amazon Services LLC Associates Program, an affiliate advertising program designed to provide a means for sites to earn advertising fees by advertising and linking to Amazon.com. Amazon, the Amazon logo, AmazonSupply, and the AmazonSupply logo are trademarks of Amazon.com, Inc. or its affiliates. As an Amazon Associate we earn affiliate commissions from qualifying purchases.