In the realms of personal finance, corporate accounting, and wealth management, raw numbers rarely tell the full story. If an investor tells you they earned $5,000 in the stock market last year, it sounds impressive in a vacuum. However, if that $5,000 gain came from a $1 million portfolio, it represents a meager 0.5% return—barely enough to keep pace with inflation. Conversely, if that same $5,000 was generated from a $10,000 investment, it represents a staggering 50% growth rate.
Understanding how to calculate percentage growth is the foundational skill that separates passive observers from savvy financial decision-makers. It provides the necessary context to evaluate the health of a business, the performance of an investment portfolio, and the trajectory of one’s personal net worth. This guide will explore the mathematical mechanics of growth calculations and their strategic applications within the world of money.
Understanding the Fundamentals: The Percentage Growth Formula
To master financial analysis, one must first be comfortable with the core arithmetic of change. Percentage growth is a measure of how much a value has increased or decreased relative to its starting point, expressed as a fraction of 100.
The Basic Mathematical Formula
The universal formula for percentage growth is straightforward:
Percentage Growth = [(Current Value – Original Value) / Original Value] x 100
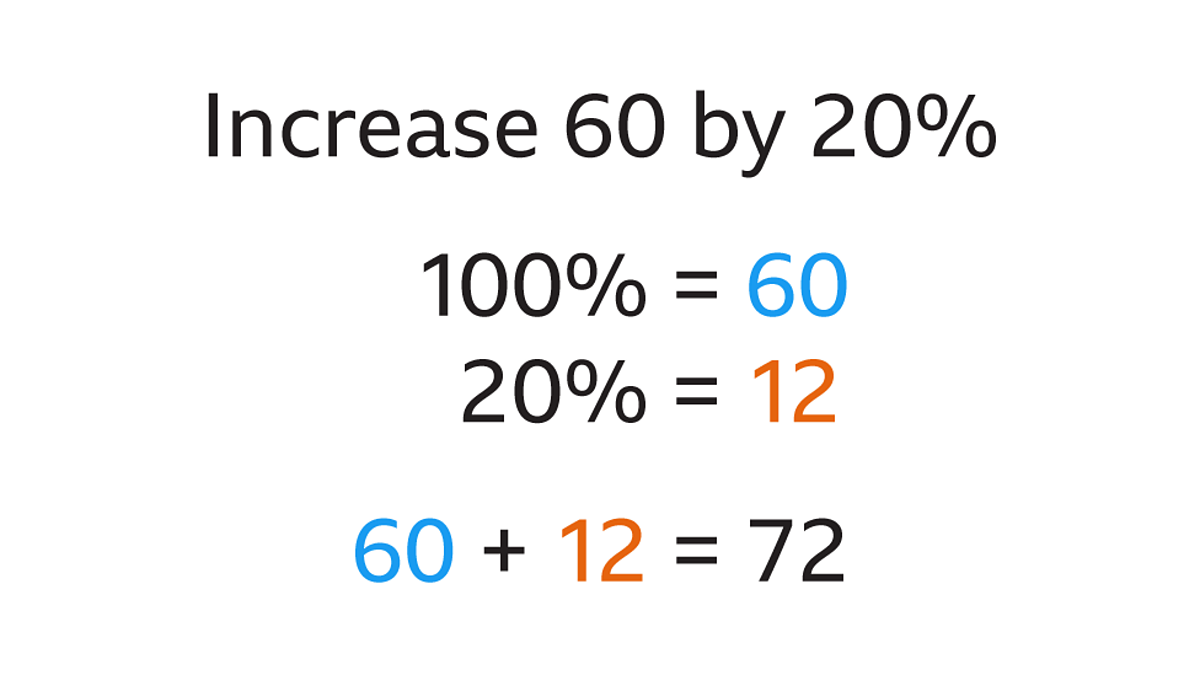
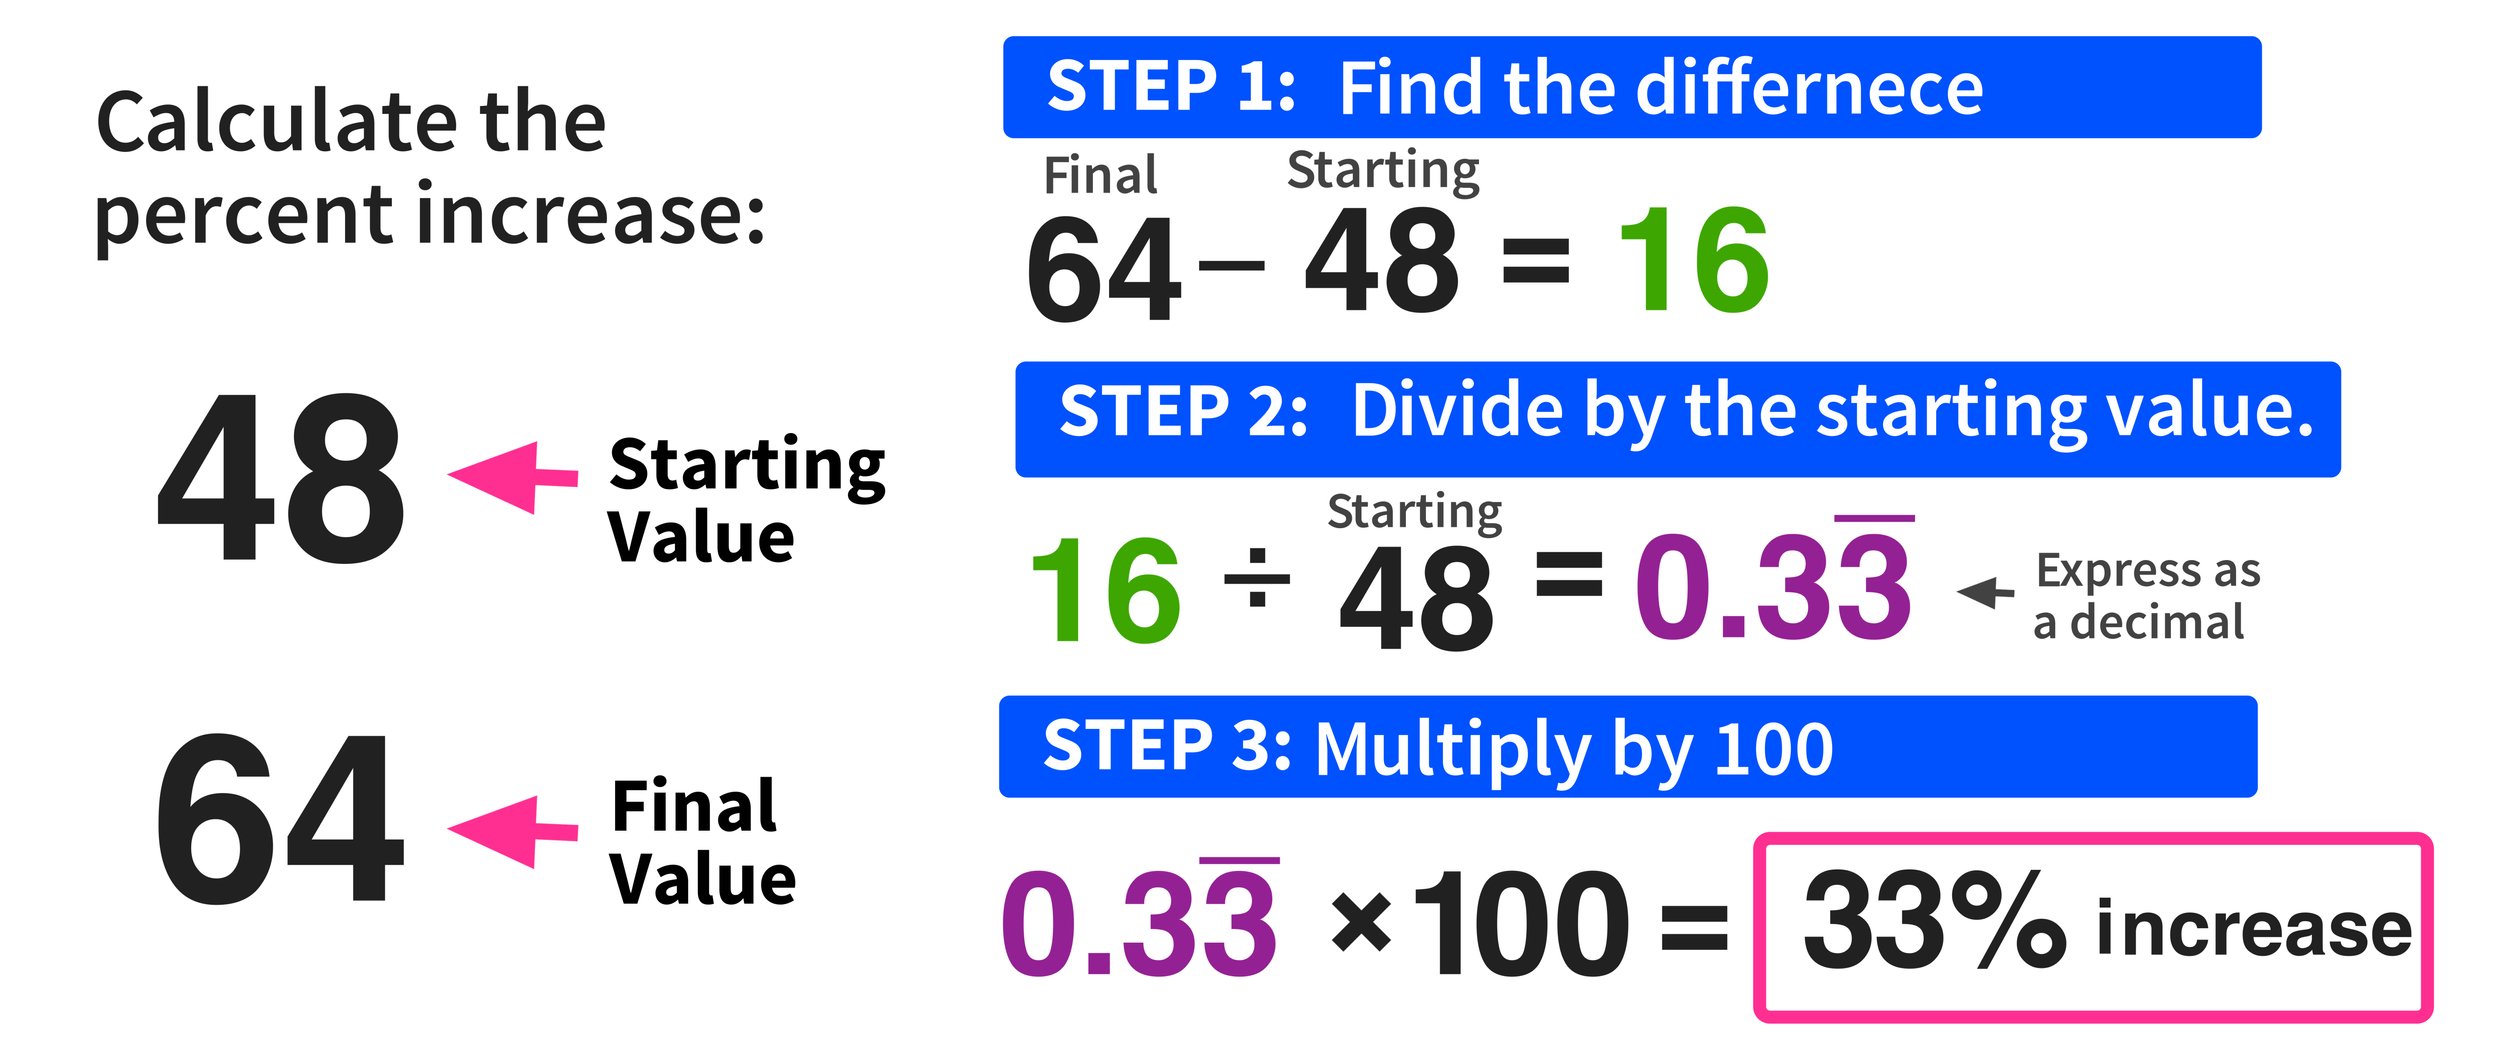
To arrive at the result, you follow three logical steps:
- Find the Difference: Subtract the original value (the starting point) from the current value (the ending point). This gives you the “absolute change.”
- Divide by the Original: Divide that absolute change by the original value. This tells you the change relative to where you started.
- Convert to Percentage: Multiply the resulting decimal by 100 to get the percentage.
For example, if a small business generated $200,000 in revenue in 2022 and $250,000 in 2023, the calculation would be: [($250,000 – $200,000) / $200,000] x 100. This results in a 25% growth rate.
Dealing with Negative Growth and Volatility
In finance, growth isn’t always upward. When the current value is lower than the original value, the formula will yield a negative result, indicating a percentage decrease or “contraction.”
It is crucial to maintain the “Original Value” as the denominator regardless of whether the trend is positive or negative. A common mistake among novice analysts is switching the denominator to the larger number to avoid negative figures. In professional financial reporting, a -10% growth rate is just as informative as a +10% rate, as it signals a need for strategic pivots or risk mitigation.
The Importance of the Base Effect
The “base effect” is a critical concept for anyone tracking financial growth. It dictates that the smaller the starting (original) value, the easier it is to achieve high percentage growth. A startup increasing its monthly recurring revenue (MRR) from $1,000 to $2,000 shows 100% growth. For a mature corporation with $10 million in MRR to achieve 100% growth, it would need to find an additional $10 million in revenue. When comparing the growth of different assets or companies, always consider the size of the “base” to ensure an apples-to-apples comparison.
Analyzing Investment Performance: Absolute vs. Annualized Growth
For the individual investor, percentage growth is the primary metric used to determine if their capital is working efficiently. However, calculating growth over a single period is often insufficient for long-term wealth planning.
Measuring Return on Investment (ROI)
Return on Investment (ROI) is the most common application of the percentage growth formula in the world of money. It measures the efficiency of an investment. In this context, the “Original Value” is the total cost of the investment (including commissions and fees), and the “Current Value” is the net proceeds if the asset were sold today.
ROI is an “absolute” growth metric. It tells you how much you made in total from start to finish. If you bought a piece of real estate for $300,000 and sold it five years later for $450,000, your absolute growth (ROI) is 50%. While 50% sounds excellent, it doesn’t account for the time it took to achieve that gain.
Compound Annual Growth Rate (CAGR)
To compare a five-year real estate investment with a one-year stock trade, professional investors use the Compound Annual Growth Rate (CAGR). CAGR provides a smoothed annual growth rate, accounting for the effects of compounding over time.
The formula for CAGR is more complex:
CAGR = [(Ending Value / Beginning Value)^(1 / Number of Years)] – 1
Using CAGR allows an investor to understand the “geometric mean” of their returns. It answers the question: “What constant annual return would have been required to get from the starting value to the ending value?” This is essential for benchmarking your portfolio against indices like the S&P 500, which typically averages a 7% to 10% CAGR over long horizons.

Factoring in Dividends and Reinvestment
When calculating the growth of equities or mutual funds, looking only at the price change (capital appreciation) provides an incomplete picture. To get an accurate “Total Return” percentage growth, you must add any dividends or interest received during the holding period to the “Current Value.”
For instance, if a stock price grew by 5%, but the company paid out a 3% dividend, your actual percentage growth for the year is closer to 8%. In the world of dividend growth investing, these incremental percentages are the primary engine of long-term wealth.
Business Finance Metrics: Scaling and Revenue Growth
For business owners and corporate executives, percentage growth is the heartbeat of the organization. It is the metric used to secure venture capital, justify budget increases, and determine executive bonuses.
Year-over-Year (YoY) and Month-over-Month (MoM) Growth
In business finance, timing is everything.
- YoY Growth compares a specific period with the same period from the previous year (e.g., Q1 2024 vs. Q1 2023). This is the gold standard for neutralizing seasonality. A retail business might see a 300% growth in December compared to November, but that is expected due to the holidays. Comparing December 2023 to December 2022 provides a much clearer picture of whether the business is actually expanding.
- MoM Growth is used by high-growth startups to track immediate traction. While more volatile, it allows management to see the immediate impact of a new marketing campaign or product launch.
Profit Margin Growth vs. Revenue Growth
One of the most dangerous traps in business finance is focusing exclusively on revenue growth while ignoring profit growth. This is often referred to as “scaling into a hole.”
If a company’s revenue grows by 20%, but its operating expenses grow by 30%, the business is actually becoming less efficient and potentially more fragile. Sophisticated financial analysis involves calculating the percentage growth of “Net Income” or “EBITDA” (Earnings Before Interest, Taxes, Depreciation, and Amortization) alongside revenue. A healthy business demonstrates “operating leverage,” where profit growth outpaces revenue growth.
Customer Acquisition Cost (CAC) and Lifetime Value (LTV)
In the modern digital economy, growth is often measured through unit economics. Professionals track the percentage change in Customer Acquisition Cost (CAC). If your CAC is growing at 15% year-over-year while your revenue per customer is only growing at 5%, your business model is under threat. Calculating these percentages allows finance teams to adjust pricing strategies or marketing spend before the bottom line is irreparably damaged.
Practical Applications in Personal Finance and Wealth Building
Beyond the boardroom and the trading floor, the ability to calculate percentage growth is a vital tool for personal financial health. It turns a static bank statement into a dynamic roadmap.
Tracking Net Worth Increases
Your net worth (Assets minus Liabilities) is the ultimate scoreboard in personal finance. However, the dollar amount of your net worth is less important than its growth rate relative to your age and financial goals. By calculating your net worth growth annually, you can determine if you are on track for retirement.
For many in the “accumulation phase” of their lives, a net worth growth rate of 10-15% is a common target. If your growth stalls, you can use percentage calculations to “drill down” into the cause: Is it due to a decrease in the growth of your investments, or a percentage increase in your debt?
Monitoring Inflation-Adjusted Growth (Real vs. Nominal)
In an era of fluctuating currency values, understanding the difference between nominal growth and real growth is paramount.
- Nominal Growth is the percentage increase calculated using current market prices.
- Real Growth is the percentage increase after adjusting for inflation.
If your high-yield savings account offers a 4% annual return, but the Consumer Price Index (CPI) shows inflation is at 5%, your “Real” growth is actually -1%. You are losing purchasing power despite the nominal balance of your account increasing. To build true wealth, your personal finance strategy must focus on achieving a positive real growth rate.
Using the Rule of 72 for Growth Projections
Once you know your average annual percentage growth, you can use the “Rule of 72” to project your financial future. This is a mental shortcut to estimate how long it will take for an investment to double. Simply divide 72 by your annual growth rate.
For example, if your investment portfolio is growing at a rate of 8% per year, it will take approximately 9 years (72 / 8) to double your money. This simple application of growth percentages is one of the most powerful tools for long-term compounding visualizations.
Conclusion: The Strategic Value of Growth Metrics
Calculating percentage growth is far more than a simple math exercise; it is a lens through which we view the effectiveness of our financial decisions. Whether you are an investor evaluating a stock’s CAGR, a business owner measuring YoY revenue, or an individual tracking net worth, the percentage is your most honest advisor.
By looking past raw numbers and focusing on relative growth, you can identify trends, spot inefficiencies, and make data-driven adjustments to your financial strategy. In the world of money, those who master the math of growth are the ones who ultimately master their future.
aViewFromTheCave is a participant in the Amazon Services LLC Associates Program, an affiliate advertising program designed to provide a means for sites to earn advertising fees by advertising and linking to Amazon.com. Amazon, the Amazon logo, AmazonSupply, and the AmazonSupply logo are trademarks of Amazon.com, Inc. or its affiliates. As an Amazon Associate we earn affiliate commissions from qualifying purchases.