
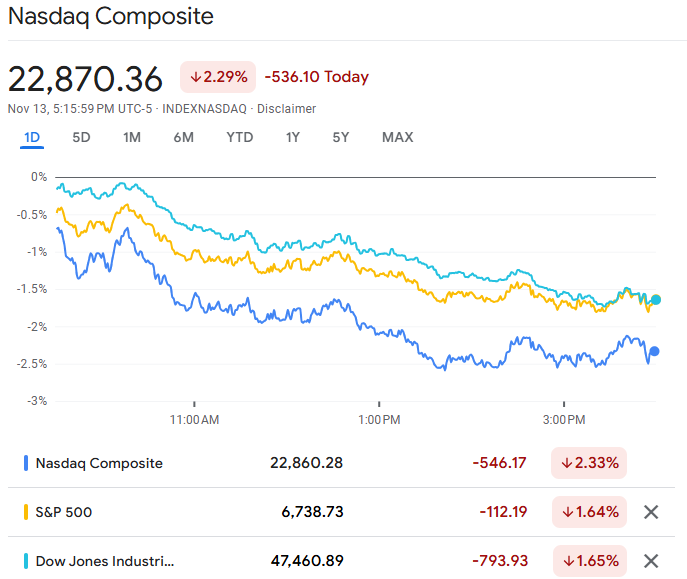
Market volatility is an inherent characteristic of the financial world, yet when the “sea of red” appears on trading screens, it often triggers a sense of urgency and concern for investors. Understanding why the market dropped today requires a multidimensional analysis of economic indicators, corporate performance, and the psychological undercurrents of global participants. While daily fluctuations are common, the drivers behind a significant downturn are usually rooted in a combination of macroeconomic shifts, geopolitical developments, or fundamental changes in investor sentiment.
To navigate these periods of uncertainty, one must look beyond the immediate price action and examine the structural factors that influence asset valuations. This article delves into the primary catalysts that lead to market drops, providing a framework for investors to interpret volatility not as a signal of doom, but as a complex interplay of financial variables.

The Macroeconomic Catalysts Behind Market Volatility
Macroeconomics serves as the foundation upon which all investment valuations are built. When the broader economic environment shifts, the market reacts—often violently. Investors are constantly discounting future expectations into today’s prices, and any disruption to those expectations can lead to a sharp sell-off.
Interest Rates and Central Bank Policy
The most potent driver of market movement in the modern era is the monetary policy set by central banks, specifically the Federal Reserve in the United States. Interest rates are effectively the “price of money.” When the market drops, it is frequently due to a hawkish shift in central bank rhetoric or an unexpected hike in interest rates.
Higher rates increase the cost of borrowing for corporations, which can eat into profit margins and stifle expansion. Furthermore, from a valuation perspective, higher interest rates increase the discount rate used in Discounted Cash Flow (DCF) models. This particularly impacts high-growth sectors, such as technology, where much of the company’s value is derived from projected future earnings. When the “risk-free rate” (yield on government bonds) rises, stocks become less attractive by comparison, leading to a reallocation of capital.
Inflationary Pressures and Consumer Sentiment
Inflation is the silent killer of purchasing power and a primary enemy of stable markets. When the Consumer Price Index (CPI) or Personal Consumption Expenditures (PIE) data comes in higher than anticipated, the market often reacts negatively.
Persistent inflation forces the hand of central banks to tighten policy, but it also impacts the “real economy.” As the cost of goods and services rises, consumer discretionary spending often declines. Since the global economy is largely driven by consumption, a pessimistic consumer outlook can lead to lower revenue projections for companies, causing their stock prices to retreat. Market drops are often the result of investors pricing in a “stagflationary” environment—slow growth combined with high inflation.
Geopolitical Tension and Global Supply Chains
The global financial system is deeply interconnected. Geopolitical instability—whether it be trade wars, regional conflicts, or changes in diplomatic relations—creates a blanket of uncertainty. Markets despise uncertainty more than they despise bad news.
A sudden drop can often be traced back to an event that threatens global supply chains. For instance, tensions in energy-producing regions can lead to a spike in oil prices, which acts as a de facto tax on both businesses and consumers. When the “geopolitical risk premium” rises, investors typically flee “risk-on” assets like stocks in favor of “safe havens” like gold or government treasuries.
Sector-Specific Slumps and Earnings Reports
While macroeconomic factors affect the entire market, sometimes a drop is triggered by specific industries or heavyweights within the indices. Because modern indices are often market-cap weighted, the performance of a handful of giant corporations can dictate the direction of the entire market.
When Blue-Chip Giants Miss the Mark
Earnings season is a critical period for market stability. Every quarter, public companies report their financial health. A market drop can often be localized to a disappointing report from a “bellwether” company. If a major tech giant or a massive retail conglomerate reports a miss on earnings or, more importantly, provides “weak guidance” for the future, it can drag down the entire index.
Guidance is the company’s own forecast of its future performance. If a CEO expresses concern about slowing demand or rising input costs, investors view this as a canary in the coal mine for the broader industry. The resulting sell-off in that specific stock can trigger algorithmic selling across related ETFs and mutual funds, magnifying the downward pressure.
The Ripple Effect of Sector Rotation
Financial markets are cyclical. Sometimes, a drop in the major indices isn’t a sign of an economic crash, but rather a “sector rotation.” This occurs when investors move money out of overvalued sectors—like high-growth tech—and into defensive sectors like utilities, healthcare, or consumer staples.
During a rotation, the selling pressure in the dominant sector can be so high that it outweighs the gains in the defensive sectors, resulting in a net drop for the day. This is often seen at the end of a long bull run in a specific niche, where valuations have become decoupled from fundamental reality, and a “reversion to the mean” becomes inevitable.
Technical Factors and Market Psychology
Not every market drop is rooted in “hard” economic data. Sometimes, the mechanics of the trading floor and the psychology of the participants are the primary culprits. In the age of high-frequency trading and social media, these factors can accelerate a decline with startling speed.
Algorithmic Trading and Liquidity Crunches
A significant portion of daily trading volume is executed by algorithms and high-frequency trading (HFT) systems. These programs are designed to react to specific price levels, news keywords, or technical indicators. If a market index breaks through a key “support level” (a price point where buying has historically been strong), it can trigger a wave of automated sell orders.
This “cascading effect” can lead to a liquidity crunch, where there are many sellers but very few buyers at a given price point. As the price falls to find buyers, the speed of the drop increases. This is why we sometimes see “flash crashes” or sudden afternoon slumps that seem disproportionate to any specific news event.
The Fear-Greed Index and Panic Selling
Investing is as much a psychological endeavor as it is a mathematical one. The human brain is wired to react to threats, and in the world of finance, a falling portfolio is perceived as a threat to one’s security. When the market begins to slip, the “Fear-Greed Index” often shifts toward “Extreme Fear.”
Panic selling occurs when investors abandon their long-term strategies and sell assets to prevent further perceived losses. This herd mentality creates a self-fulfilling prophecy: people sell because the market is dropping, and the market drops because people are selling. During these times, the “VIX” (Volatility Index), often referred to as the “fear gauge,” spikes, indicating that traders expect significant price swings in the near future.
Navigating the Downturn: Strategic Moves for Investors
When the market drops, the most successful investors are those who can separate noise from signal. While a one-day drop can feel catastrophic, it is essential to contextualize the movement within a broader financial strategy.
The Importance of Diversification Reassessment
A market drop is often a stress test for an investor’s portfolio. If a single day’s decline causes an unbearable level of financial or emotional distress, it is a sign that the portfolio may be over-concentrated in high-risk assets.
Diversification is the only “free lunch” in investing. By spreading capital across different asset classes—such as stocks, bonds, real estate, and commodities—investors can mitigate the impact of a drop in any single area. When the market drops, it is a logical time to review asset allocation and ensure that the risk profile aligns with one’s actual risk tolerance and time horizon.
Long-Term Horizon vs. Short-Term Noise
History has shown that the market spends more time going up than it does going down. However, the path upward is not a straight line; it is a jagged series of peaks and valleys. For the long-term investor, a daily market drop is often “noise”—a temporary fluctuation that has little bearing on the ultimate goal of wealth accumulation over decades.
Strategies such as Dollar-Cost Averaging (DCA) are designed to exploit these very drops. By investing a fixed amount of money at regular intervals, regardless of price, investors naturally buy more shares when prices are low and fewer when prices are high. Instead of asking “Why did the market drop?” with fear, the disciplined investor asks, “Does this drop represent a buying opportunity for quality assets at a discount?”

Conclusion
Understanding why the market dropped today requires looking at the synergy between interest rates, inflation, corporate health, and human psychology. While the immediate cause might be a specific economic report or a geopolitical event, the underlying volatility is a natural part of the price discovery process. By maintaining a professional perspective and focusing on fundamental financial principles, investors can navigate these downturns with composure, using them as moments for strategic recalibration rather than reactive panic.
aViewFromTheCave is a participant in the Amazon Services LLC Associates Program, an affiliate advertising program designed to provide a means for sites to earn advertising fees by advertising and linking to Amazon.com. Amazon, the Amazon logo, AmazonSupply, and the AmazonSupply logo are trademarks of Amazon.com, Inc. or its affiliates. As an Amazon Associate we earn affiliate commissions from qualifying purchases.