
For seasoned investors and market observers, the earnings calendar is more than just a list of dates; it is a roadmap for volatility and opportunity. Among the most anticipated reports in the global financial markets is that of Taiwan Semiconductor Manufacturing Company (TSM). As the world’s largest contract chipmaker, TSM acts as a primary barometer for the health of the global technology sector and, by extension, the broader economy. Understanding when TSM reports earnings, what to look for in their financial statements, and how to interpret their forward guidance is essential for any serious portfolio manager or retail investor.

Understanding TSM’s Earnings Cycle and Fiscal Calendar
TSM operates on a standard fiscal year that aligns with the calendar year, ending on December 31. Because the company is listed on the Taiwan Stock Exchange (TWSE) and trades as American Depositary Receipts (ADRs) on the New York Stock Exchange (NYSE), its reporting schedule follows a rigorous and predictable quarterly rhythm.
The Quarterly Rhythm
TSM typically reports its quarterly financial results during the middle of the month following the end of a quarter. Historically, investors can expect the earnings calls to occur in:
-
First Quarter (Q1): Mid-April
-
Second Quarter (Q2): Mid-July
-
Third Quarter (Q3): Mid-October
-
Fourth Quarter (Q4) and Full Year: Mid-January
The earnings release is usually accompanied by a conference call conducted in English, often held in the early morning hours (Eastern Time) to accommodate global investors. For those holding the ADRs, these announcements are pivotal, as they often set the tone for the entire semiconductor industry, influencing the stock prices of clients like Apple, Nvidia, and AMD.
Why the Date Matters for Market Volatility
The announcement date is a “binary event” for the stock. In the days leading up to the report, implied volatility often increases as option traders hedge their positions. Because TSM is a foundational component of many exchange-traded funds (ETFs) such as the SOXX (iShares Semiconductor ETF) and the VOO (Vanguard S&P 500 ETF), a beat or a miss by TSM can trigger massive capital flows across the entire tech sector. Investors who track these dates can better manage their risk, deciding whether to hold through the volatility or adjust their positions before the data hits the tape.
Key Metrics to Watch in TSM Earnings Reports
When the earnings report is finally released, the headline revenue and earnings per share (EPS) numbers are only the beginning. To truly understand TSM’s financial health and its trajectory, investors must dive deeper into specific financial metrics that reflect the company’s competitive moat and operational efficiency.
Revenue Growth and Margin Health
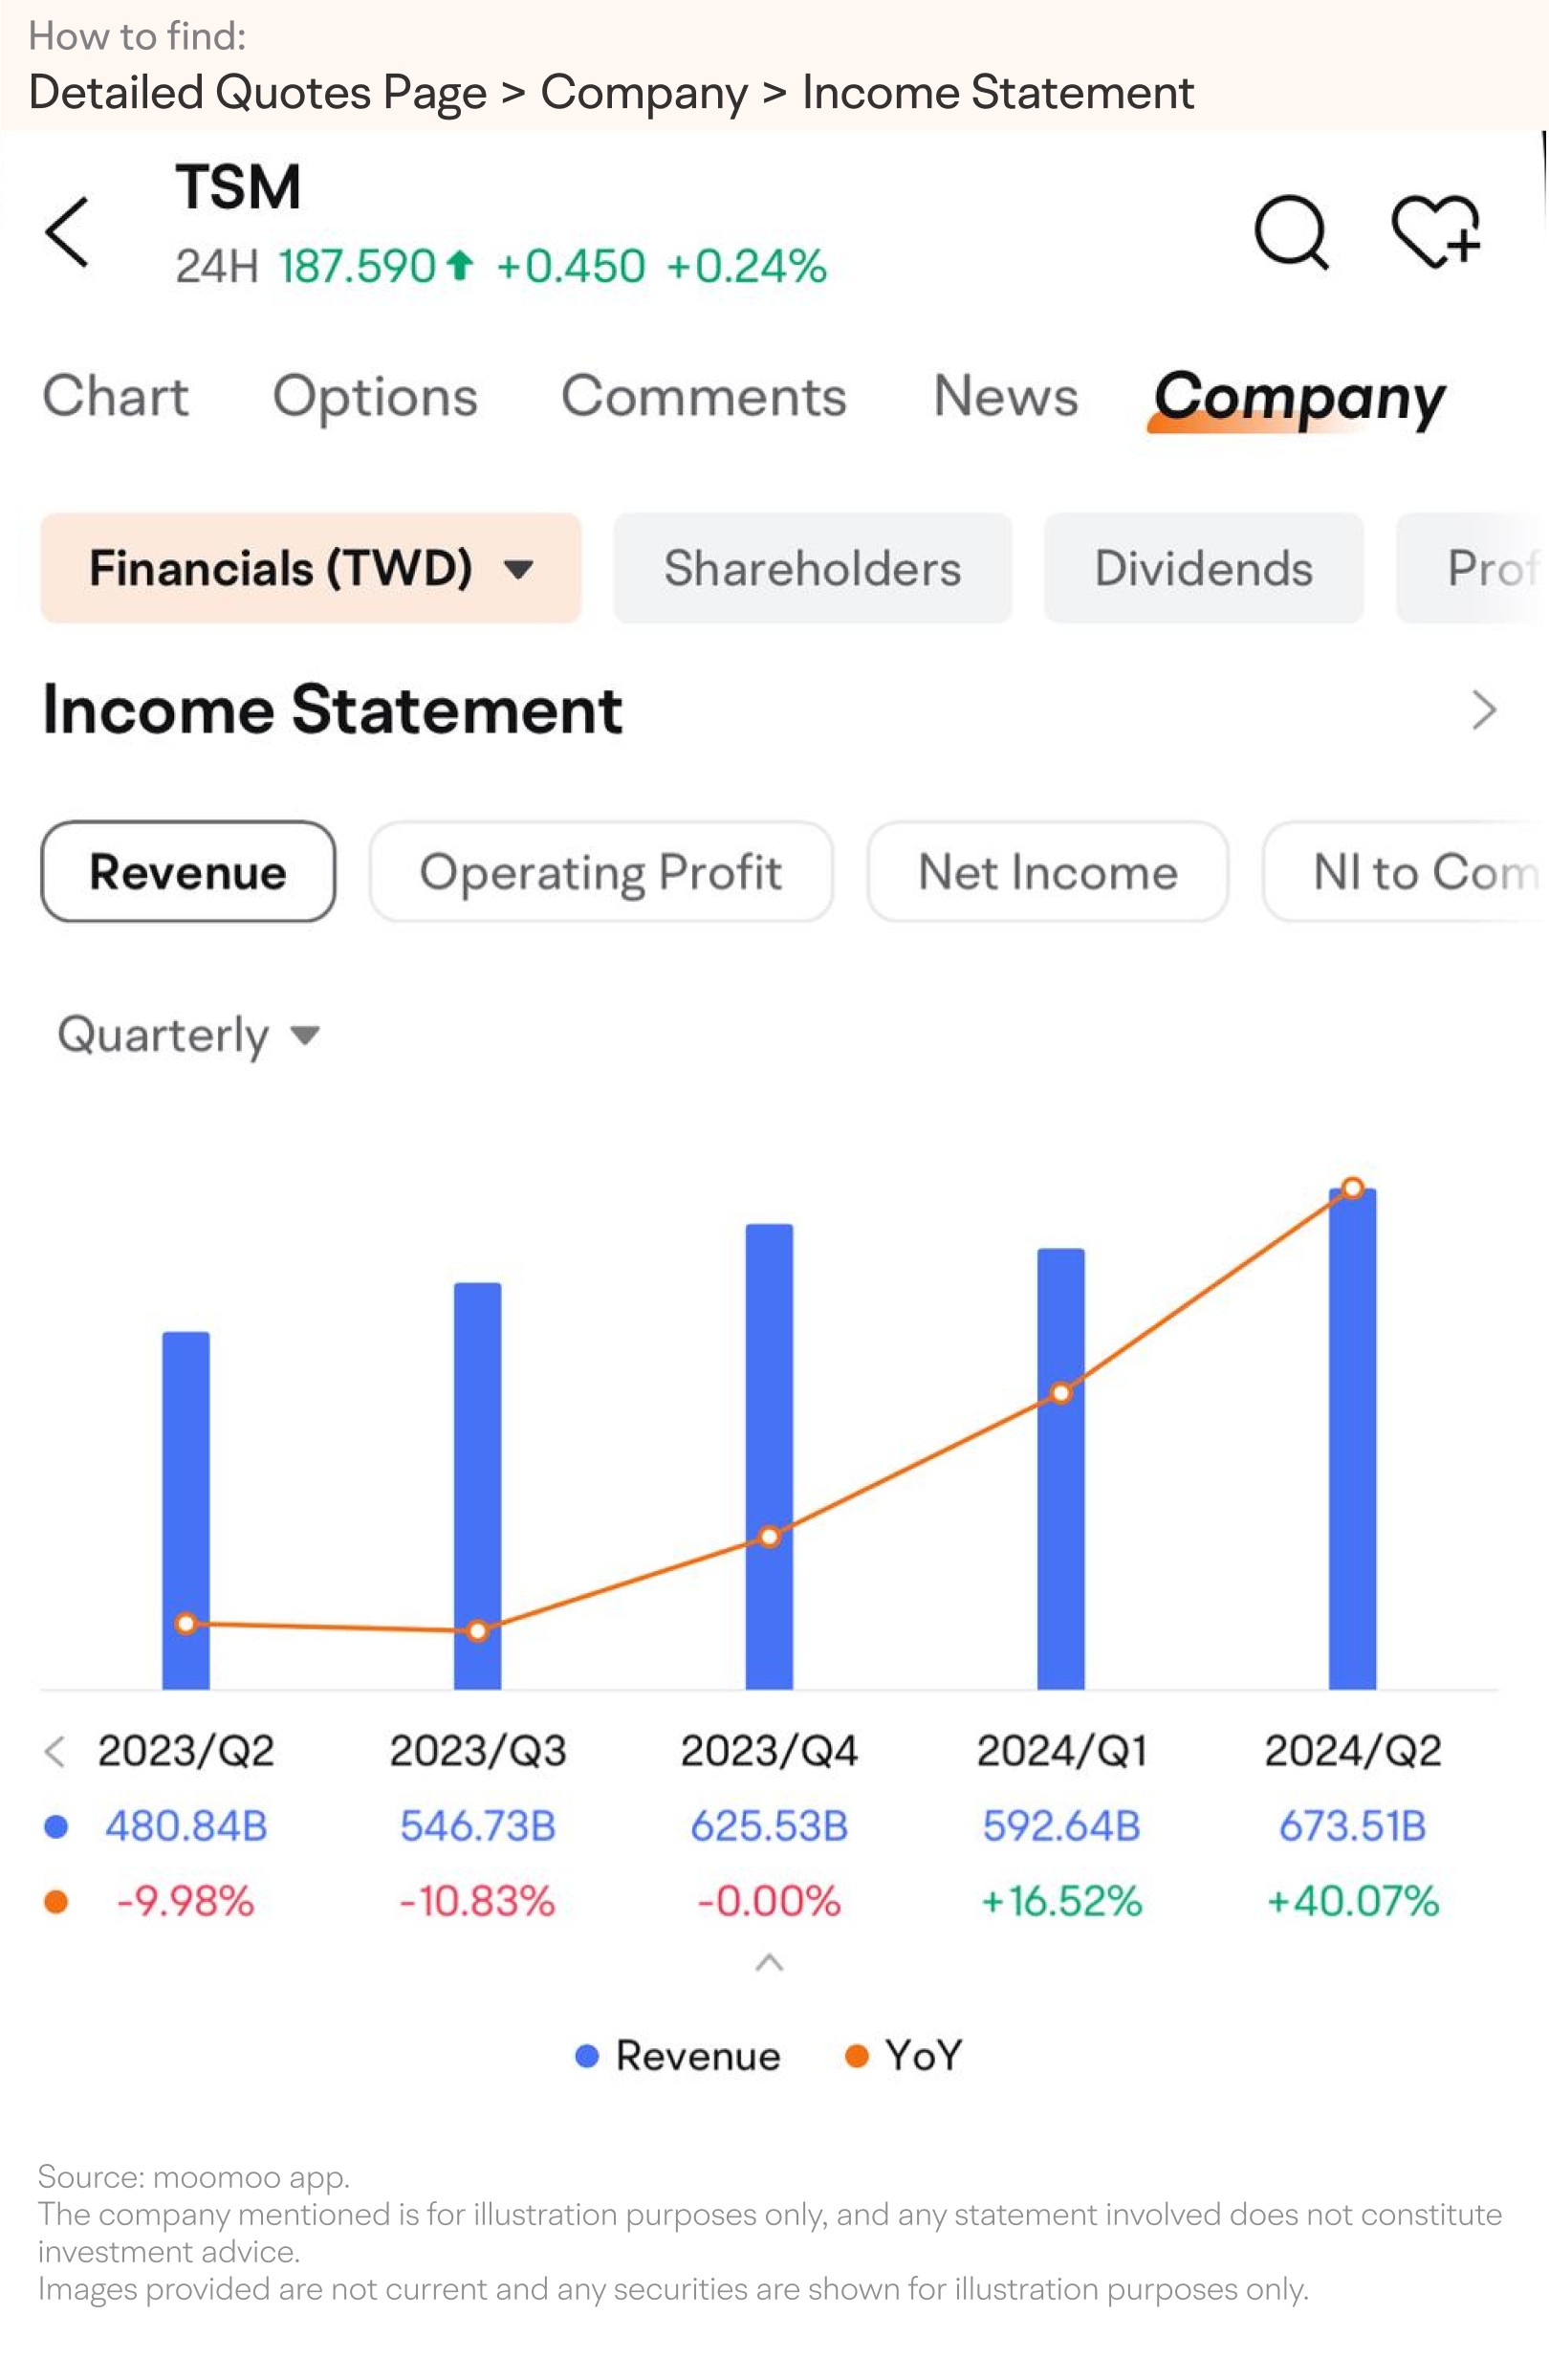
Revenue growth is the primary indicator of demand, but for TSM, the Gross Margin is arguably more critical. TSM has historically maintained high gross margins, often exceeding 50%. This is a testament to its “Value Selling” strategy and its ability to pass on costs to customers. A contraction in gross margin can signal rising raw material costs, lower-than-expected utilization rates at their fabrication plants (fabs), or aggressive pricing from competitors like Samsung or Intel.
Furthermore, investors should monitor the operating margin. This metric reveals how efficiently the company manages its massive overhead, including the research and development (R&D) costs required to stay ahead in the “nanometer race.”
Advanced Node Revenue Share
One of the most unique aspects of TSM’s financial reporting is the breakdown of revenue by technology node. TSM categorizes its revenue based on the size of the transistors on the chips (e.g., 3nm, 5nm, 7nm).
-
Leading-Edge Nodes (3nm and 5nm): These are the high-margin drivers. If the share of revenue from these nodes is increasing, it indicates that TSM is successfully migrating its top-tier customers (like Apple for iPhones or Nvidia for AI GPUs) to its newest, most expensive technology.
-
Mature Nodes (16nm and above): While these have lower margins, they represent steady cash flow from automotive and IoT (Internet of Things) sectors. A balance between high-growth advanced nodes and stable mature nodes is the hallmark of TSM’s financial resilience.

Capital Expenditure (CapEx) Signals
Perhaps the most scrutinized number in TSM’s earnings report is their Capital Expenditure guidance. TSM spends tens of billions of dollars annually to build new fabs and purchase extreme ultraviolet (EUV) lithography machines.
When TSM increases its CapEx, it is a signal of long-term bullishness; they are betting that future demand will justify the massive investment. Conversely, a reduction in CapEx can be seen as a cautionary signal that the semiconductor cycle is cooling. For investors, the CapEx figure is a leading indicator for the equipment manufacturers (such as ASML or Applied Materials) as much as it is for TSM itself.
The Global Economic Impact of TSM’s Financial Performance
TSM is often referred to as the “geopolitical lynchpin” of the modern economy. Because their chips power everything from smartphones to fighter jets, their financial results provide insights into global consumer health and industrial strength.
The Semiconductor Bellwether Effect
Because TSM sits at the very beginning of the global supply chain, its earnings are a “forward-looking” indicator. If TSM reports a slowdown in smartphone chip orders in January, it likely means that consumer electronics companies are expecting a weak spring and summer. If TSM sees a surge in high-performance computing (HPC) demand, it confirms the ongoing institutional investment in Artificial Intelligence and data centers. By watching TSM, investors gain a six-month lead on trends that will eventually show up in the earnings of other Fortune 500 companies.
Geopolitical Risk and Institutional Investor Sentiment
For those managing money, the financial results of TSM are always weighed against the “geopolitical discount.” Because the majority of TSM’s manufacturing capacity is located in Taiwan, the stock often trades at a lower price-to-earnings (P/E) ratio than its US-based peers.
During earnings calls, analysts frequently ask about “geographic diversification”—specifically, the progress of fabs in Arizona, Japan, and Germany. Investors look for updates on the costs and subsidies related to these international expansions. If the costs of building overseas are higher than expected, it could drag on long-term net margins, a factor that value investors must account for in their discounted cash flow (DCF) models.
How to Trade or Invest Around TSM Earnings Announcements
Approaching a TSM earnings report requires a clear strategy. Depending on an investor’s time horizon, the “correct” way to handle the earnings date varies significantly.
Analyzing Forward Guidance vs. Historical Data
The stock market is a discounting mechanism, meaning it cares more about the future than the past. Often, TSM will report “record-breaking” quarterly profits, yet the stock price will fall. This usually happens because the forward guidance—the company’s projection for the next quarter or year—was conservative.
Professional investors listen closely to the management’s commentary on inventory levels. If TSM notes that their customers have too much inventory on hand, it suggests a “correction” is coming, and revenue will likely dip in the following quarters. Identifying the delta between analyst expectations and management’s guidance is where the most profitable trades are found.
Dividend Sustainability and Yield Considerations
For income-focused investors, TSM is a consistent dividend payer. The company has a policy of maintaining a sustainable and increasing dividend. During the earnings report, the board often confirms the dividend payout for the upcoming quarter. Because TSM generates significant free cash flow (FCF), the dividend is generally considered very safe. Investors should calculate the “Dividend Payout Ratio” from the quarterly financials; a lower ratio suggests more room for future dividend hikes or share buybacks, both of which are catalysts for share price appreciation.
Preparing for the Next Earnings Call: A Checklist for Shareholders
As the next reporting date approaches, investors should prepare a checklist to ensure they are making data-driven decisions rather than emotional ones.
-
Check the Consensus Estimates: Use financial news platforms to find the average analyst estimate for EPS and Revenue. This is the “bar” the company needs to clear.
-
Review the Previous Quarter’s Guidance: Re-read the previous transcript to see if management met the goals they set for themselves. Consistency builds institutional trust.
-
Monitor the Currency Impact: TSM reports in New Taiwan Dollars (NTD) but provides US Dollar equivalents. Significant fluctuations in the USD/NTD exchange rate can impact the reported bottom line, even if operational performance is strong.
-
Listen for “AI Contribution”: In the current market environment, the percentage of revenue derived from AI-related chips is a major driver of the stock’s valuation multiple. Any update on the “AI roadmap” will likely result in immediate price action.
TSM is not just a company; it is the infrastructure of the digital age. By tracking when TSM reports earnings and understanding the financial nuances within those reports, investors can navigate the complexities of the tech market with greater confidence and precision. Whether you are looking for long-term capital appreciation or a way to gauge the global economic climate, the TSM earnings call is the one event you cannot afford to miss.
aViewFromTheCave is a participant in the Amazon Services LLC Associates Program, an affiliate advertising program designed to provide a means for sites to earn advertising fees by advertising and linking to Amazon.com. Amazon, the Amazon logo, AmazonSupply, and the AmazonSupply logo are trademarks of Amazon.com, Inc. or its affiliates. As an Amazon Associate we earn affiliate commissions from qualifying purchases.